| Param | Original file | Final file |
|---|---|---|
| Filename | modeM0/AS1A07_142T01_9000003540_23897cztM0_level2.evt | modeM0/AS1A07_142T01_9000003540_23897cztM0_level2_quad_clean.evt |
| Size (bytes) | 506,574,720 | 60,842,880 |
| Size | 483.1 MB | 58.0 MB |
| Events in quadrant A | 3,293,873 | 370,208 |
| Events in quadrant B | 3,392,972 | 372,555 |
| Events in quadrant C | 3,606,393 | 343,849 |
| Events in quadrant D | 4,646,749 | 341,685 |
| Mode M9 | |||
|---|---|---|---|
| Quadrant | BADHDUFLAG | Total packets | Discarded packets |
| A | 0 | 14 | 0 |
| B | 0 | 14 | 0 |
| C | 0 | 14 | 0 |
| D | 0 | 14 | 0 |
| Mode M0 | |||
|---|---|---|---|
| Quadrant | BADHDUFLAG | Total packets | Discarded packets |
| A | 0 | 13489 | 1 |
| B | 0 | 13709 | 1 |
| C | 0 | 14332 | 1 |
| D | 0 | 17750 | 1 |
| Mode SS | |||
|---|---|---|---|
| Quadrant | BADHDUFLAG | Total packets | Discarded packets |
| A | 0 | 120 | 0 |
| B | 0 | 120 | 0 |
| C | 0 | 120 | 0 |
| D | 0 | 120 | 0 |
| Quadrant | Total seconds | Saturated seconds | Saturation percentage |
|---|---|---|---|
| A | 5923 | 70 | 1.181834% |
| B | 5924 | 83 | 1.401080% |
| C | 5924 | 238 | 4.017556% |
| D | 5924 | 504 | 8.507765% |
Noise dominated data is calculated using 1-second bins in cleaned event files. If a bin has >2000 counts, and if more than 50% of those come from <1% of pixels, then it is considered to be noise-dominated and hence unusable.
| Quadrant | # 1 sec bins | Bins with >0 counts | Bins with >2000 counts | High rate bins dominated by noise | Noise dominated (total time) | Noise dominated (detector-on time) | Marked lightcurve |
|---|---|---|---|---|---|---|---|
| A | 7273 | 5924 | 0 | 0 | 0.00% | 0.00% | 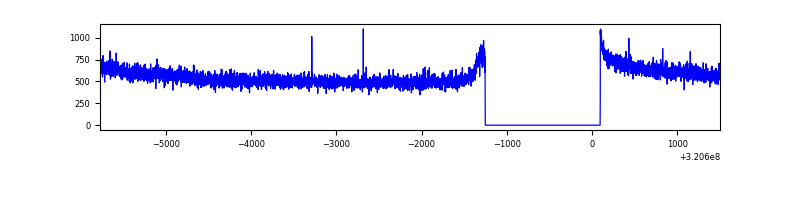 |
| B | 7274 | 5925 | 5 | 5 | 0.07% | 0.08% | 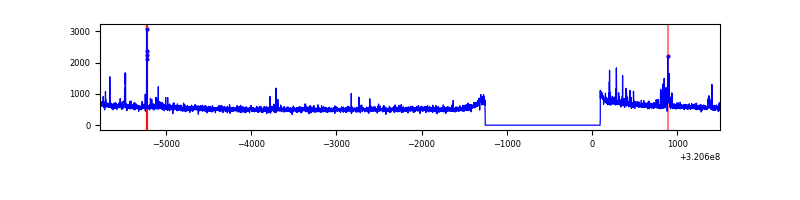 |
| C | 7274 | 5925 | 66 | 66 | 0.91% | 1.11% | 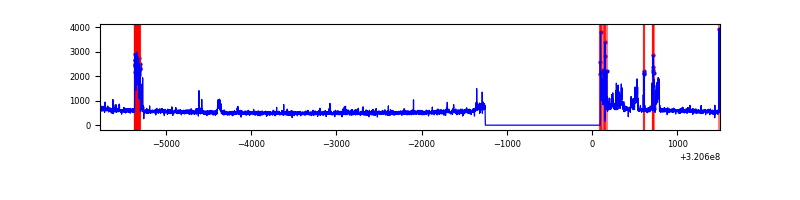 |
| D | 7273 | 5924 | 330 | 330 | 4.54% | 5.57% | 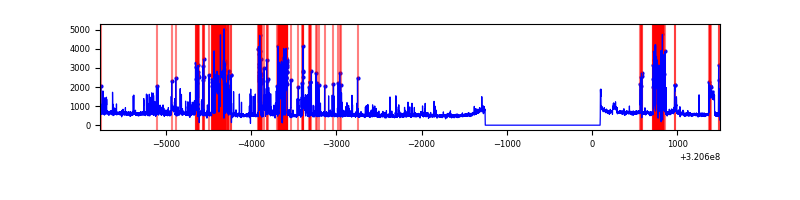 |
Top three noisy pixels from each quadrant. If the there are fewer than three noisy pixels in the level2.evt file, extra rows are filled as -1
| Pixel properties | Quadrant properties | ||||||
|---|---|---|---|---|---|---|---|
| Quadrant | DetID | PixID | Counts | Sigma | Mean | Median | Sigma |
| A | 13 | 254 | 10582 | 58.0 | 854 | 840 | 168.0 |
| A | 0 | 226 | 7618 | 40.35 | 854 | 840 | 168.0 |
| A | 3 | 137 | 6533 | 33.89 | 854 | 840 | 168.0 |
| B | 15 | 33 | 48281 | 303.21 | 842 | 825 | 156.5 |
| B | 0 | 190 | 20054 | 122.86 | 842 | 825 | 156.5 |
| B | 0 | 228 | 18310 | 111.72 | 842 | 825 | 156.5 |
| C | 7 | 247 | 281895 | 1573.81 | 786 | 795 | 178.6 |
| C | 0 | 10 | 132419 | 736.93 | 786 | 795 | 178.6 |
| C | 14 | 238 | 128640 | 715.77 | 786 | 795 | 178.6 |
| D | 12 | 218 | 1431537 | 7633.87 | 781 | 760 | 187.4 |
| D | 1 | 52 | 73464 | 387.91 | 781 | 760 | 187.4 |
| D | 12 | 250 | 53469 | 281.23 | 781 | 760 | 187.4 |
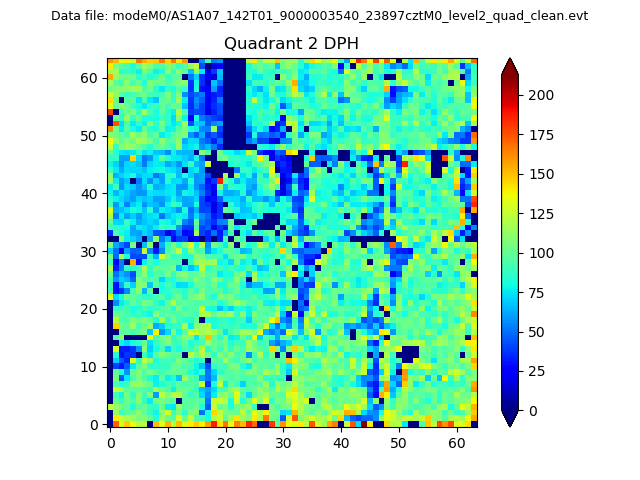
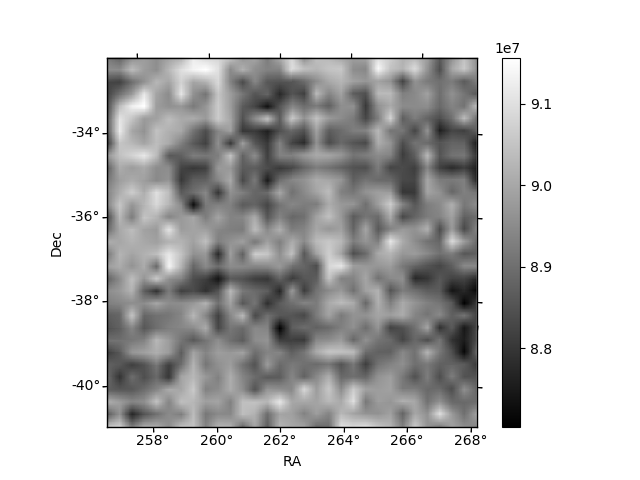
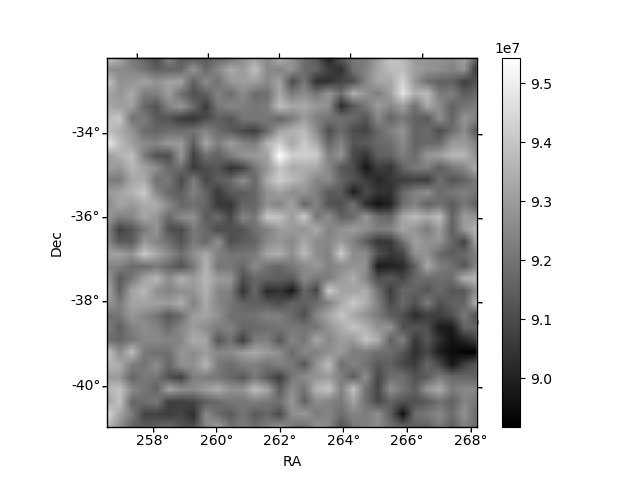
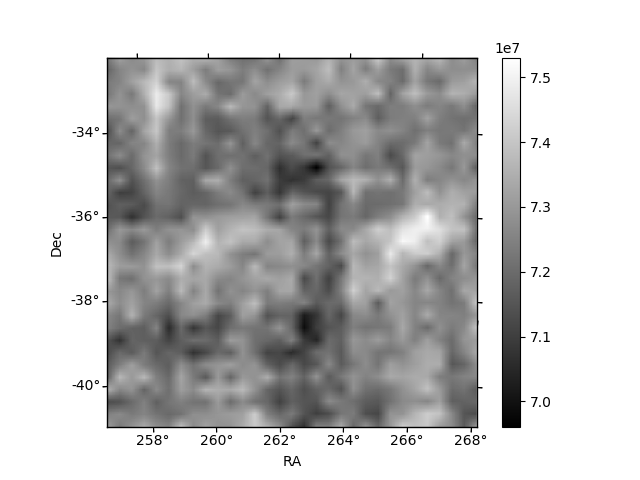
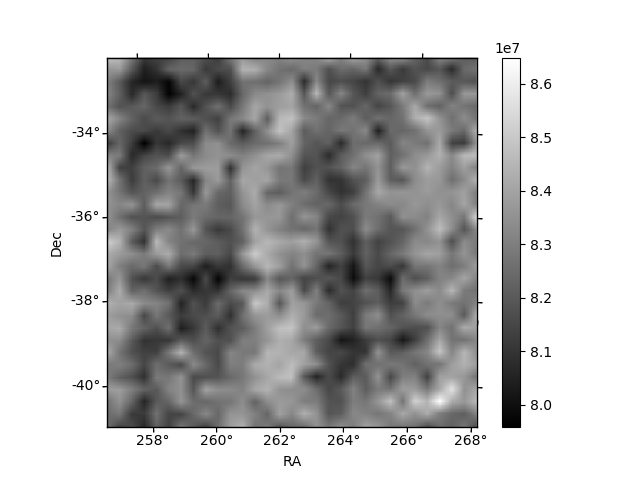
Histogram calculated using DETX and DETY for each event in the final _common_clean file
| Quadrant A |  |
 |
Quadrant B |
|---|---|---|---|
| Quadrant D |  |
 |
Quadrant C |
| Plot type | Count rate plots | Images |
|---|---|---|
| Comparison with Poisson distribution Blue bars denote a histogram of data divided into 1 sec bins. Red curve is a Poisson curve with rate = median count rate of data. |
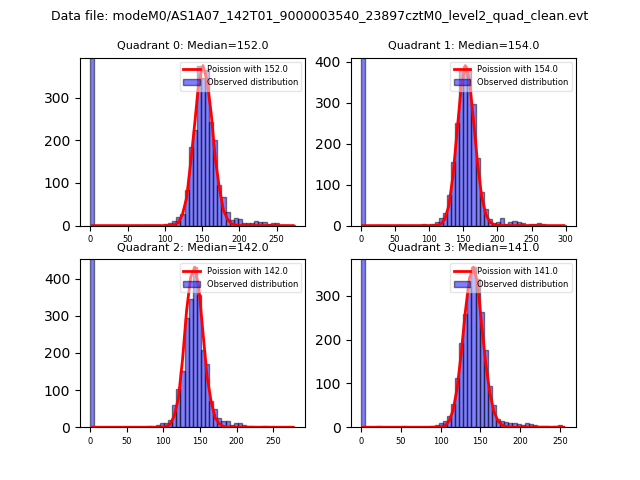 |
 |
| Quadrant-wise count rates Data is divided into 100 sec bins |
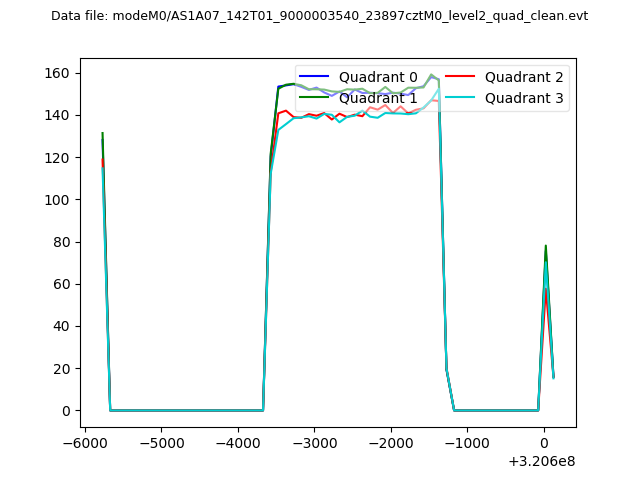 |
|
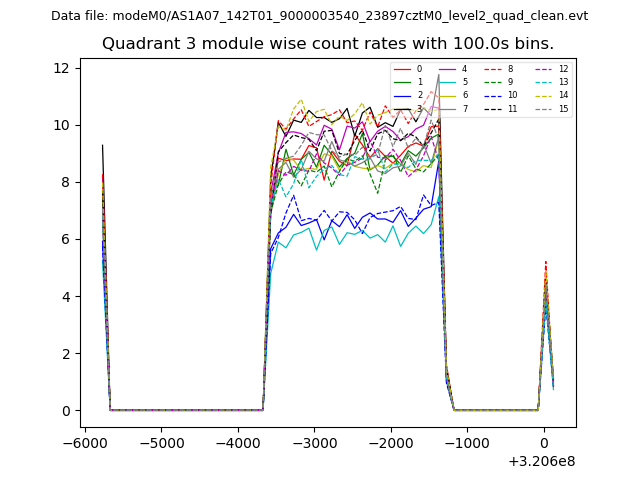
| Module-wise count rates for Quadrant A Data is divided into 100 sec bins |
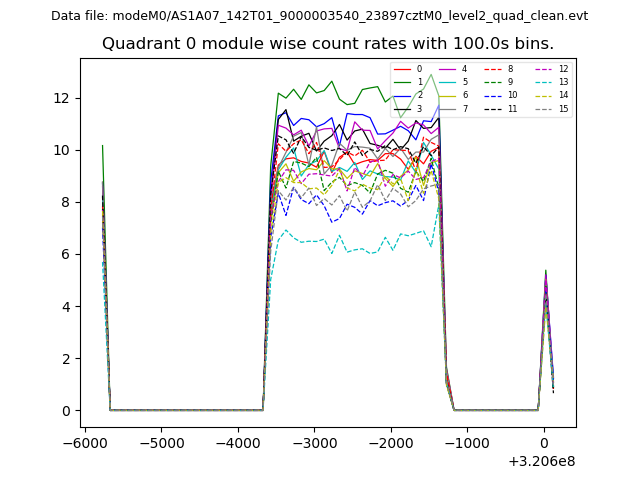 |
 |
| Module-wise count rates for Quadrant B Data is divided into 100 sec bins |
 |
 |
| Module-wise count rates for Quadrant C Data is divided into 100 sec bins |
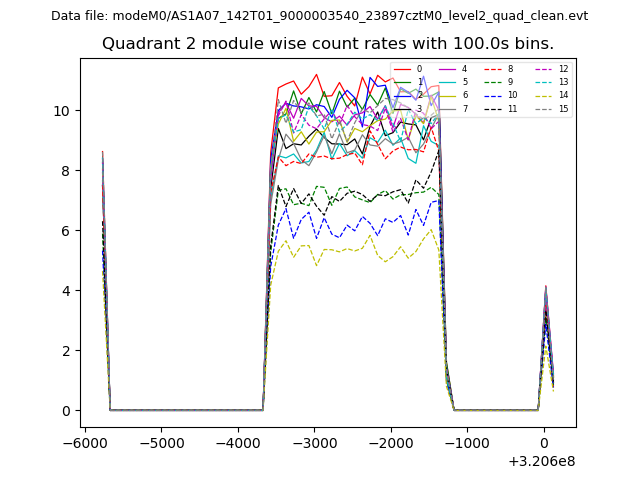 |
 |
| Module-wise count rates for Quadrant D Data is divided into 100 sec bins |
 |
 |
| Parameter | Plot |
|---|---|
| CZT HV Monitor |  |
| D_VDD | 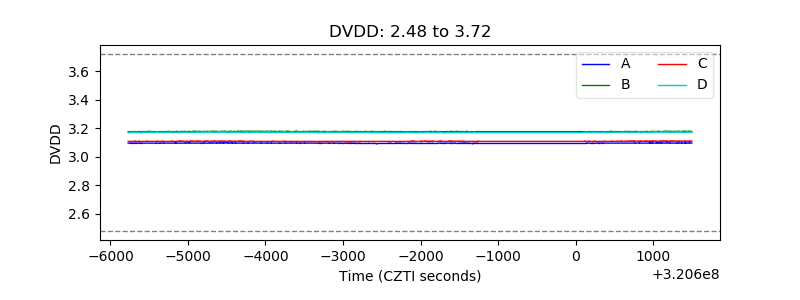 |
| Temperature 1 | 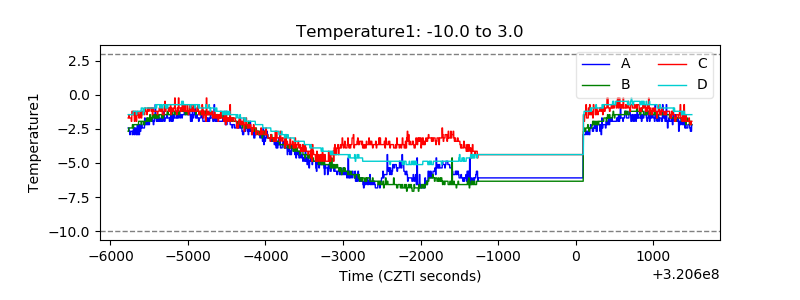 |
| Veto HV Monitor | 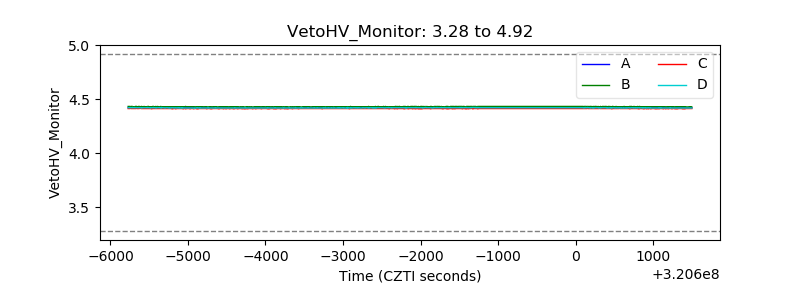 |
| Veto LLD | 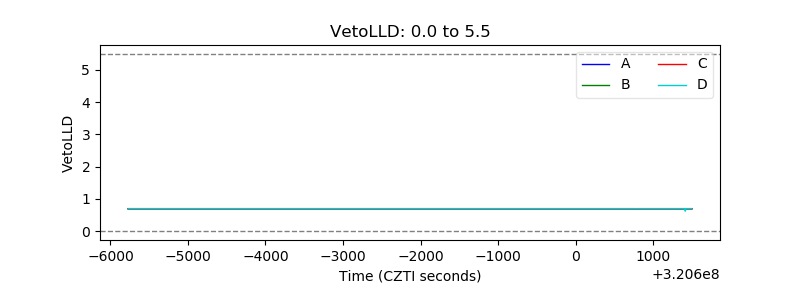 |
| Alpha Counter | 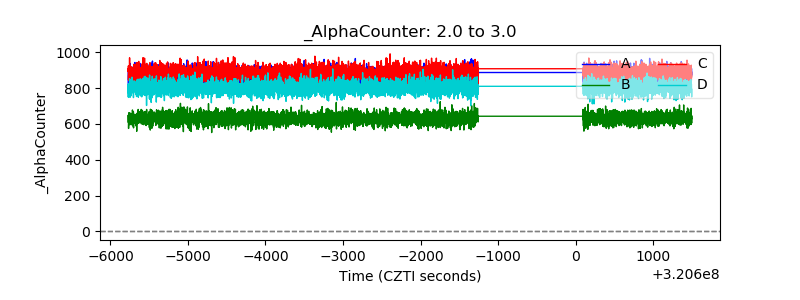 |
| _CPM_Rate | 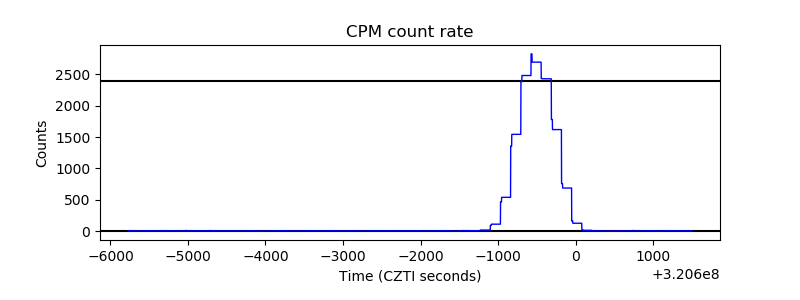 |
| CZT Counter | 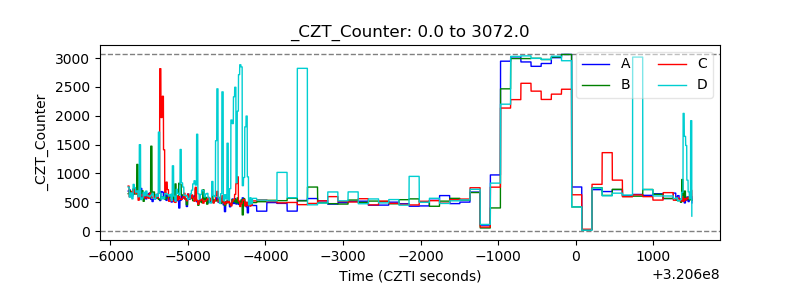 |
| +2.5 Volts monitor |  |
| +5 Volts monitor | 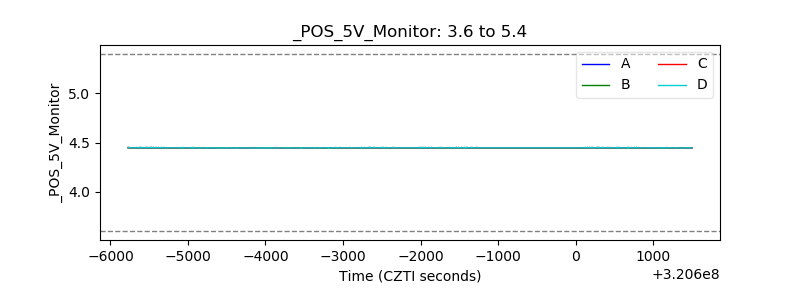 |
| _ROLL_ROT | 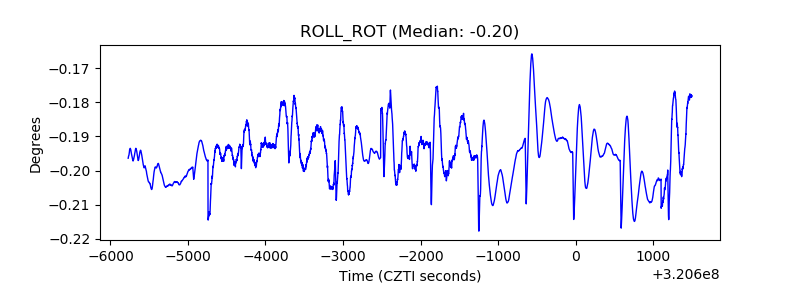 |
| _Roll_DEC | 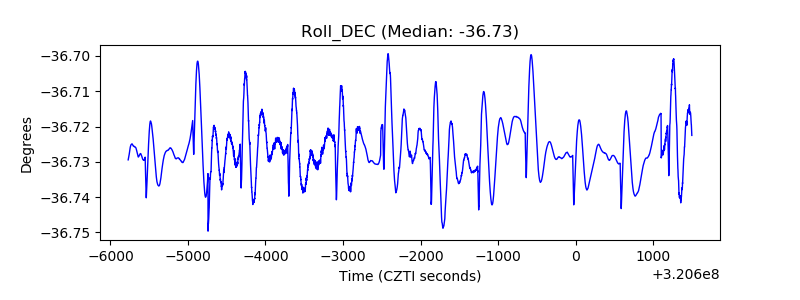 |
| _Roll_RA | 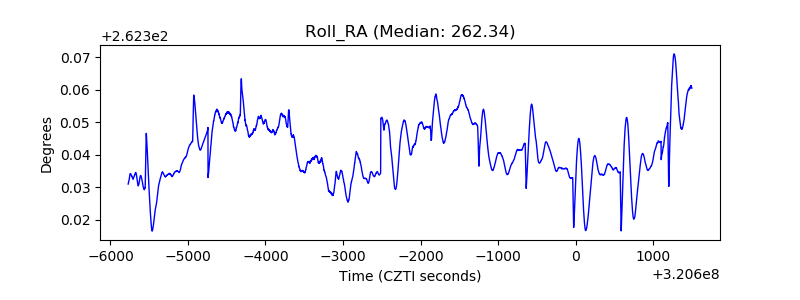 |
| Veto Counter | 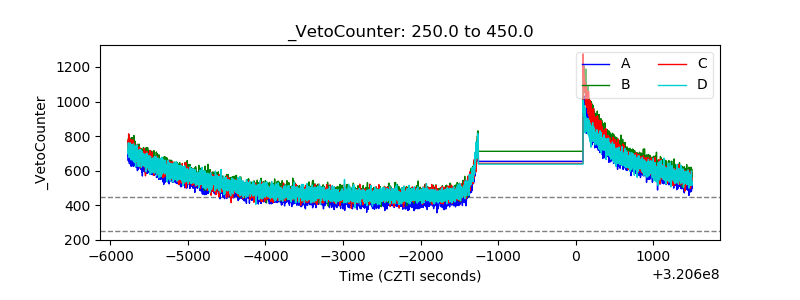 |