| Param | Original file | Final file |
|---|---|---|
| Filename | modeM0/AS1A07_142T01_9000003540_23898cztM0_level2.evt | modeM0/AS1A07_142T01_9000003540_23898cztM0_level2_quad_clean.evt |
| Size (bytes) | 599,224,320 | 67,449,600 |
| Size | 571.5 MB | 64.3 MB |
| Events in quadrant A | 3,492,402 | 424,475 |
| Events in quadrant B | 3,587,120 | 426,486 |
| Events in quadrant C | 3,801,985 | 395,074 |
| Events in quadrant D | 6,848,212 | 365,540 |
| Mode M9 | |||
|---|---|---|---|
| Quadrant | BADHDUFLAG | Total packets | Discarded packets |
| A | 0 | 16 | 0 |
| B | 0 | 17 | 0 |
| C | 0 | 17 | 0 |
| D | 0 | 17 | 0 |
| Mode M0 | |||
|---|---|---|---|
| Quadrant | BADHDUFLAG | Total packets | Discarded packets |
| A | 0 | 14301 | 2 |
| B | 0 | 14502 | 2 |
| C | 0 | 15032 | 2 |
| D | 0 | 24800 | 2 |
| Mode SS | |||
|---|---|---|---|
| Quadrant | BADHDUFLAG | Total packets | Discarded packets |
| A | 0 | 124 | 0 |
| B | 0 | 124 | 0 |
| C | 0 | 124 | 0 |
| D | 0 | 124 | 0 |
| Quadrant | Total seconds | Saturated seconds | Saturation percentage |
|---|---|---|---|
| A | 6172 | 94 | 1.523007% |
| B | 6172 | 115 | 1.863253% |
| C | 6172 | 270 | 4.374595% |
| D | 6172 | 1597 | 25.874919% |
Noise dominated data is calculated using 1-second bins in cleaned event files. If a bin has >2000 counts, and if more than 50% of those come from <1% of pixels, then it is considered to be noise-dominated and hence unusable.
| Quadrant | # 1 sec bins | Bins with >0 counts | Bins with >2000 counts | High rate bins dominated by noise | Noise dominated (total time) | Noise dominated (detector-on time) | Marked lightcurve |
|---|---|---|---|---|---|---|---|
| A | 7552 | 6173 | 0 | 0 | 0.00% | 0.00% | 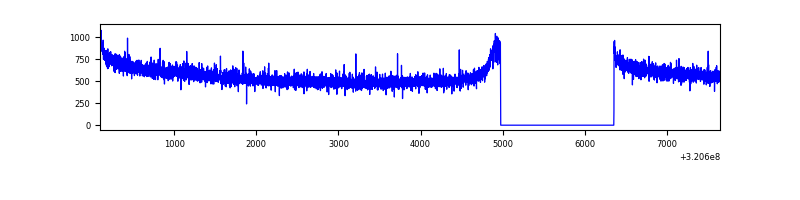 |
| B | 7552 | 6173 | 3 | 3 | 0.04% | 0.05% | 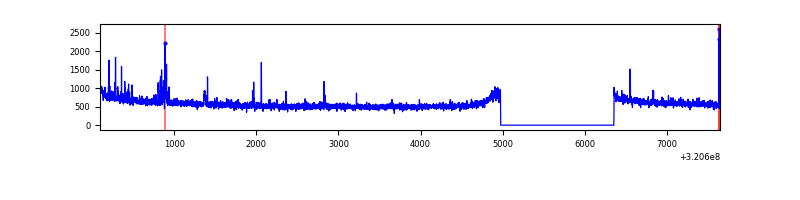 |
| C | 7552 | 6173 | 58 | 58 | 0.77% | 0.94% | 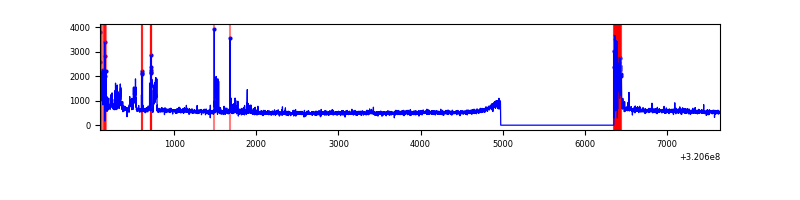 |
| D | 7552 | 6172 | 902 | 902 | 11.94% | 14.61% | 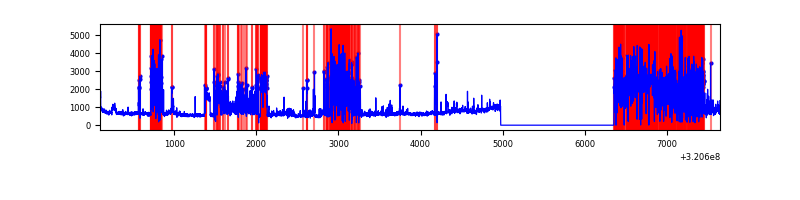 |
Top three noisy pixels from each quadrant. If the there are fewer than three noisy pixels in the level2.evt file, extra rows are filled as -1
| Pixel properties | Quadrant properties | ||||||
|---|---|---|---|---|---|---|---|
| Quadrant | DetID | PixID | Counts | Sigma | Mean | Median | Sigma |
| A | 13 | 254 | 10138 | 51.38 | 907 | 892 | 180.0 |
| A | 0 | 226 | 7854 | 38.69 | 907 | 892 | 180.0 |
| A | 3 | 137 | 6796 | 32.81 | 907 | 892 | 180.0 |
| B | 15 | 33 | 39929 | 240.24 | 895 | 880 | 162.5 |
| B | 12 | 111 | 18101 | 105.95 | 895 | 880 | 162.5 |
| B | 5 | 172 | 17892 | 104.66 | 895 | 880 | 162.5 |
| C | 0 | 10 | 285530 | 1502.32 | 831 | 839 | 189.5 |
| C | 7 | 247 | 144623 | 758.75 | 831 | 839 | 189.5 |
| C | 14 | 238 | 135838 | 712.39 | 831 | 839 | 189.5 |
| D | 12 | 218 | 3097350 | 17926.5 | 722 | 704 | 172.7 |
| D | 7 | 238 | 343282 | 1983.19 | 722 | 704 | 172.7 |
| D | 12 | 250 | 250478 | 1445.94 | 722 | 704 | 172.7 |
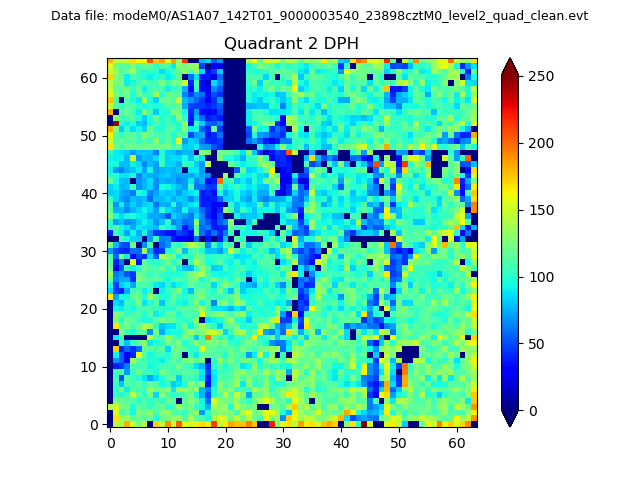
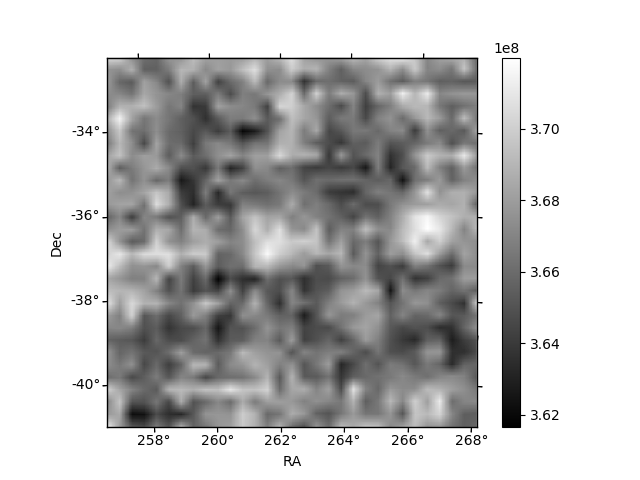
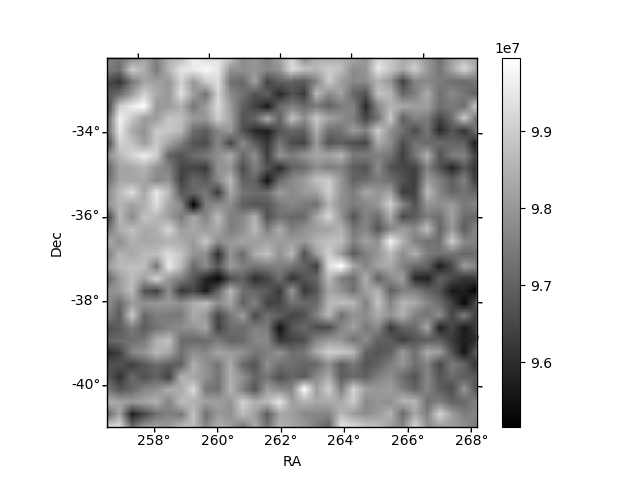
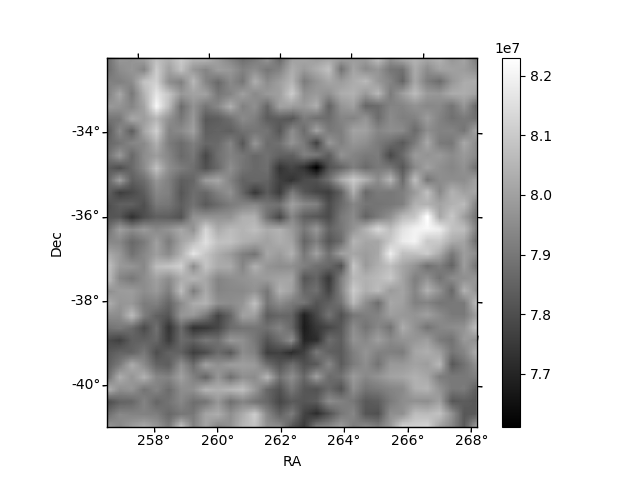
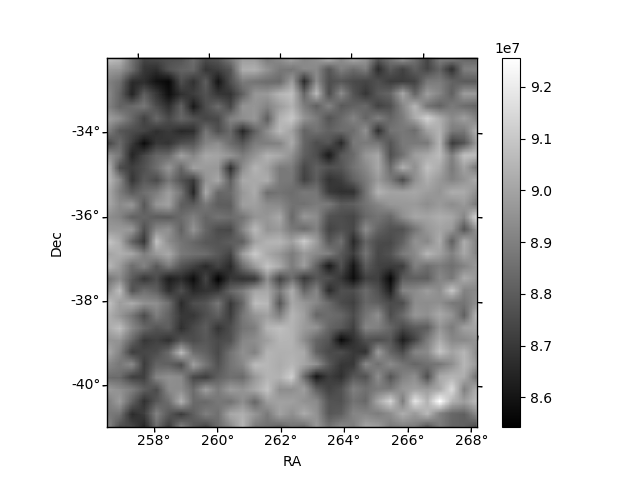
Histogram calculated using DETX and DETY for each event in the final _common_clean file
| Quadrant A | 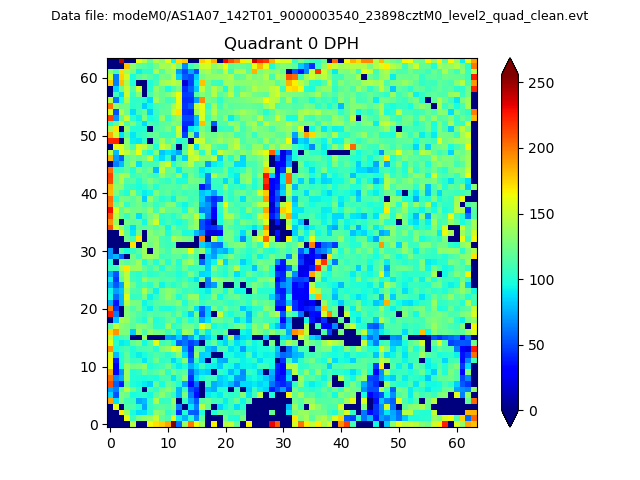 |
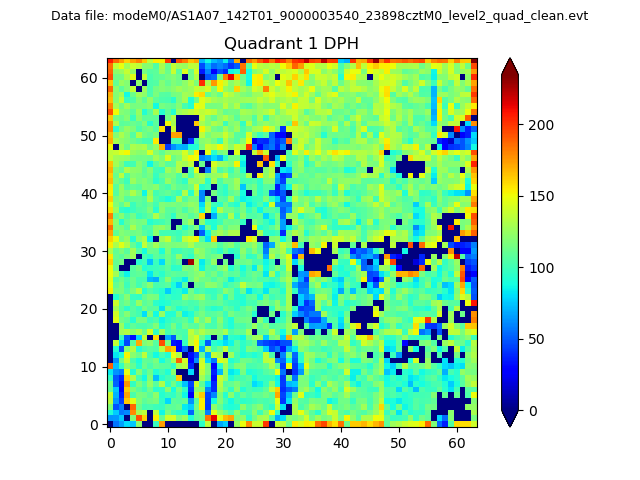 |
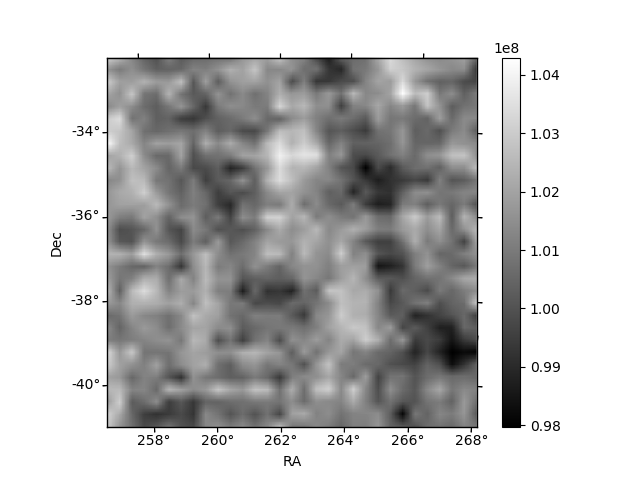
Quadrant B |
|---|---|---|---|
| Quadrant D | 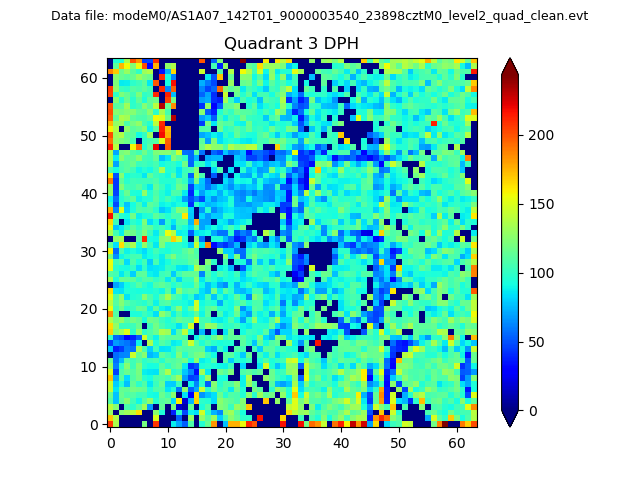 |
 |
Quadrant C |
| Plot type | Count rate plots | Images |
|---|---|---|
| Comparison with Poisson distribution Blue bars denote a histogram of data divided into 1 sec bins. Red curve is a Poisson curve with rate = median count rate of data. |
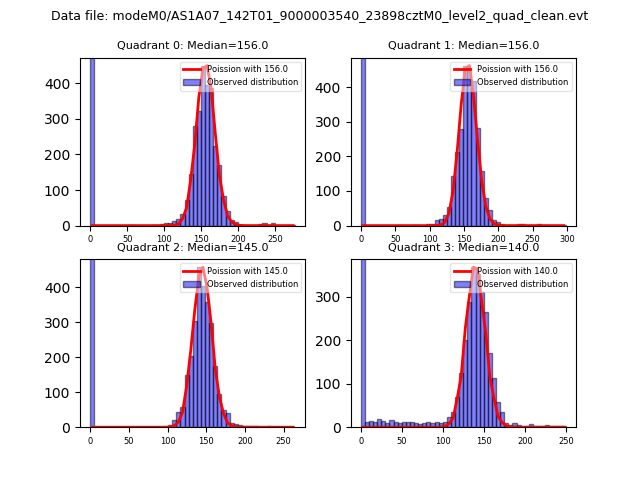 |
 |
| Quadrant-wise count rates Data is divided into 100 sec bins |
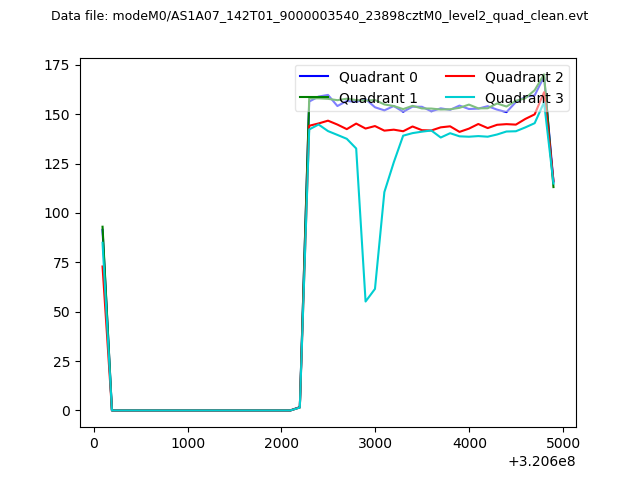 |
|
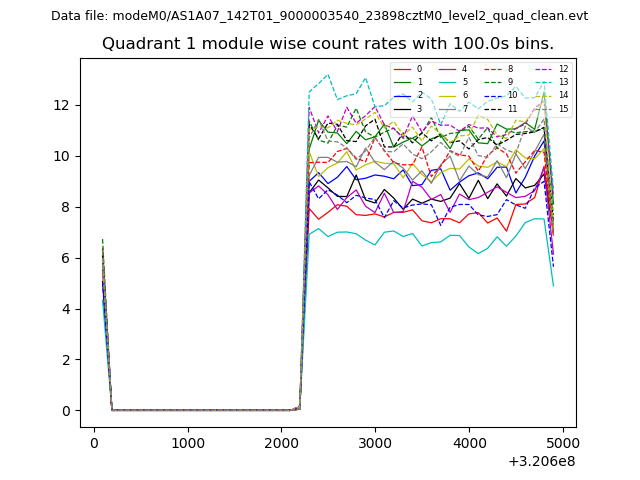
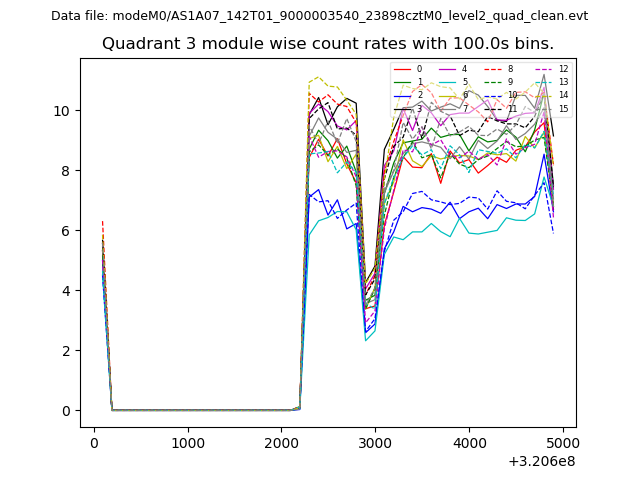
| Module-wise count rates for Quadrant A Data is divided into 100 sec bins |
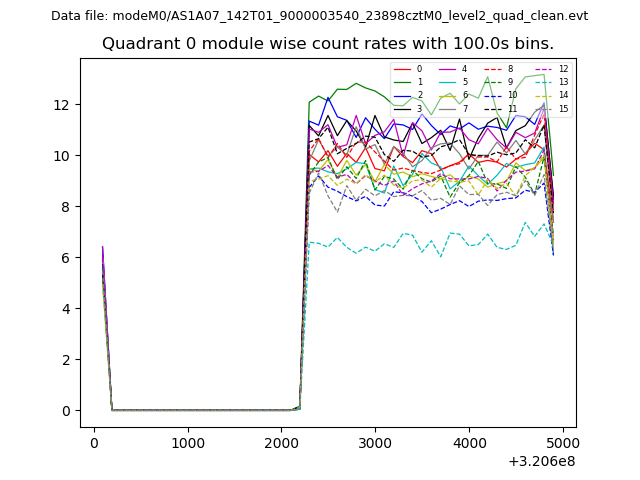 |
 |
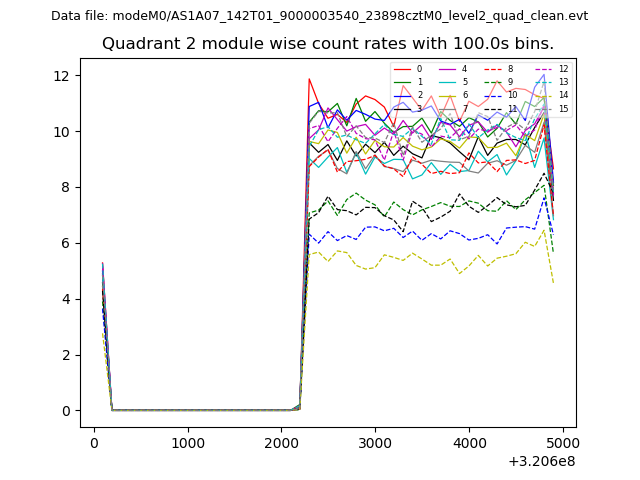
| Module-wise count rates for Quadrant B Data is divided into 100 sec bins |
 |
 |
| Module-wise count rates for Quadrant C Data is divided into 100 sec bins |
 |
 |
| Module-wise count rates for Quadrant D Data is divided into 100 sec bins |
 |
 |
| Parameter | Plot |
|---|---|
| CZT HV Monitor | 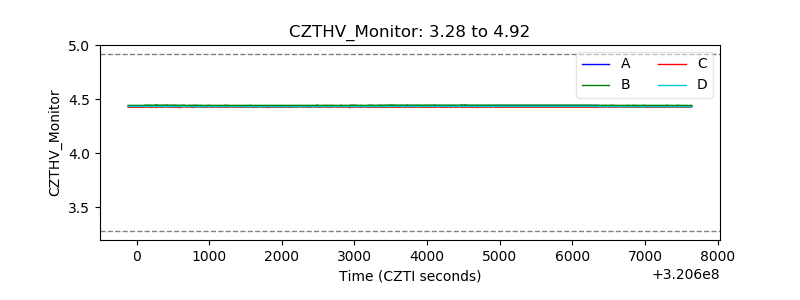 |
| D_VDD | 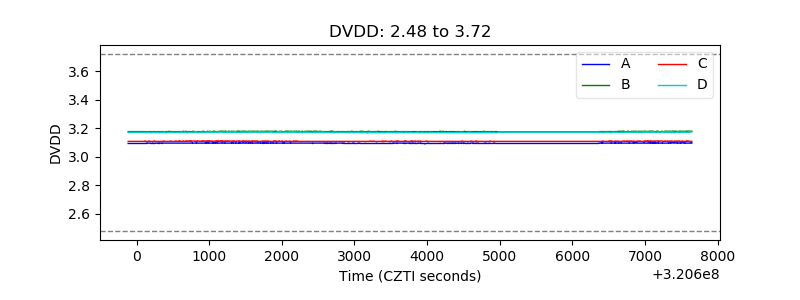 |
| Temperature 1 | 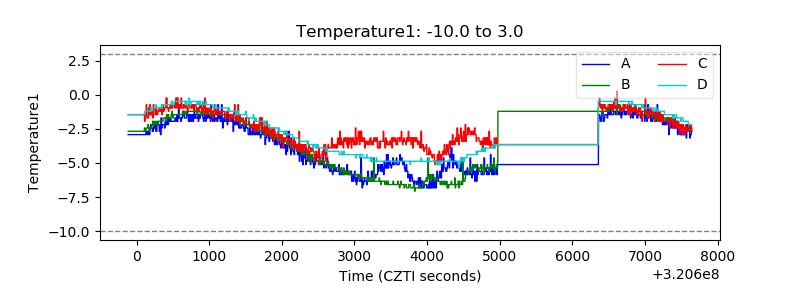 |
| Veto HV Monitor | 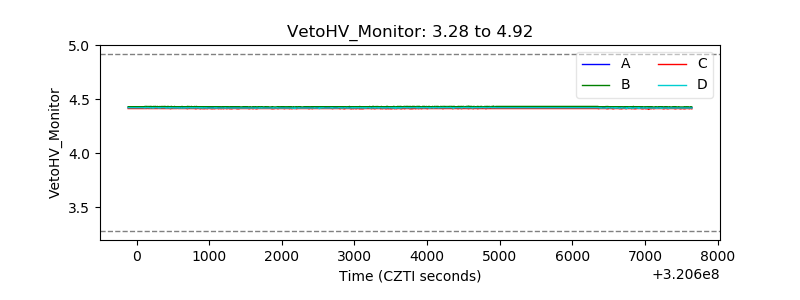 |
| Veto LLD | 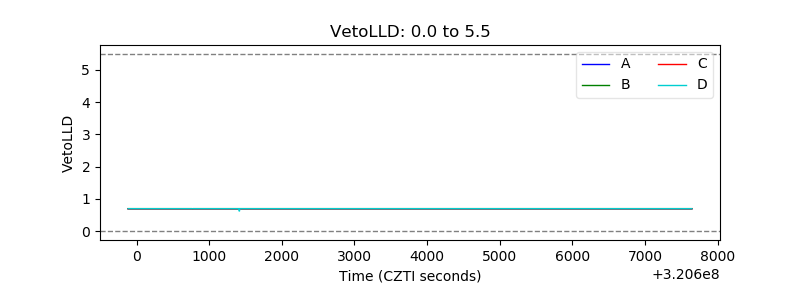 |
| Alpha Counter | 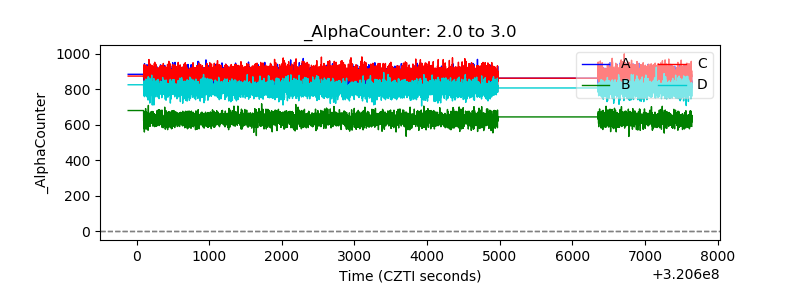 |
| _CPM_Rate | 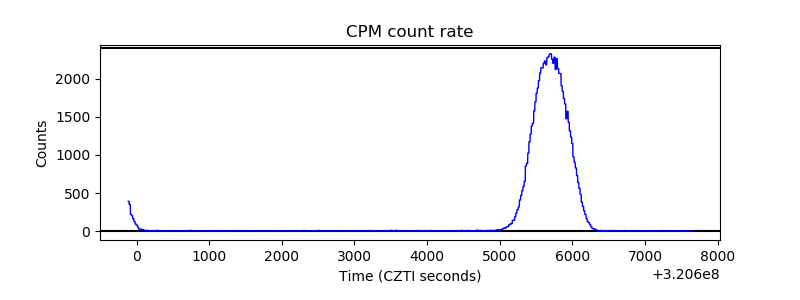 |
| CZT Counter | 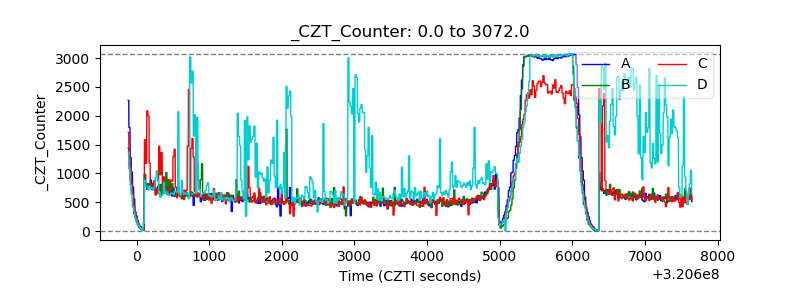 |
| +2.5 Volts monitor |  |
| +5 Volts monitor |  |
| _ROLL_ROT | 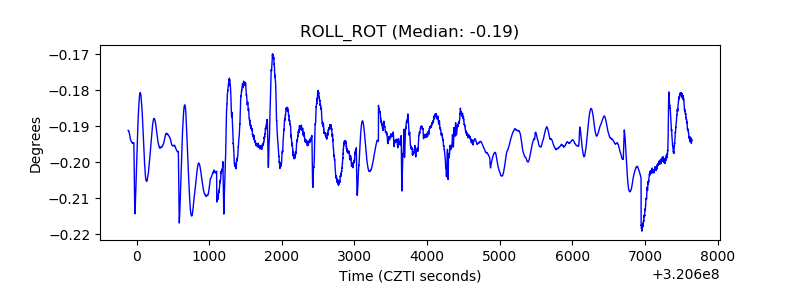 |
| _Roll_DEC | 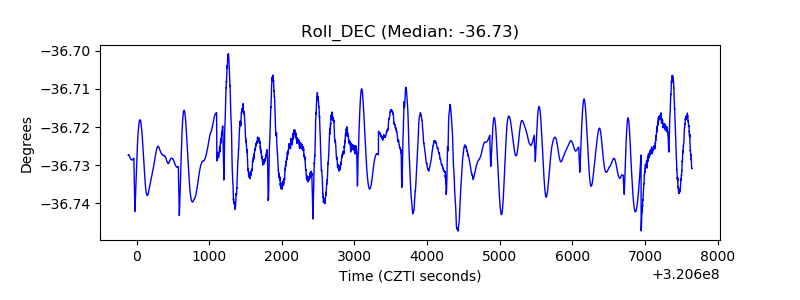 |
| _Roll_RA | 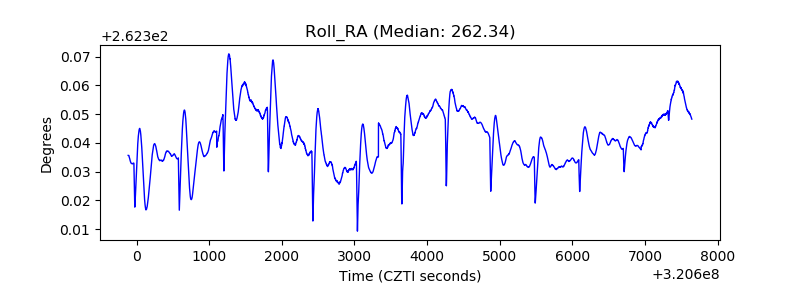 |
| Veto Counter | 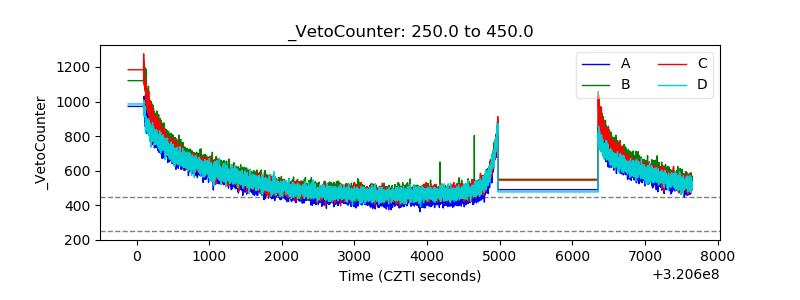 |