| Param | Original file | Final file |
|---|---|---|
| Filename | modeM0/AS1A07_142T01_9000003540_23899cztM0_level2.evt | modeM0/AS1A07_142T01_9000003540_23899cztM0_level2_quad_clean.evt |
| Size (bytes) | 583,070,400 | 75,150,720 |
| Size | 556.1 MB | 71.7 MB |
| Events in quadrant A | 3,386,501 | 479,243 |
| Events in quadrant B | 3,446,402 | 483,077 |
| Events in quadrant C | 3,514,291 | 448,733 |
| Events in quadrant D | 6,885,604 | 426,540 |
| Mode M9 | |||
|---|---|---|---|
| Quadrant | BADHDUFLAG | Total packets | Discarded packets |
| A | 0 | 12 | 0 |
| B | 0 | 12 | 0 |
| C | 0 | 12 | 0 |
| D | 0 | 12 | 0 |
| Mode M0 | |||
|---|---|---|---|
| Quadrant | BADHDUFLAG | Total packets | Discarded packets |
| A | 0 | 13883 | 2 |
| B | 0 | 13984 | 2 |
| C | 0 | 14137 | 2 |
| D | 0 | 24614 | 2 |
| Mode SS | |||
|---|---|---|---|
| Quadrant | BADHDUFLAG | Total packets | Discarded packets |
| A | 0 | 130 | 0 |
| B | 0 | 130 | 0 |
| C | 0 | 130 | 0 |
| D | 0 | 130 | 0 |
| Quadrant | Total seconds | Saturated seconds | Saturation percentage |
|---|---|---|---|
| A | 6264 | 105 | 1.676245% |
| B | 6265 | 121 | 1.931365% |
| C | 6265 | 204 | 3.256185% |
| D | 6265 | 1680 | 26.815642% |
Noise dominated data is calculated using 1-second bins in cleaned event files. If a bin has >2000 counts, and if more than 50% of those come from <1% of pixels, then it is considered to be noise-dominated and hence unusable.
| Quadrant | # 1 sec bins | Bins with >0 counts | Bins with >2000 counts | High rate bins dominated by noise | Noise dominated (total time) | Noise dominated (detector-on time) | Marked lightcurve |
|---|---|---|---|---|---|---|---|
| A | 7544 | 6265 | 0 | 0 | 0.00% | 0.00% | 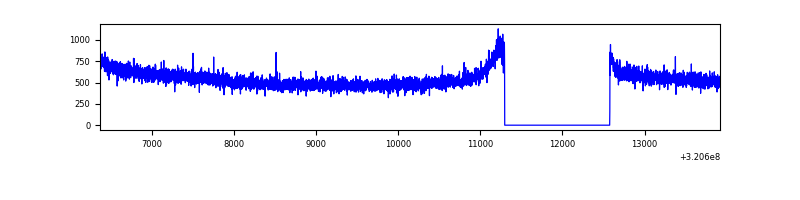 |
| B | 7545 | 6266 | 2 | 2 | 0.03% | 0.03% | 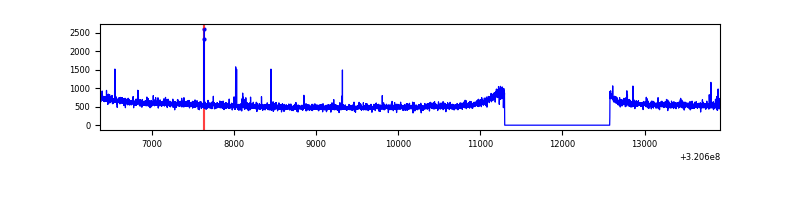 |
| C | 7545 | 6266 | 41 | 41 | 0.54% | 0.65% | 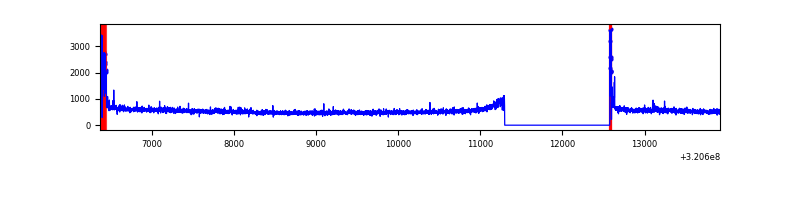 |
| D | 7545 | 6265 | 972 | 972 | 12.88% | 15.51% | 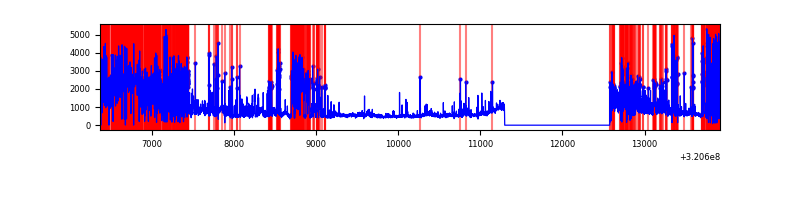 |
Top three noisy pixels from each quadrant. If the there are fewer than three noisy pixels in the level2.evt file, extra rows are filled as -1
| Pixel properties | Quadrant properties | ||||||
|---|---|---|---|---|---|---|---|
| Quadrant | DetID | PixID | Counts | Sigma | Mean | Median | Sigma |
| A | 13 | 254 | 10383 | 54.63 | 878 | 863 | 174.3 |
| A | 0 | 226 | 7715 | 39.32 | 878 | 863 | 174.3 |
| A | 3 | 137 | 7003 | 35.23 | 878 | 863 | 174.3 |
| B | 12 | 111 | 18206 | 107.3 | 873 | 856 | 161.7 |
| B | 11 | 111 | 16131 | 94.47 | 873 | 856 | 161.7 |
| B | 0 | 189 | 14602 | 85.01 | 873 | 856 | 161.7 |
| C | 0 | 10 | 162626 | 860.19 | 816 | 824 | 188.1 |
| C | 14 | 238 | 131983 | 697.29 | 816 | 824 | 188.1 |
| C | 7 | 247 | 34933 | 181.34 | 816 | 824 | 188.1 |
| D | 12 | 218 | 3398754 | 20126.25 | 696 | 677 | 168.8 |
| D | 12 | 250 | 260958 | 1541.6 | 696 | 677 | 168.8 |
| D | 12 | 202 | 161516 | 952.62 | 696 | 677 | 168.8 |
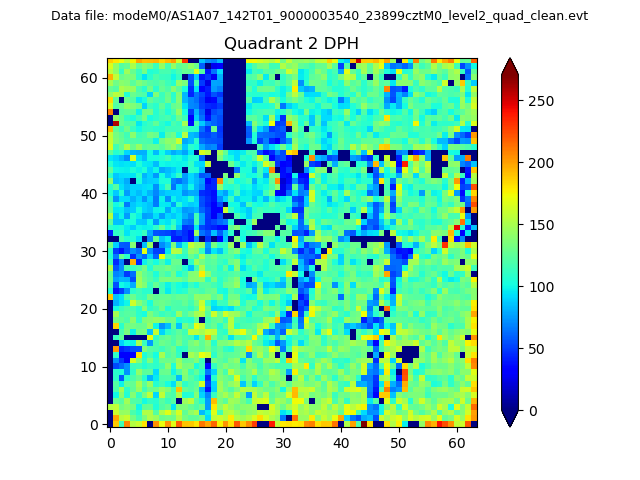
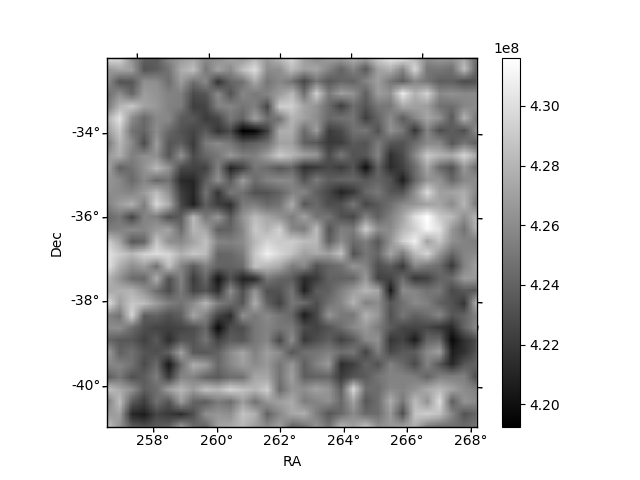
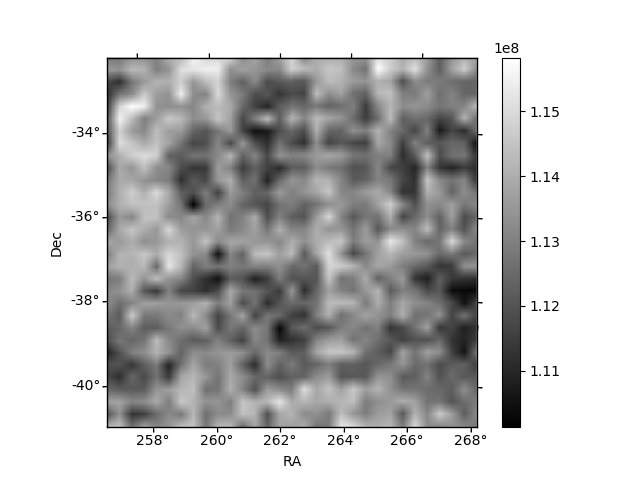
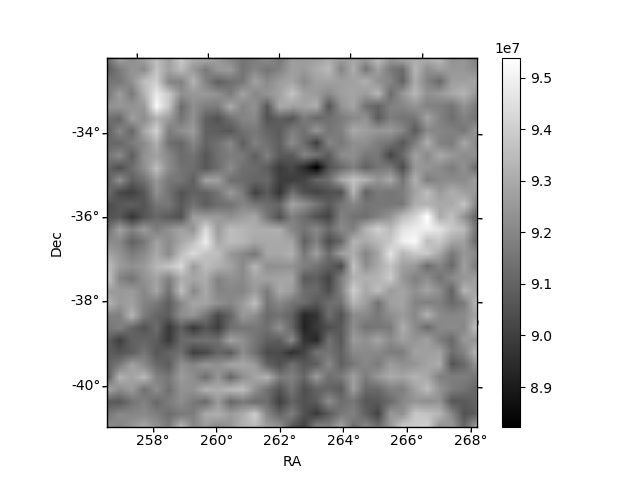
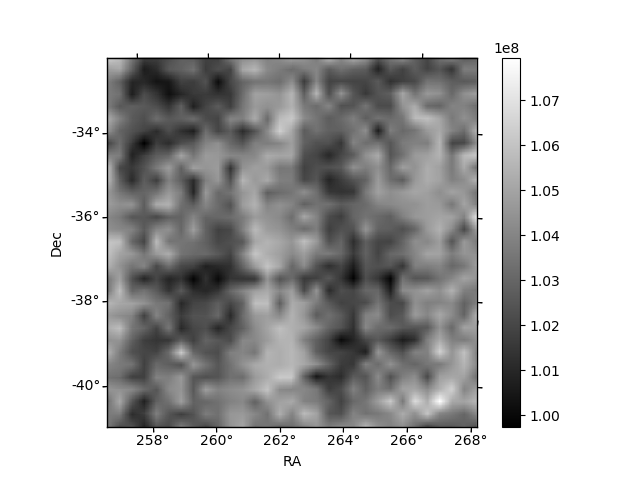
Histogram calculated using DETX and DETY for each event in the final _common_clean file
| Quadrant A | 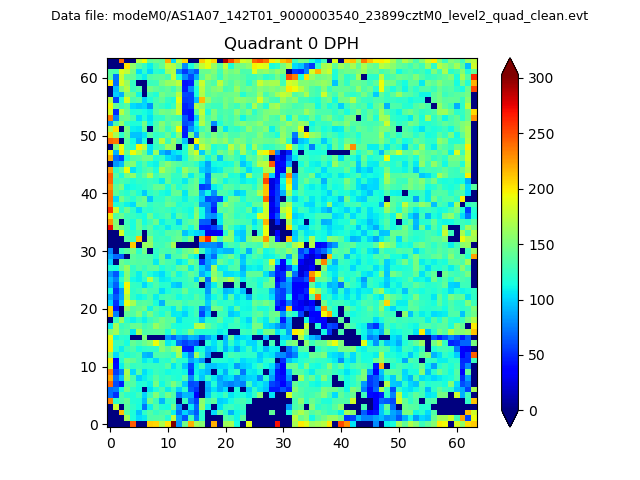 |
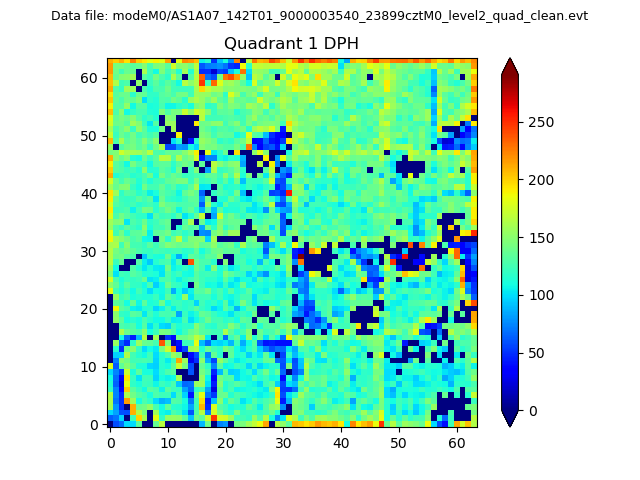 |
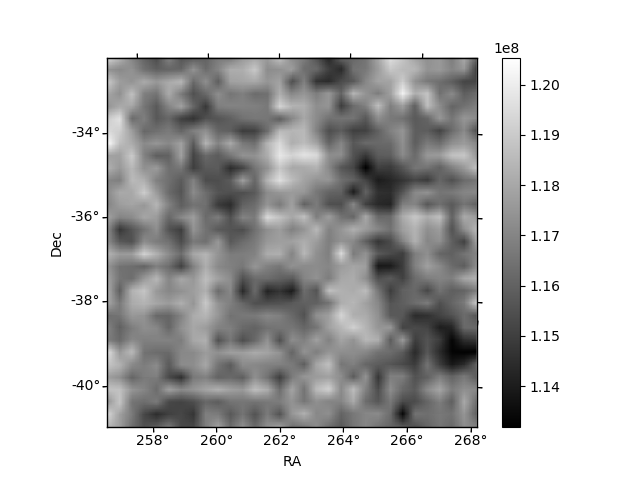
Quadrant B |
|---|---|---|---|
| Quadrant D | 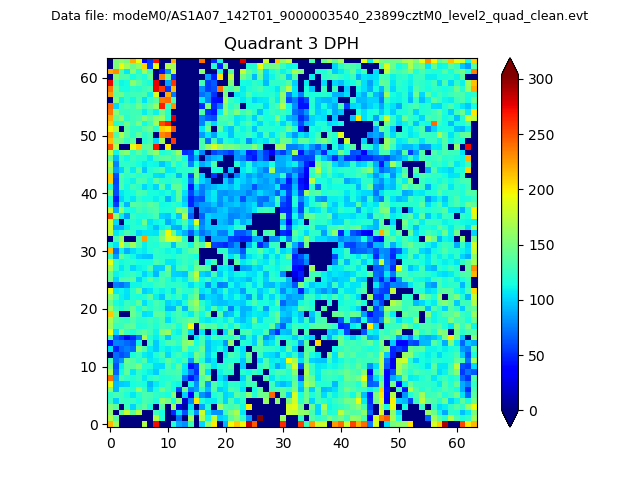 |
 |
Quadrant C |
| Plot type | Count rate plots | Images |
|---|---|---|
| Comparison with Poisson distribution Blue bars denote a histogram of data divided into 1 sec bins. Red curve is a Poisson curve with rate = median count rate of data. |
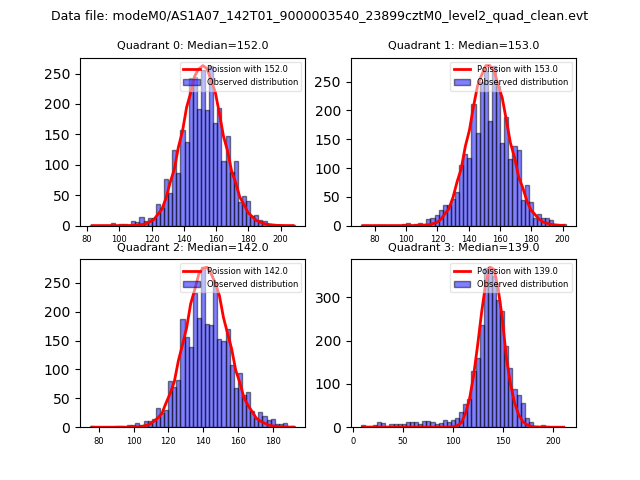 |
 |
| Quadrant-wise count rates Data is divided into 100 sec bins |
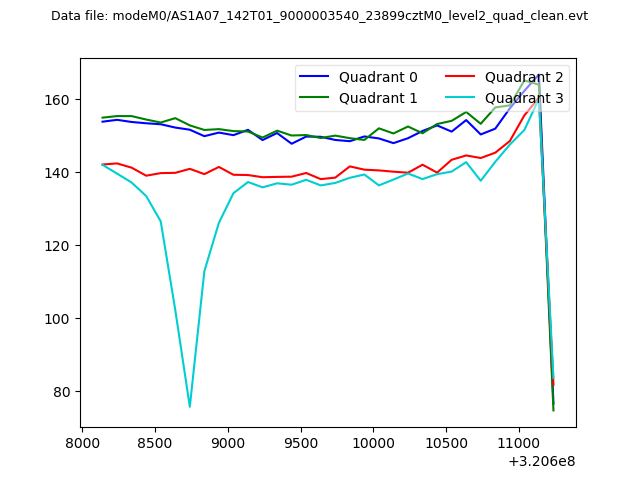 |
|
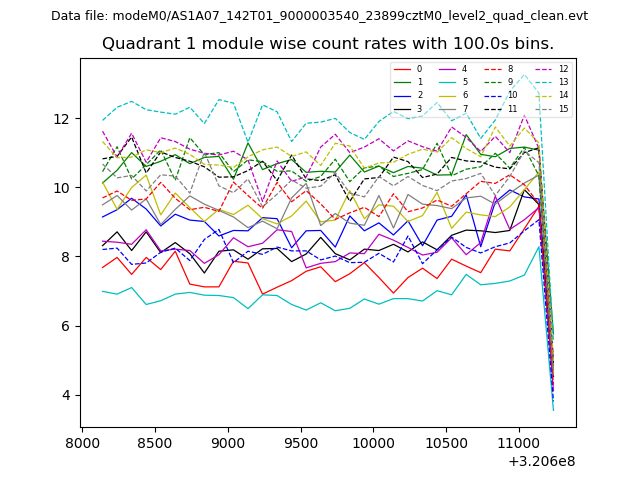
| Module-wise count rates for Quadrant A Data is divided into 100 sec bins |
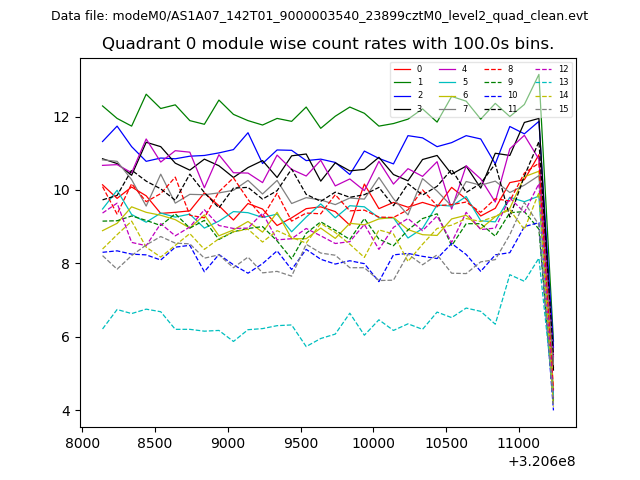 |
 |
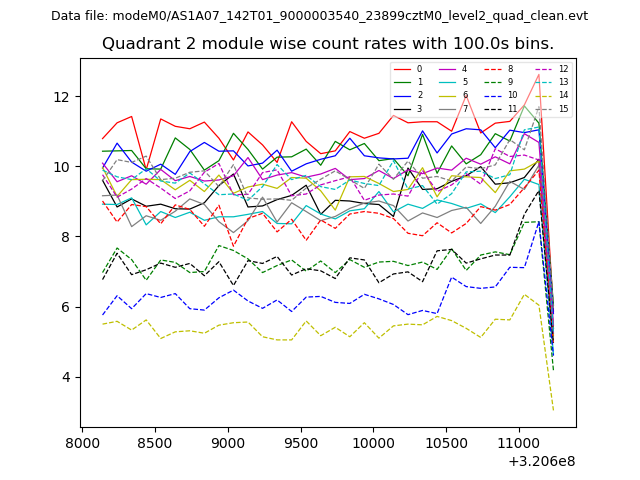
| Module-wise count rates for Quadrant B Data is divided into 100 sec bins |
 |
 |
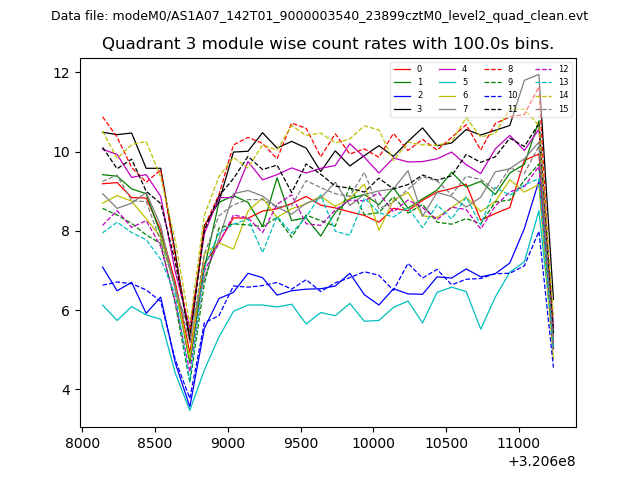
| Module-wise count rates for Quadrant C Data is divided into 100 sec bins |
 |
 |
| Module-wise count rates for Quadrant D Data is divided into 100 sec bins |
 |
 |
| Parameter | Plot |
|---|---|
| CZT HV Monitor | 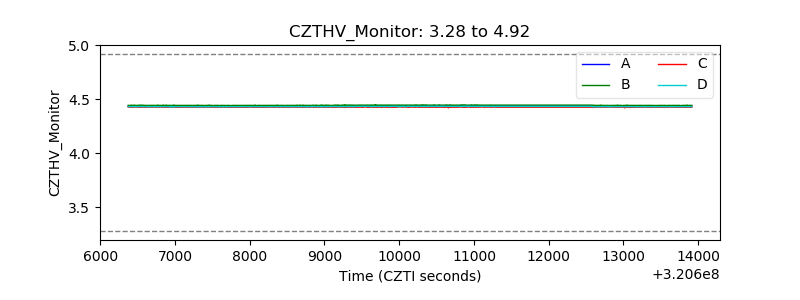 |
| D_VDD | 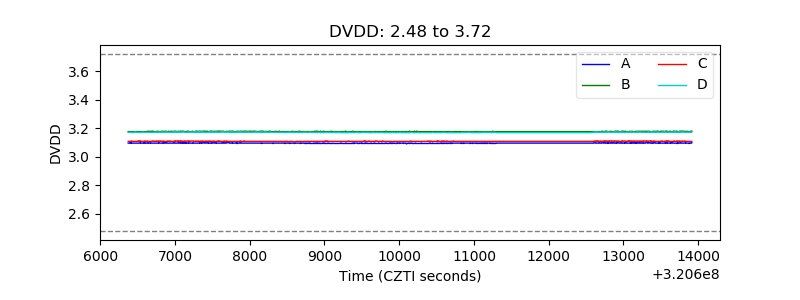 |
| Temperature 1 | 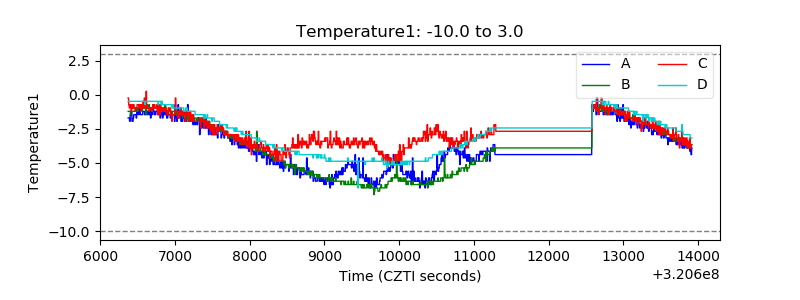 |
| Veto HV Monitor | 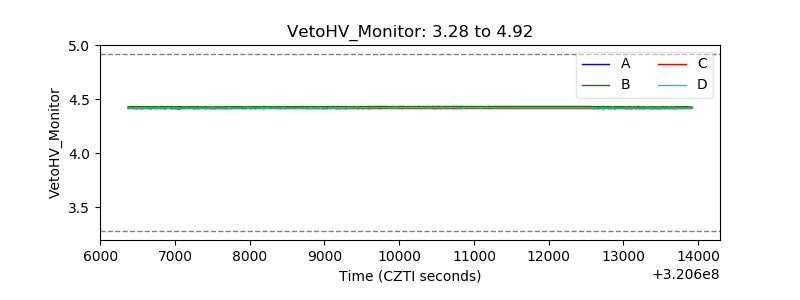 |
| Veto LLD | 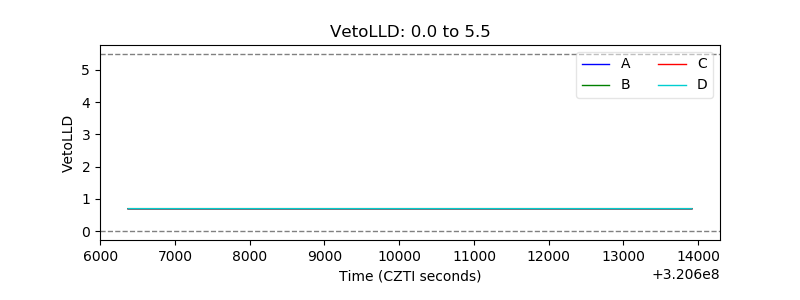 |
| Alpha Counter | 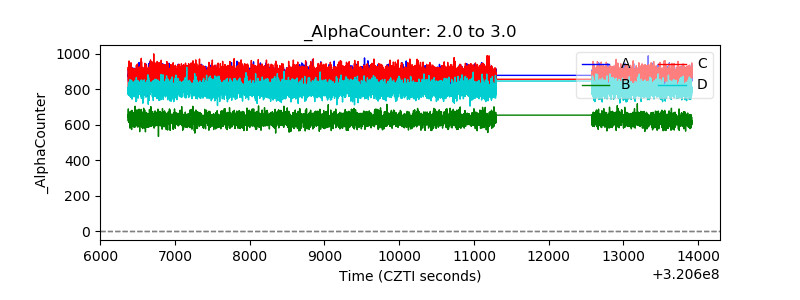 |
| _CPM_Rate | 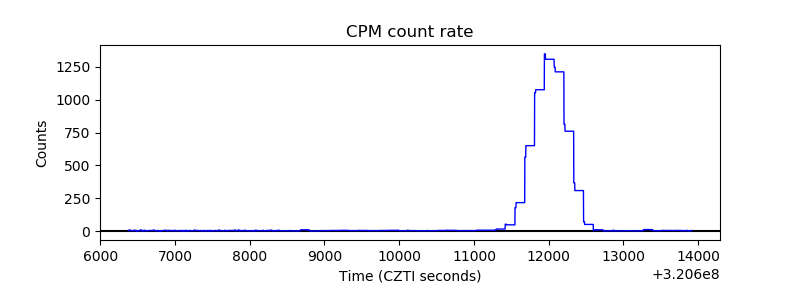 |
| CZT Counter | 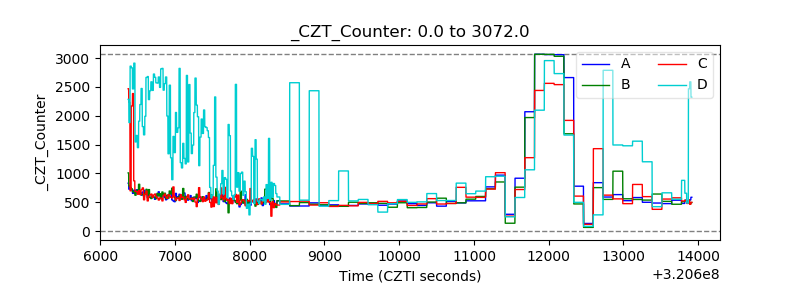 |
| +2.5 Volts monitor |  |
| +5 Volts monitor |  |
| _ROLL_ROT | 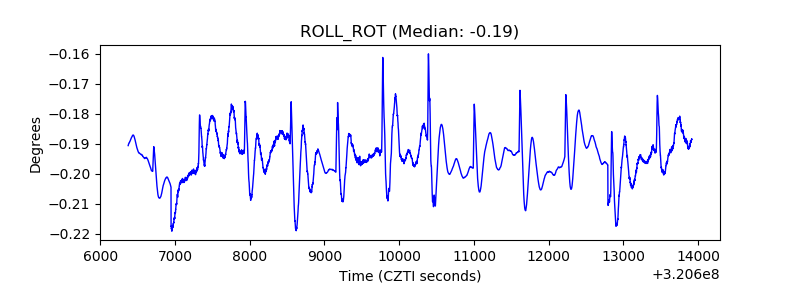 |
| _Roll_DEC | 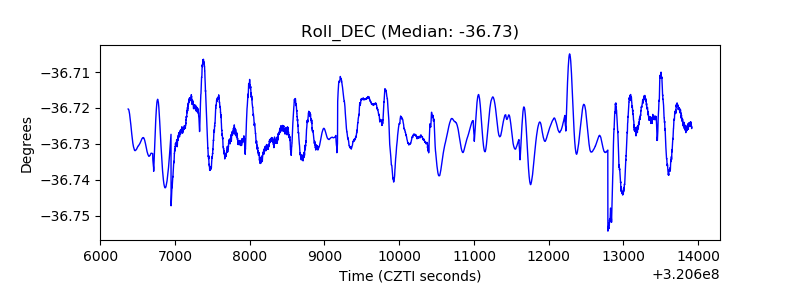 |
| _Roll_RA | 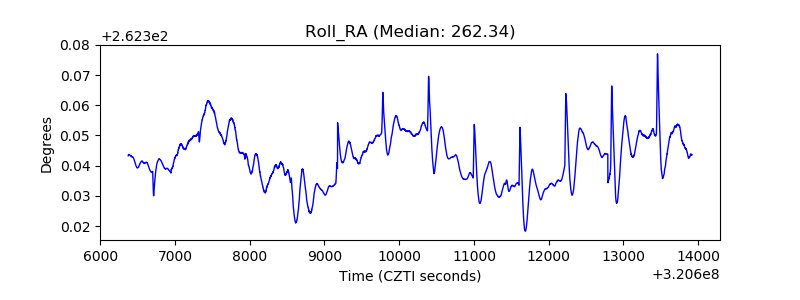 |
| Veto Counter | 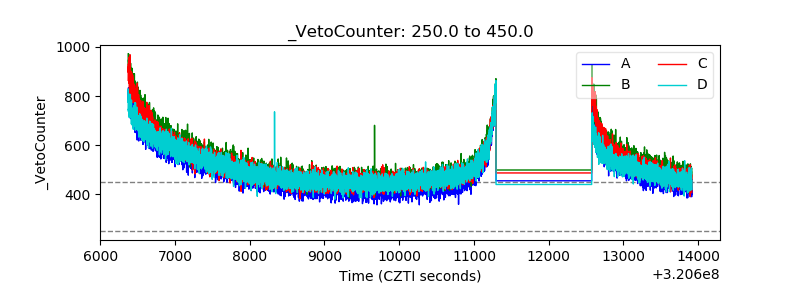 |