| Param | Original file | Final file |
|---|---|---|
| Filename | modeM0/AS1A07_142T01_9000003540_23900cztM0_level2.evt | modeM0/AS1A07_142T01_9000003540_23900cztM0_level2_quad_clean.evt |
| Size (bytes) | 540,002,880 | 87,897,600 |
| Size | 515.0 MB | 83.8 MB |
| Events in quadrant A | 3,348,169 | 574,309 |
| Events in quadrant B | 3,428,908 | 578,365 |
| Events in quadrant C | 3,445,458 | 542,673 |
| Events in quadrant D | 5,685,771 | 508,154 |
| Mode M9 | |||
|---|---|---|---|
| Quadrant | BADHDUFLAG | Total packets | Discarded packets |
| A | 0 | 21 | 0 |
| B | 0 | 22 | 0 |
| C | 0 | 22 | 0 |
| D | 0 | 22 | 0 |
| Mode M0 | |||
|---|---|---|---|
| Quadrant | BADHDUFLAG | Total packets | Discarded packets |
| A | 0 | 13875 | 2 |
| B | 0 | 14054 | 2 |
| C | 0 | 14126 | 2 |
| D | 0 | 21205 | 3 |
| Mode SS | |||
|---|---|---|---|
| Quadrant | BADHDUFLAG | Total packets | Discarded packets |
| A | 0 | 136 | 0 |
| B | 0 | 136 | 0 |
| C | 0 | 136 | 0 |
| D | 0 | 136 | 0 |
| Quadrant | Total seconds | Saturated seconds | Saturation percentage |
|---|---|---|---|
| A | 6568 | 97 | 1.476857% |
| B | 6568 | 104 | 1.583435% |
| C | 6568 | 144 | 2.192448% |
| D | 6567 | 803 | 12.227806% |
Noise dominated data is calculated using 1-second bins in cleaned event files. If a bin has >2000 counts, and if more than 50% of those come from <1% of pixels, then it is considered to be noise-dominated and hence unusable.
| Quadrant | # 1 sec bins | Bins with >0 counts | Bins with >2000 counts | High rate bins dominated by noise | Noise dominated (total time) | Noise dominated (detector-on time) | Marked lightcurve |
|---|---|---|---|---|---|---|---|
| A | 7573 | 6569 | 0 | 0 | 0.00% | 0.00% | 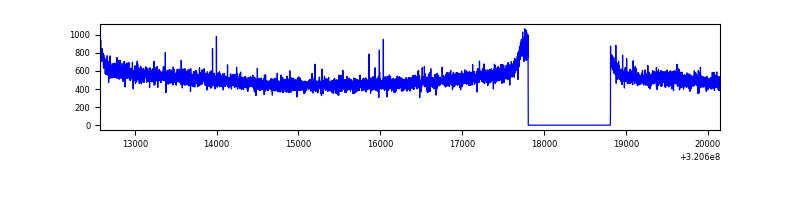 |
| B | 7573 | 6569 | 1 | 1 | 0.01% | 0.02% | 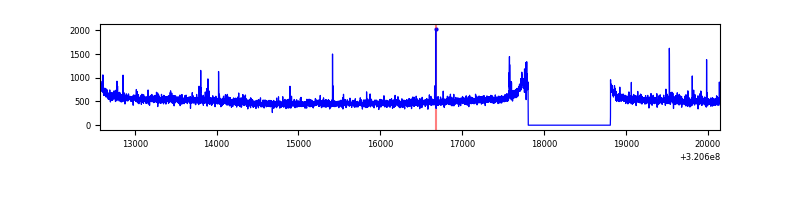 |
| C | 7573 | 6569 | 22 | 22 | 0.29% | 0.33% | 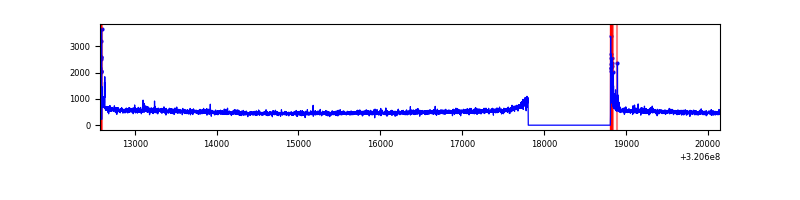 |
| D | 7572 | 6568 | 455 | 455 | 6.01% | 6.93% | 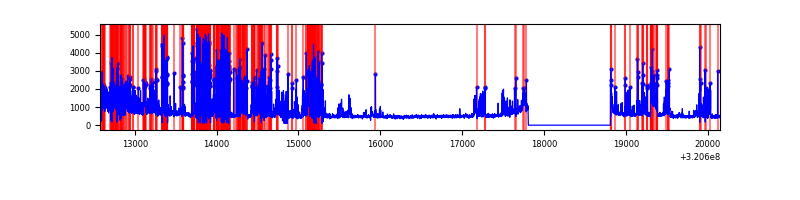 |
Top three noisy pixels from each quadrant. If the there are fewer than three noisy pixels in the level2.evt file, extra rows are filled as -1
| Pixel properties | Quadrant properties | ||||||
|---|---|---|---|---|---|---|---|
| Quadrant | DetID | PixID | Counts | Sigma | Mean | Median | Sigma |
| A | 13 | 254 | 11064 | 59.2 | 868 | 852 | 172.5 |
| A | 0 | 226 | 7510 | 38.6 | 868 | 852 | 172.5 |
| A | 3 | 137 | 7264 | 37.17 | 868 | 852 | 172.5 |
| B | 12 | 111 | 18750 | 110.25 | 863 | 845 | 162.4 |
| B | 11 | 111 | 16692 | 97.57 | 863 | 845 | 162.4 |
| B | 0 | 230 | 14481 | 83.96 | 863 | 845 | 162.4 |
| C | 14 | 238 | 130506 | 682.06 | 813 | 820 | 190.1 |
| C | 0 | 10 | 103178 | 538.33 | 813 | 820 | 190.1 |
| C | 7 | 247 | 32602 | 167.15 | 813 | 820 | 190.1 |
| D | 12 | 218 | 2106260 | 11015.73 | 780 | 758 | 191.1 |
| D | 1 | 52 | 216496 | 1128.71 | 780 | 758 | 191.1 |
| D | 8 | 195 | 130472 | 678.65 | 780 | 758 | 191.1 |
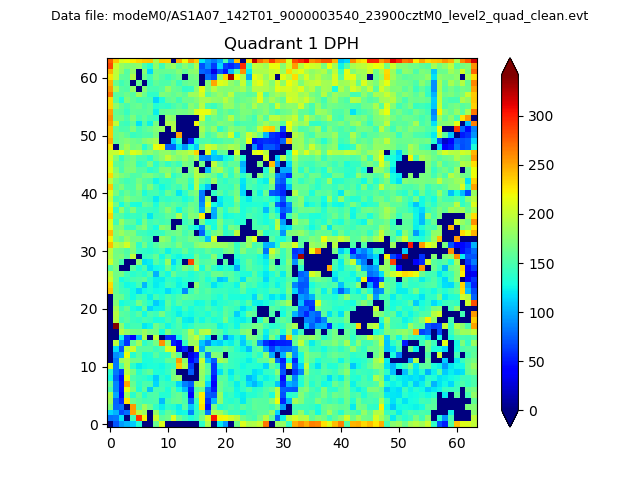
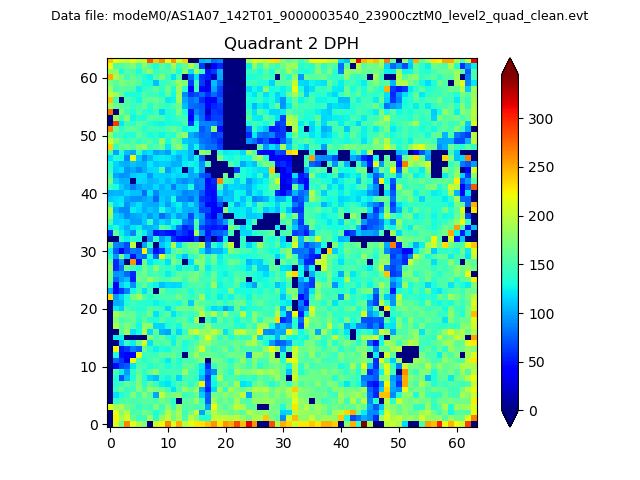
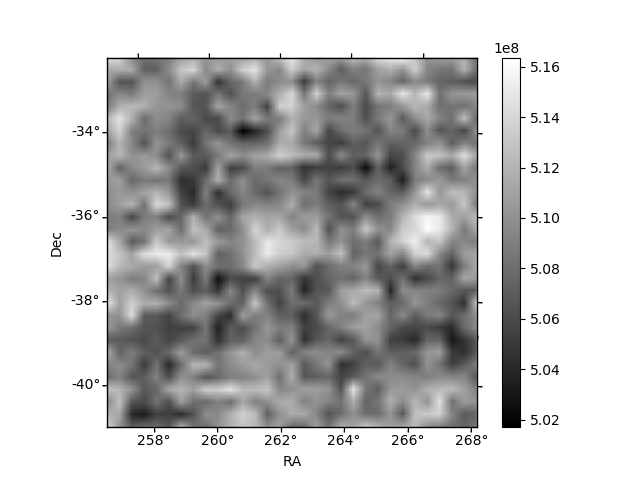
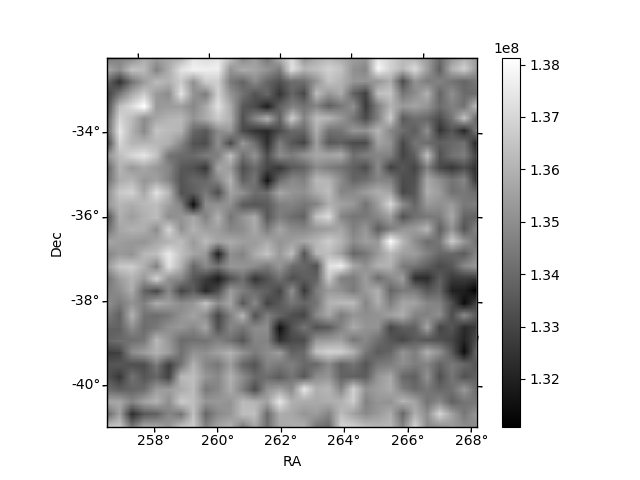
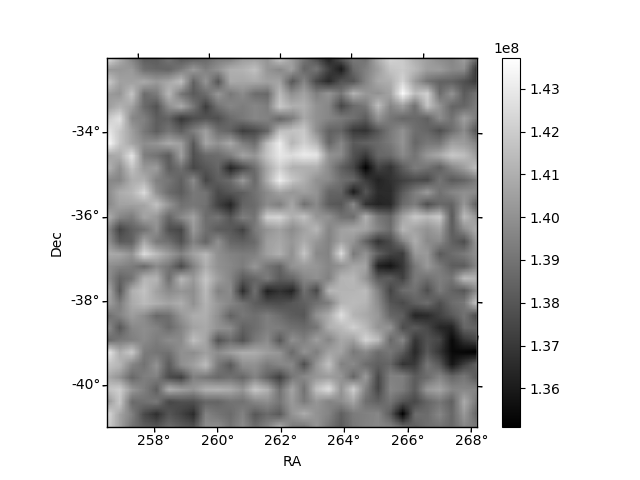
Histogram calculated using DETX and DETY for each event in the final _common_clean file
| Quadrant A |  |
 |
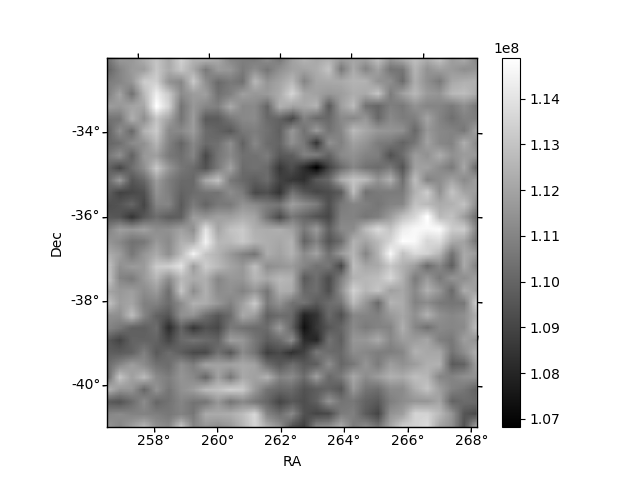
Quadrant B |
|---|---|---|---|
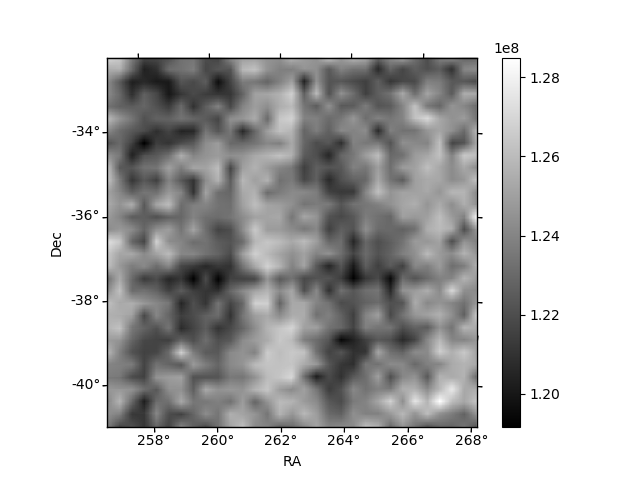
| Quadrant D | 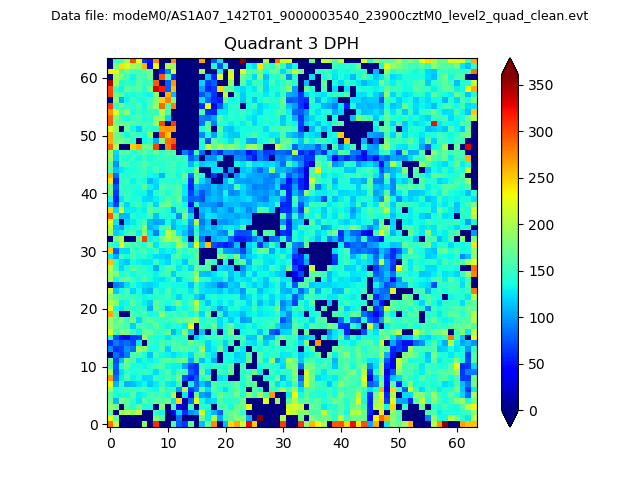 |
 |
Quadrant C |
| Plot type | Count rate plots | Images |
|---|---|---|
| Comparison with Poisson distribution Blue bars denote a histogram of data divided into 1 sec bins. Red curve is a Poisson curve with rate = median count rate of data. |
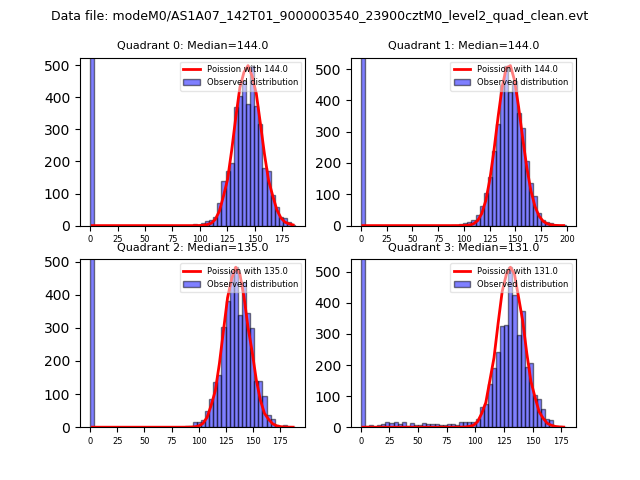 |
 |
| Quadrant-wise count rates Data is divided into 100 sec bins |
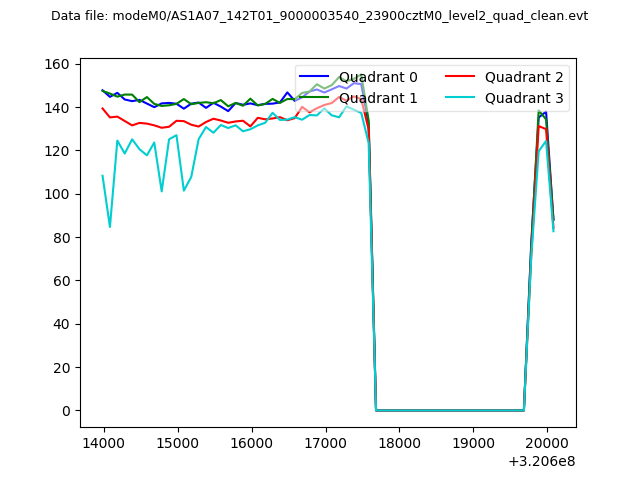 |
|
| Module-wise count rates for Quadrant A Data is divided into 100 sec bins |
 |
 |
| Module-wise count rates for Quadrant B Data is divided into 100 sec bins |
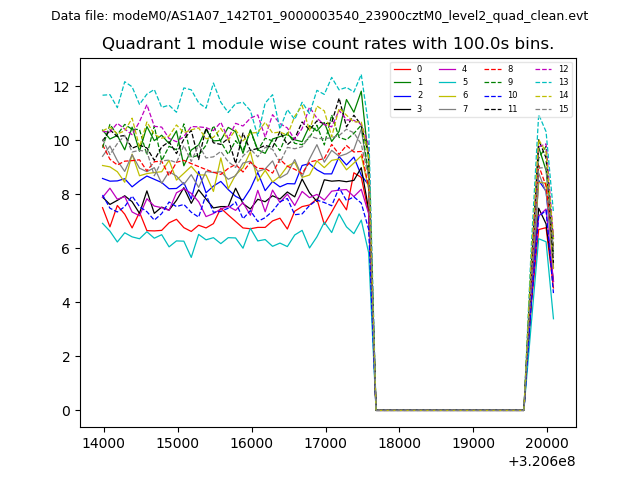 |
 |
| Module-wise count rates for Quadrant C Data is divided into 100 sec bins |
 |
 |
| Module-wise count rates for Quadrant D Data is divided into 100 sec bins |
 |
 |
| Parameter | Plot |
|---|---|
| CZT HV Monitor | 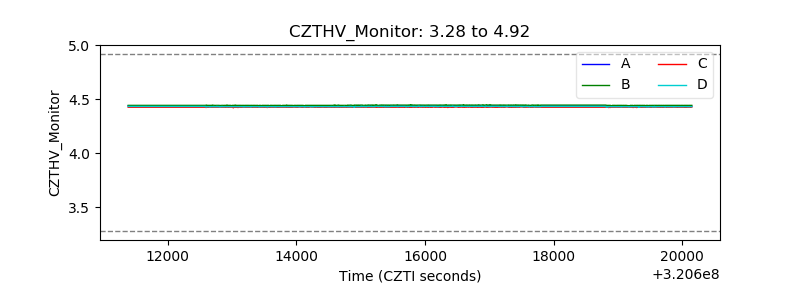 |
| D_VDD | 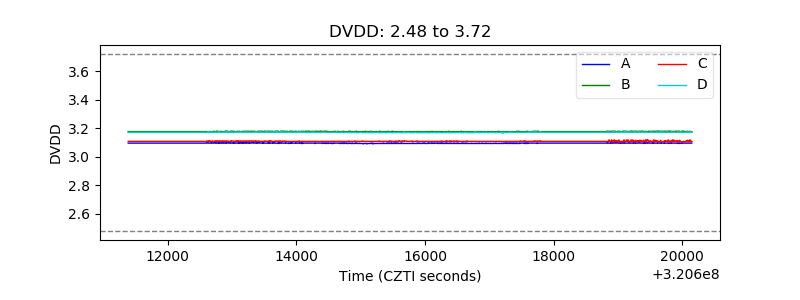 |
| Temperature 1 | 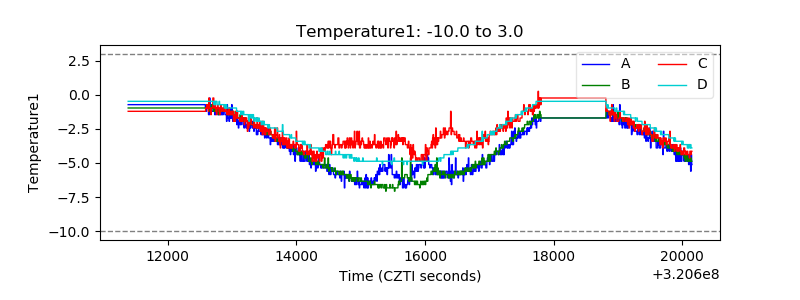 |
| Veto HV Monitor |  |
| Veto LLD | 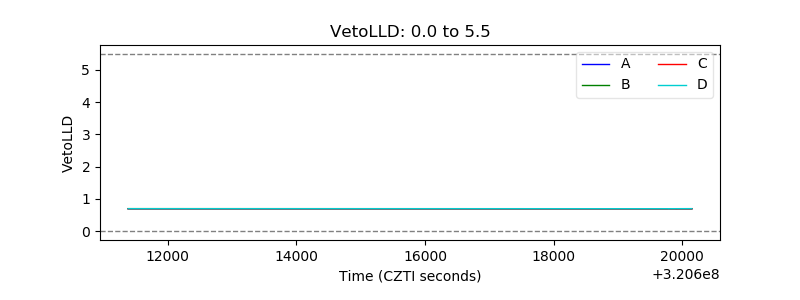 |
| Alpha Counter | 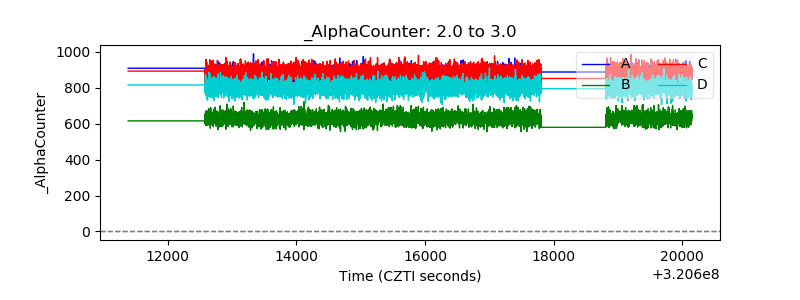 |
| _CPM_Rate | 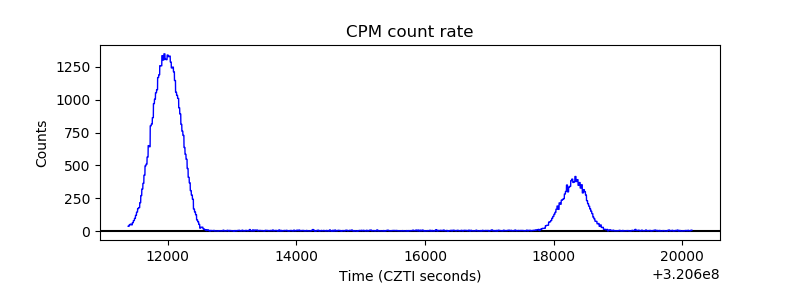 |
| CZT Counter | 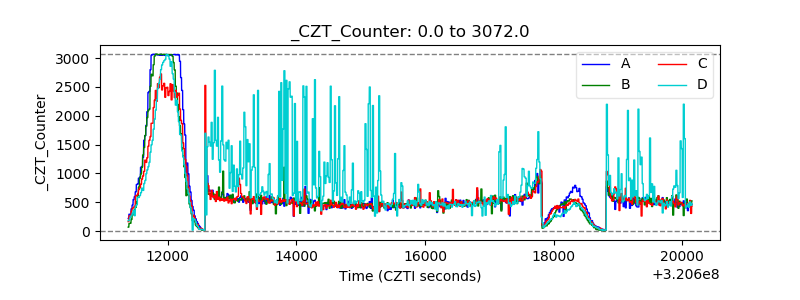 |
| +2.5 Volts monitor | 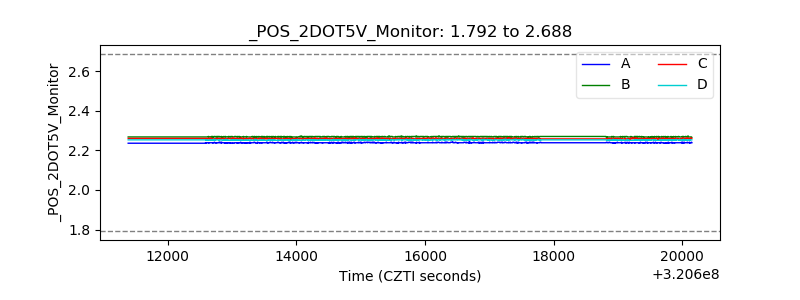 |
| +5 Volts monitor |  |
| _ROLL_ROT | 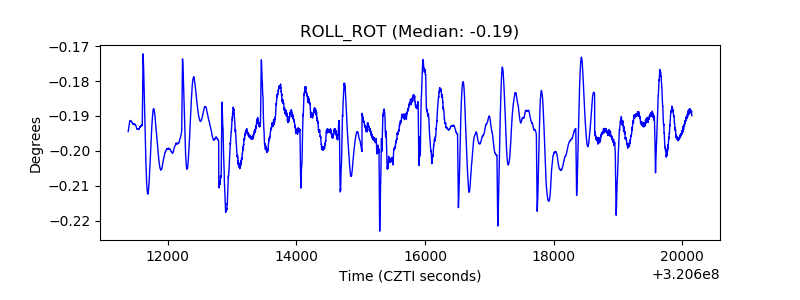 |
| _Roll_DEC |  |
| _Roll_RA | 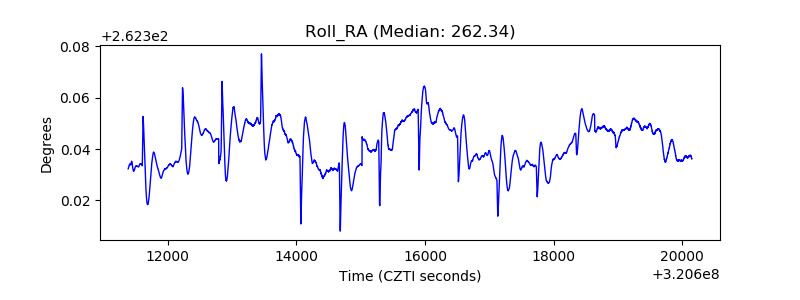 |
| Veto Counter | 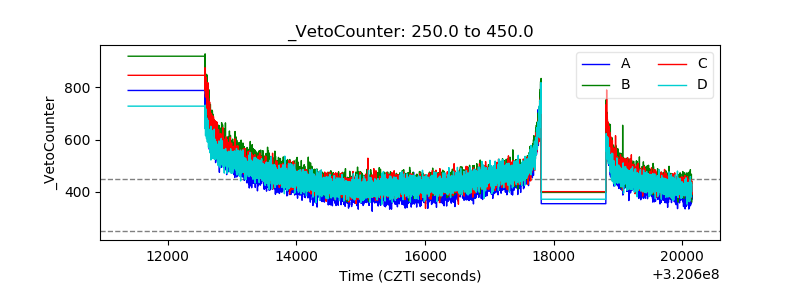 |