| Param | Original file | Final file |
|---|---|---|
| Filename | modeM0/AS1A07_142T01_9000003540_23901cztM0_level2.evt | modeM0/AS1A07_142T01_9000003540_23901cztM0_level2_quad_clean.evt |
| Size (bytes) | 529,332,480 | 94,029,120 |
| Size | 504.8 MB | 89.7 MB |
| Events in quadrant A | 3,499,110 | 603,827 |
| Events in quadrant B | 3,753,064 | 607,903 |
| Events in quadrant C | 3,622,733 | 573,730 |
| Events in quadrant D | 4,670,353 | 564,005 |
| Mode M9 | |||
|---|---|---|---|
| Quadrant | BADHDUFLAG | Total packets | Discarded packets |
| A | 0 | 16 | 0 |
| B | 0 | 16 | 0 |
| C | 0 | 16 | 0 |
| D | 0 | 16 | 0 |
| Mode M0 | |||
|---|---|---|---|
| Quadrant | BADHDUFLAG | Total packets | Discarded packets |
| A | 0 | 14834 | 2 |
| B | 0 | 15543 | 2 |
| C | 0 | 15081 | 2 |
| D | 0 | 18610 | 2 |
| Mode SS | |||
|---|---|---|---|
| Quadrant | BADHDUFLAG | Total packets | Discarded packets |
| A | 0 | 148 | 0 |
| B | 0 | 148 | 0 |
| C | 0 | 148 | 0 |
| D | 0 | 148 | 0 |
| Quadrant | Total seconds | Saturated seconds | Saturation percentage |
|---|---|---|---|
| A | 7150 | 107 | 1.496503% |
| B | 7151 | 171 | 2.391274% |
| C | 7151 | 161 | 2.251433% |
| D | 7151 | 353 | 4.936373% |
Noise dominated data is calculated using 1-second bins in cleaned event files. If a bin has >2000 counts, and if more than 50% of those come from <1% of pixels, then it is considered to be noise-dominated and hence unusable.
| Quadrant | # 1 sec bins | Bins with >0 counts | Bins with >2000 counts | High rate bins dominated by noise | Noise dominated (total time) | Noise dominated (detector-on time) | Marked lightcurve |
|---|---|---|---|---|---|---|---|
| A | 8770 | 7152 | 0 | 0 | 0.00% | 0.00% | 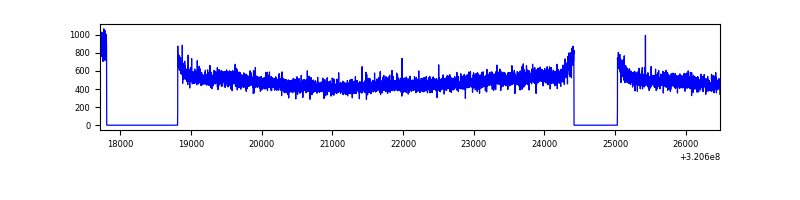 |
| B | 8771 | 7153 | 29 | 29 | 0.33% | 0.41% | 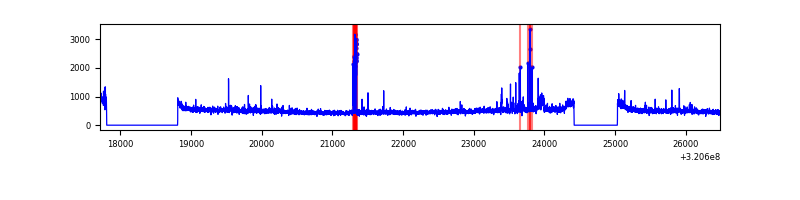 |
| C | 8771 | 7153 | 16 | 16 | 0.18% | 0.22% | 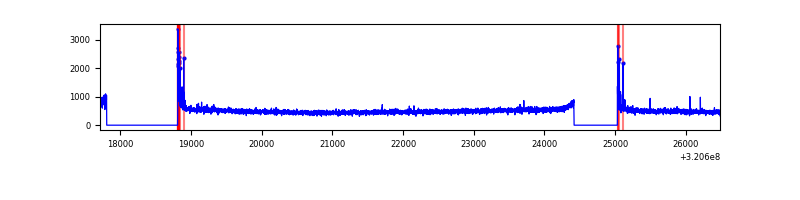 |
| D | 8771 | 7153 | 170 | 170 | 1.94% | 2.38% | 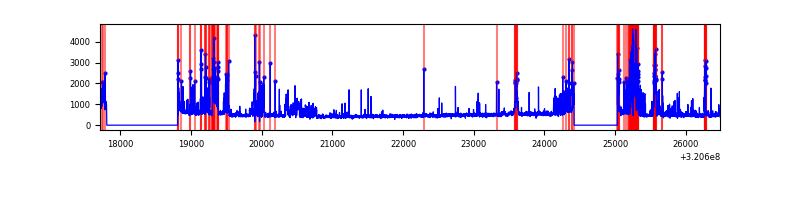 |
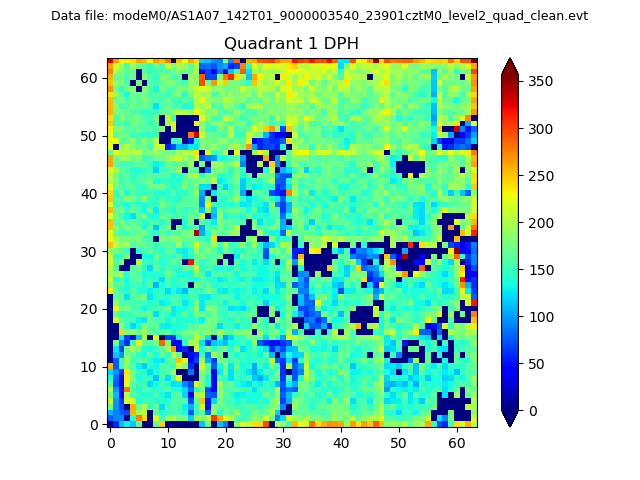
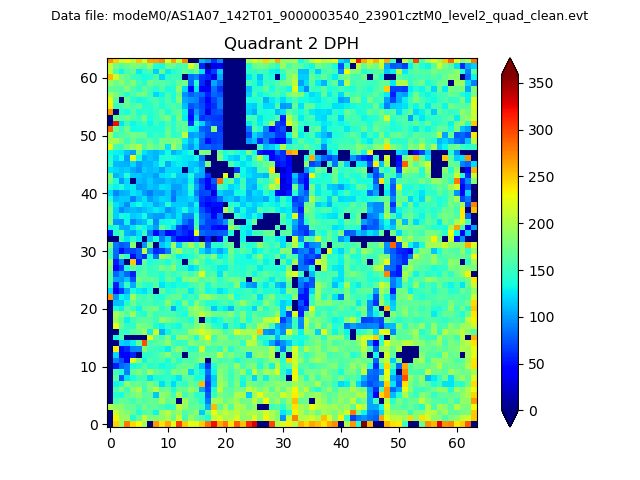
Top three noisy pixels from each quadrant. If the there are fewer than three noisy pixels in the level2.evt file, extra rows are filled as -1
| Pixel properties | Quadrant properties | ||||||
|---|---|---|---|---|---|---|---|
| Quadrant | DetID | PixID | Counts | Sigma | Mean | Median | Sigma |
| A | 13 | 254 | 12019 | 61.23 | 907 | 887 | 181.8 |
| A | 3 | 137 | 7919 | 38.68 | 907 | 887 | 181.8 |
| A | 0 | 226 | 7781 | 37.92 | 907 | 887 | 181.8 |
| B | 0 | 245 | 100589 | 583.93 | 903 | 881 | 170.8 |
| B | 0 | 189 | 38238 | 218.78 | 903 | 881 | 170.8 |
| B | 15 | 33 | 23610 | 133.11 | 903 | 881 | 170.8 |
| C | 14 | 238 | 137249 | 679.8 | 859 | 864 | 200.6 |
| C | 0 | 10 | 83404 | 411.41 | 859 | 864 | 200.6 |
| C | 10 | 9 | 18032 | 85.57 | 859 | 864 | 200.6 |
| D | 12 | 218 | 1045586 | 4974.86 | 860 | 832 | 210.0 |
| D | 7 | 238 | 102966 | 486.34 | 860 | 832 | 210.0 |
| D | 12 | 233 | 87972 | 414.94 | 860 | 832 | 210.0 |
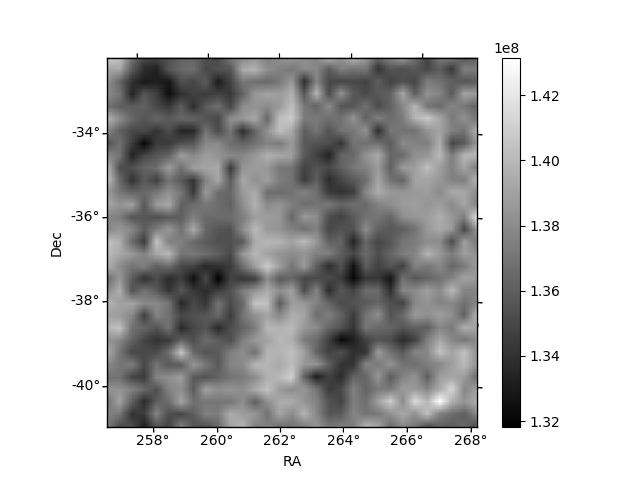
Histogram calculated using DETX and DETY for each event in the final _common_clean file
| Quadrant A | 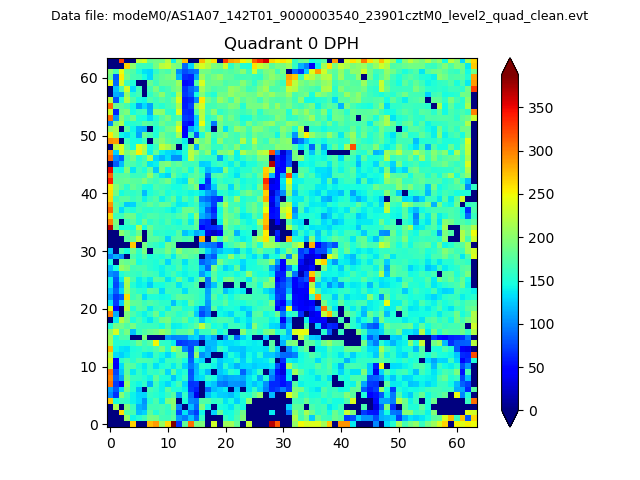 |
 |
Quadrant B |
|---|---|---|---|
| Quadrant D | 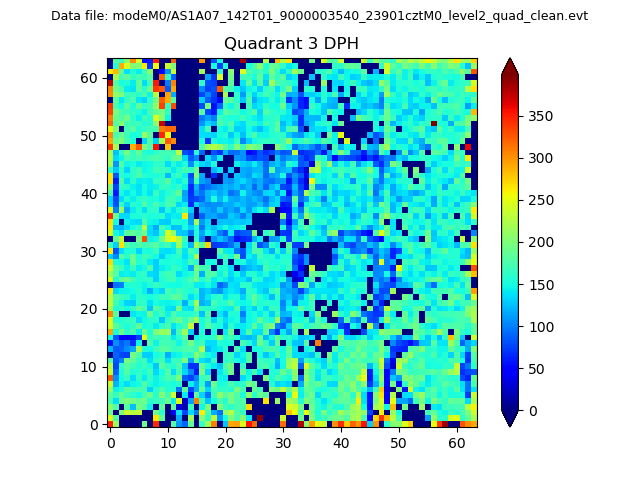 |
 |
Quadrant C |
| Plot type | Count rate plots | Images |
|---|---|---|
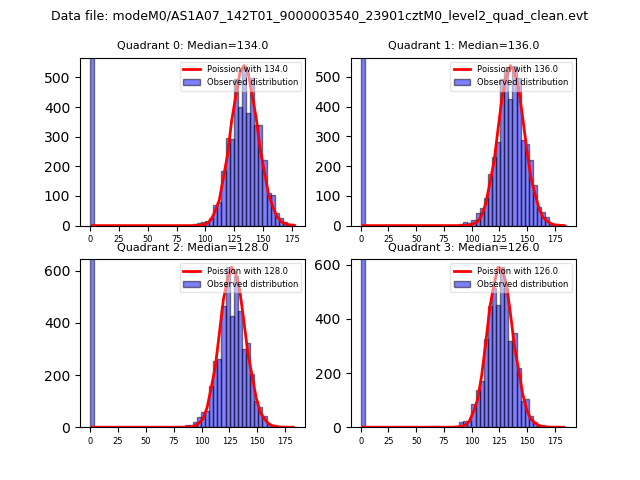
| Comparison with Poisson distribution Blue bars denote a histogram of data divided into 1 sec bins. Red curve is a Poisson curve with rate = median count rate of data. |
 |
 |
| Quadrant-wise count rates Data is divided into 100 sec bins |
 |
|
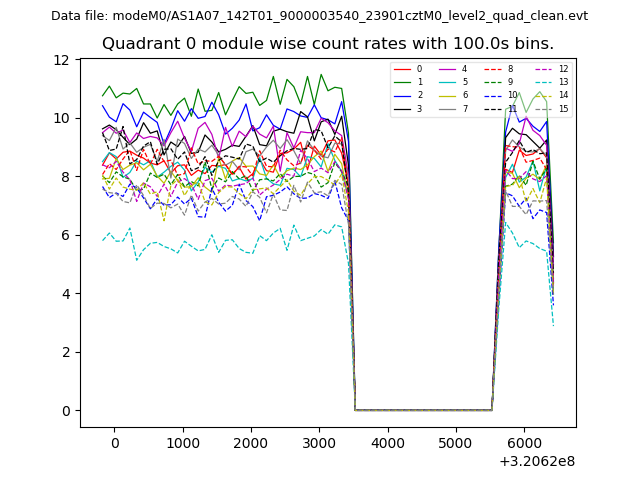
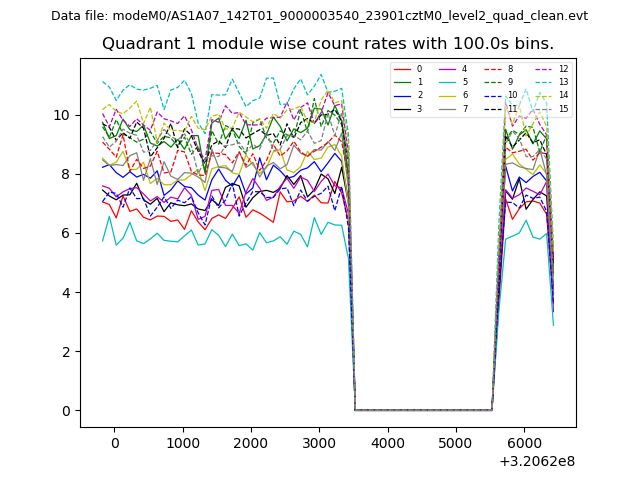
| Module-wise count rates for Quadrant A Data is divided into 100 sec bins |
 |
 |
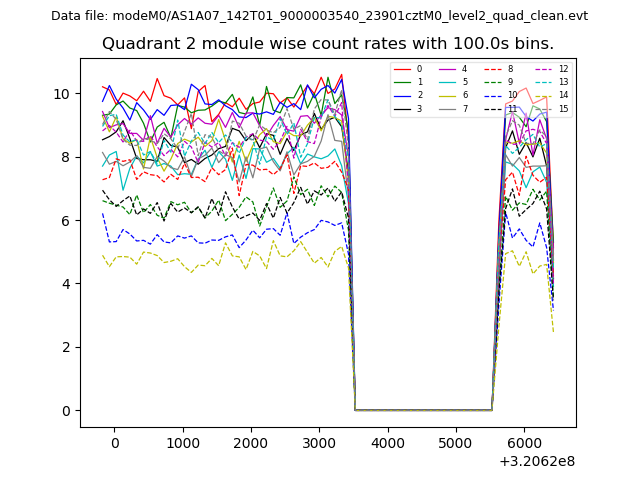
| Module-wise count rates for Quadrant B Data is divided into 100 sec bins |
 |
 |
| Module-wise count rates for Quadrant C Data is divided into 100 sec bins |
 |
 |
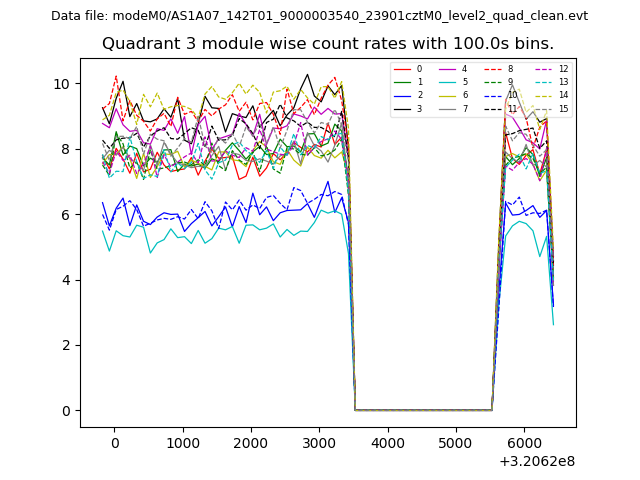
| Module-wise count rates for Quadrant D Data is divided into 100 sec bins |
 |
 |
| Parameter | Plot |
|---|---|
| CZT HV Monitor | 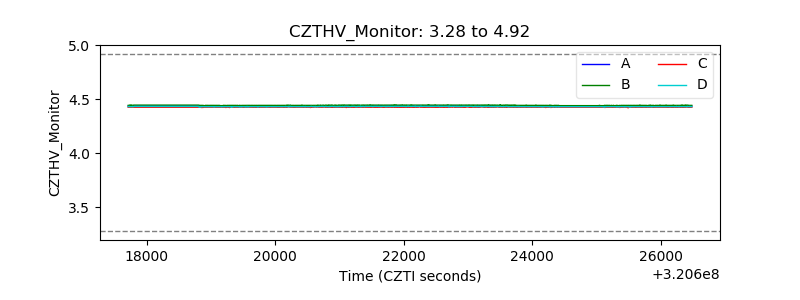 |
| D_VDD | 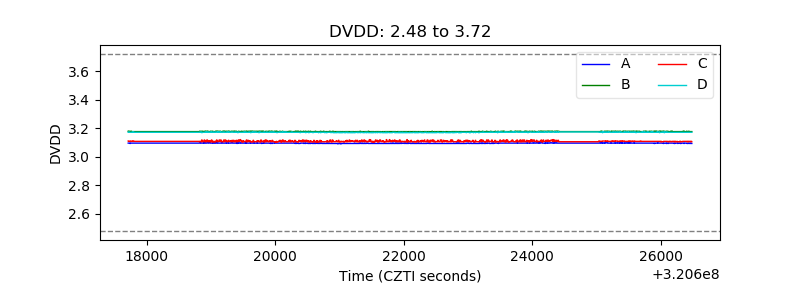 |
| Temperature 1 | 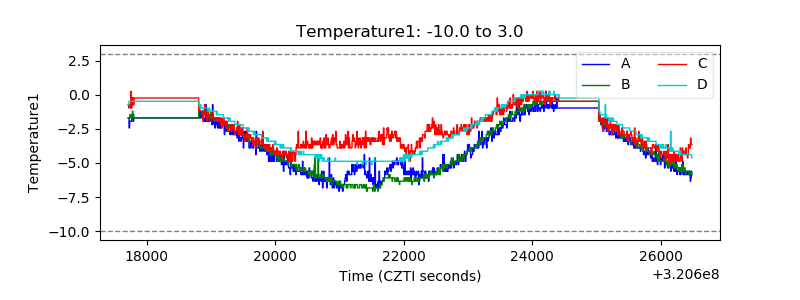 |
| Veto HV Monitor |  |
| Veto LLD | 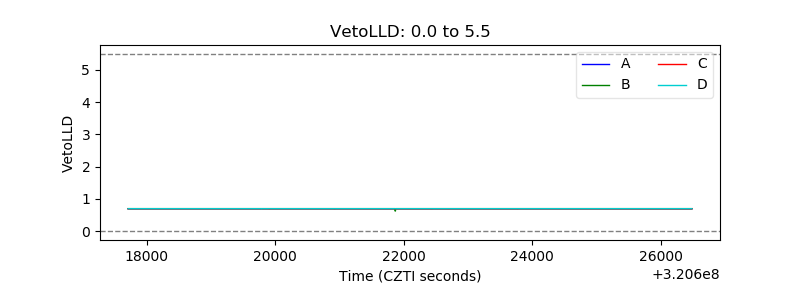 |
| Alpha Counter | 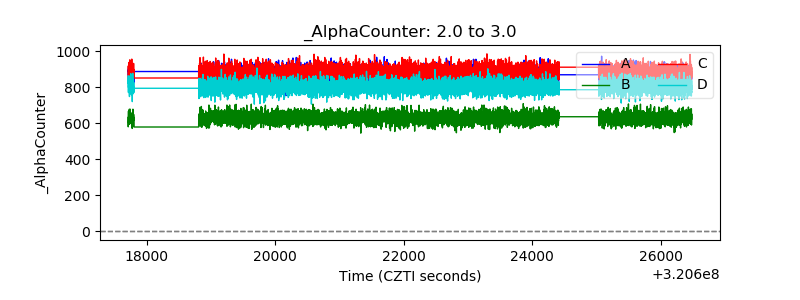 |
| _CPM_Rate | 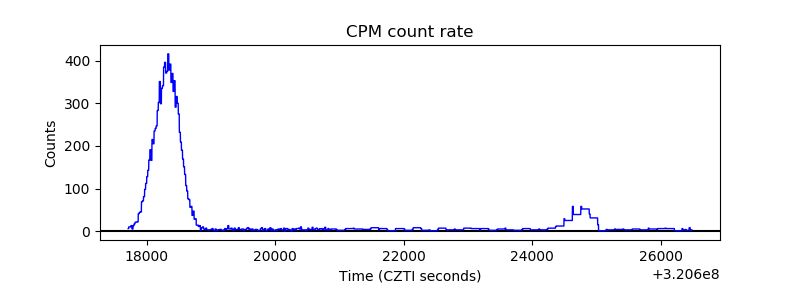 |
| CZT Counter | 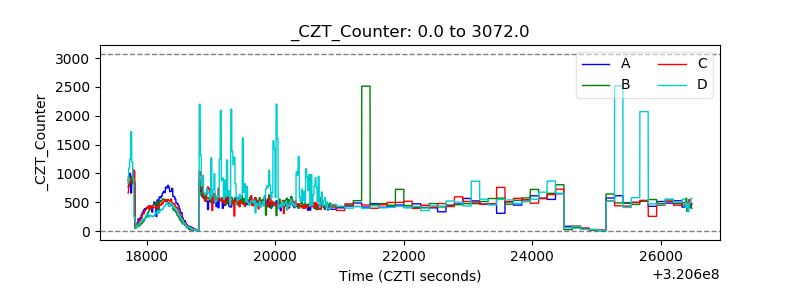 |
| +2.5 Volts monitor |  |
| +5 Volts monitor |  |
| _ROLL_ROT | 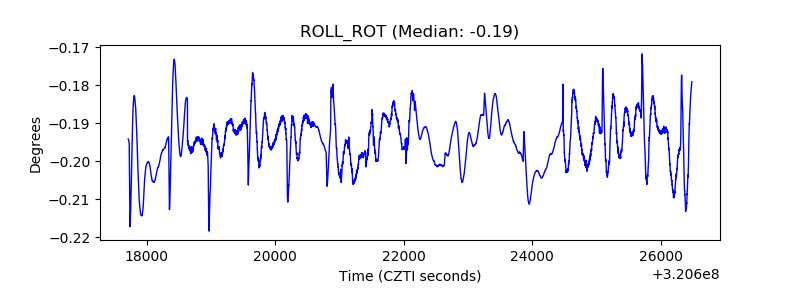 |
| _Roll_DEC | 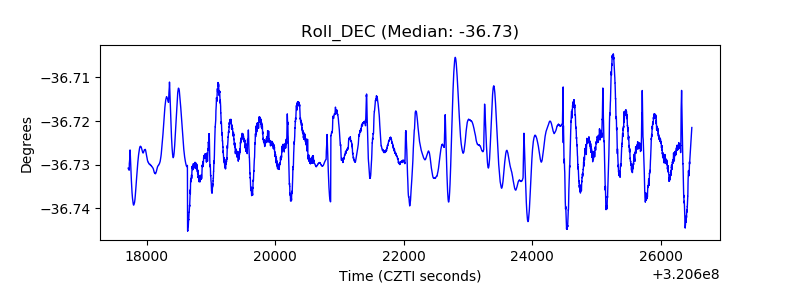 |
| _Roll_RA | 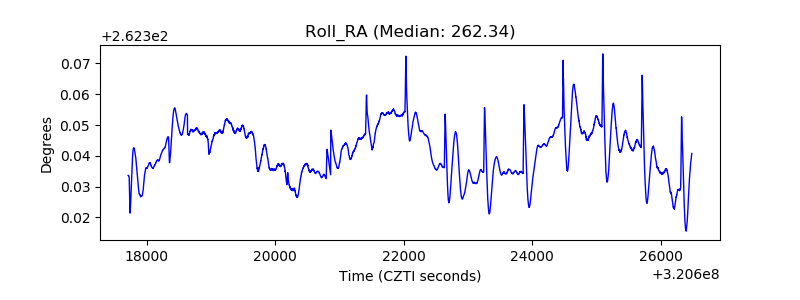 |
| Veto Counter | 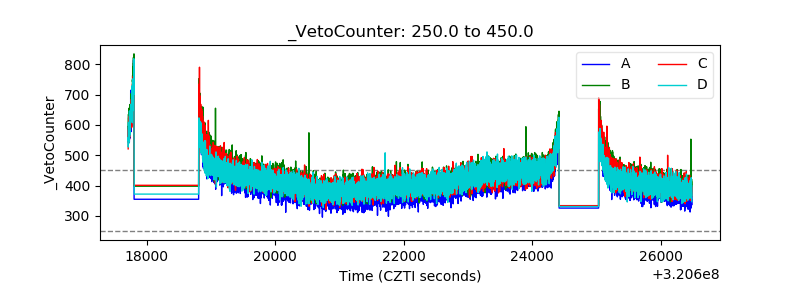 |