| Param | Original file | Final file |
|---|---|---|
| Filename | modeM0/AS1A07_142T01_9000003540_23902cztM0_level2.evt | modeM0/AS1A07_142T01_9000003540_23902cztM0_level2_quad_clean.evt |
| Size (bytes) | 529,905,600 | 99,480,960 |
| Size | 505.4 MB | 94.9 MB |
| Events in quadrant A | 3,596,736 | 638,913 |
| Events in quadrant B | 3,753,592 | 643,308 |
| Events in quadrant C | 3,711,700 | 611,774 |
| Events in quadrant D | 4,479,306 | 599,079 |
| Mode M9 | |||
|---|---|---|---|
| Quadrant | BADHDUFLAG | Total packets | Discarded packets |
| A | 0 | 7 | 0 |
| B | 0 | 8 | 0 |
| C | 0 | 8 | 0 |
| D | 0 | 8 | 0 |
| Mode M0 | |||
|---|---|---|---|
| Quadrant | BADHDUFLAG | Total packets | Discarded packets |
| A | 0 | 15475 | 2 |
| B | 0 | 15779 | 2 |
| C | 0 | 15637 | 2 |
| D | 0 | 18041 | 2 |
| Mode SS | |||
|---|---|---|---|
| Quadrant | BADHDUFLAG | Total packets | Discarded packets |
| A | 0 | 150 | 0 |
| B | 0 | 150 | 0 |
| C | 0 | 150 | 0 |
| D | 0 | 150 | 0 |
| Quadrant | Total seconds | Saturated seconds | Saturation percentage |
|---|---|---|---|
| A | 7473 | 50 | 0.669075% |
| B | 7473 | 101 | 1.351532% |
| C | 7473 | 150 | 2.007226% |
| D | 7472 | 228 | 3.051392% |
Noise dominated data is calculated using 1-second bins in cleaned event files. If a bin has >2000 counts, and if more than 50% of those come from <1% of pixels, then it is considered to be noise-dominated and hence unusable.
| Quadrant | # 1 sec bins | Bins with >0 counts | Bins with >2000 counts | High rate bins dominated by noise | Noise dominated (total time) | Noise dominated (detector-on time) | Marked lightcurve |
|---|---|---|---|---|---|---|---|
| A | 7698 | 7474 | 0 | 0 | 0.00% | 0.00% | 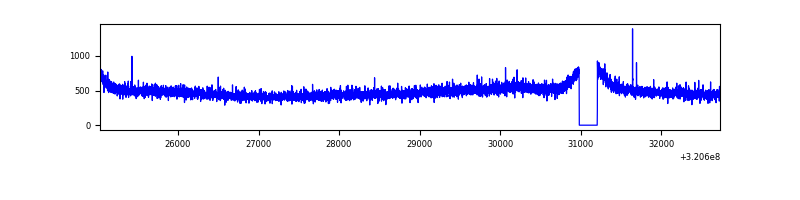 |
| B | 7698 | 7474 | 4 | 4 | 0.05% | 0.05% | 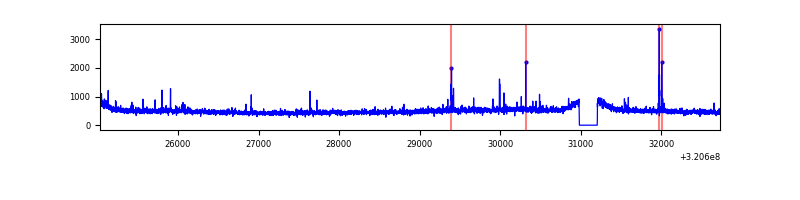 |
| C | 7698 | 7474 | 5 | 5 | 0.06% | 0.07% | 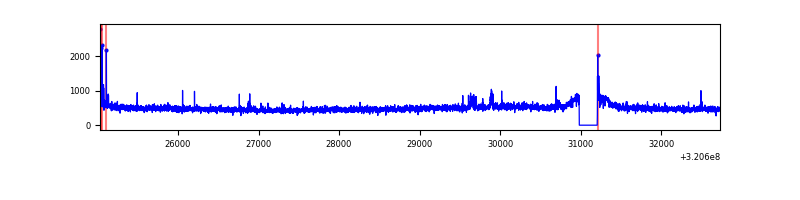 |
| D | 7697 | 7473 | 127 | 127 | 1.65% | 1.70% | 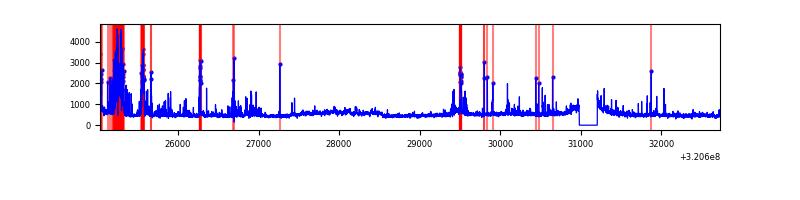 |
Top three noisy pixels from each quadrant. If the there are fewer than three noisy pixels in the level2.evt file, extra rows are filled as -1
| Pixel properties | Quadrant properties | ||||||
|---|---|---|---|---|---|---|---|
| Quadrant | DetID | PixID | Counts | Sigma | Mean | Median | Sigma |
| A | 13 | 254 | 12680 | 62.1 | 932 | 912 | 189.5 |
| A | 3 | 137 | 8168 | 38.29 | 932 | 912 | 189.5 |
| A | 0 | 226 | 8081 | 37.83 | 932 | 912 | 189.5 |
| B | 0 | 189 | 28073 | 152.75 | 934 | 912 | 177.8 |
| B | 12 | 111 | 21033 | 113.16 | 934 | 912 | 177.8 |
| B | 0 | 228 | 19027 | 101.88 | 934 | 912 | 177.8 |
| C | 14 | 238 | 139424 | 660.15 | 892 | 899 | 209.8 |
| C | 0 | 10 | 41177 | 191.95 | 892 | 899 | 209.8 |
| C | 10 | 9 | 40731 | 189.82 | 892 | 899 | 209.8 |
| D | 12 | 218 | 601809 | 2751.96 | 894 | 866 | 218.4 |
| D | 7 | 238 | 321932 | 1470.29 | 894 | 866 | 218.4 |
| D | 8 | 195 | 39081 | 175.0 | 894 | 866 | 218.4 |
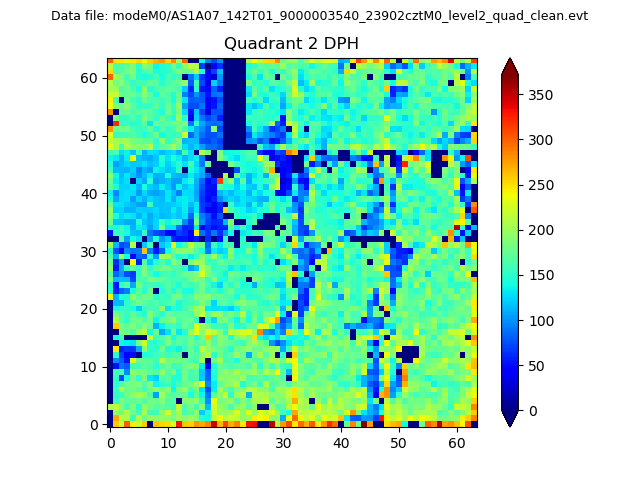
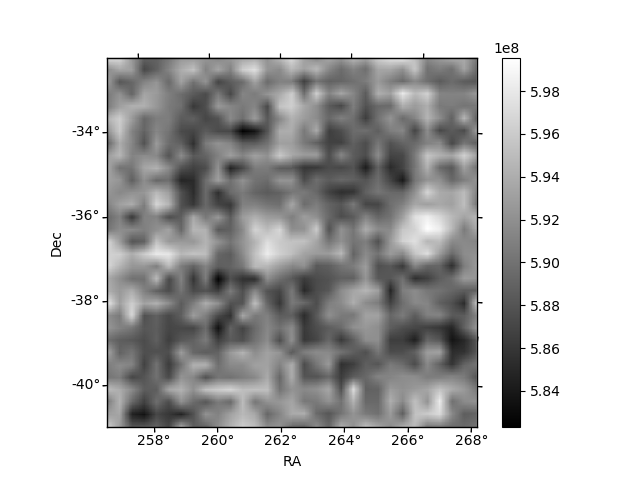
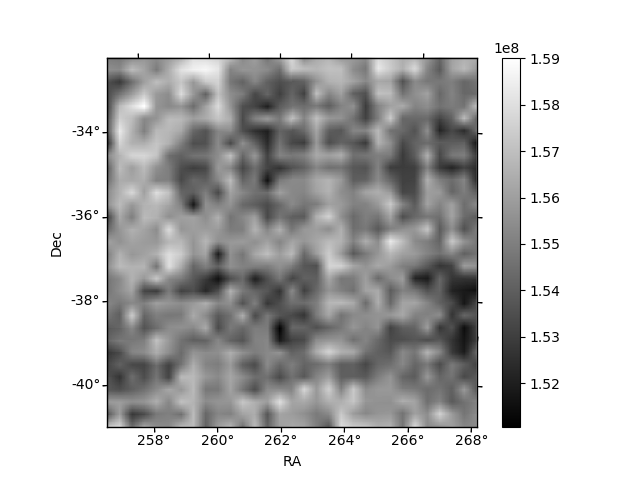
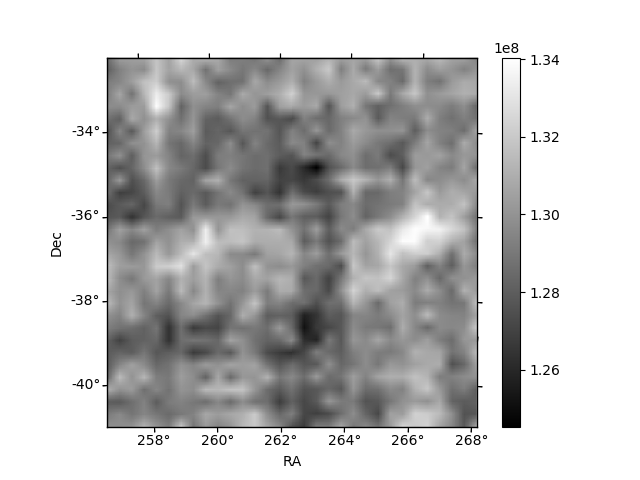
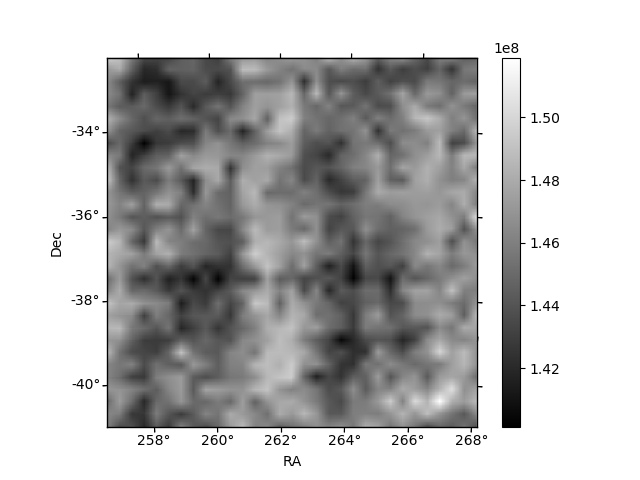
Histogram calculated using DETX and DETY for each event in the final _common_clean file
| Quadrant A | 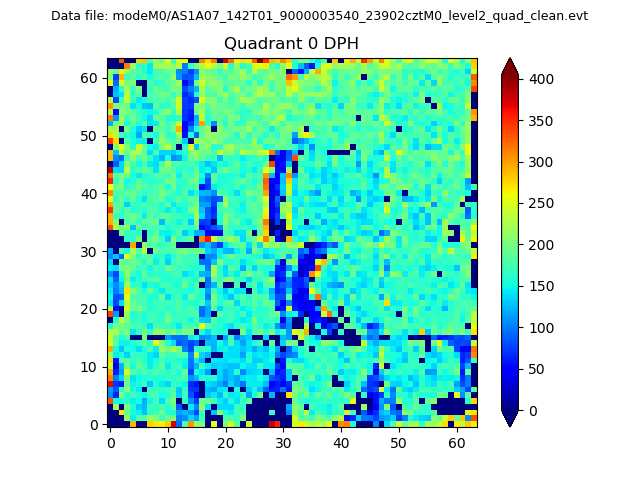 |
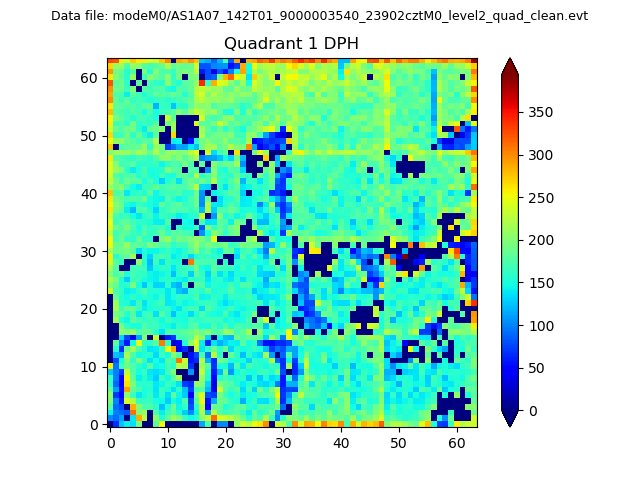 |
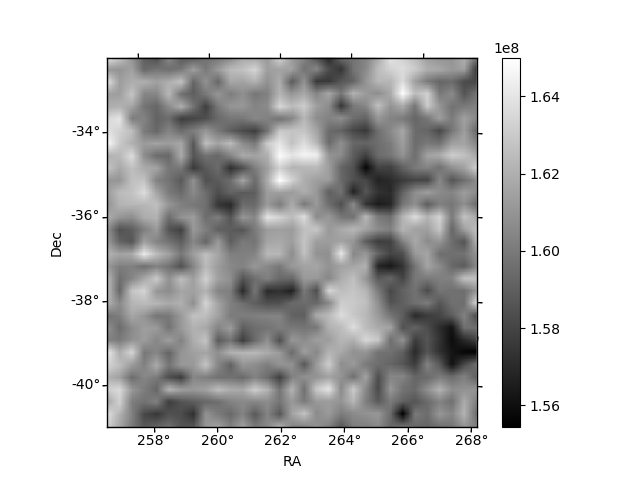
Quadrant B |
|---|---|---|---|
| Quadrant D | 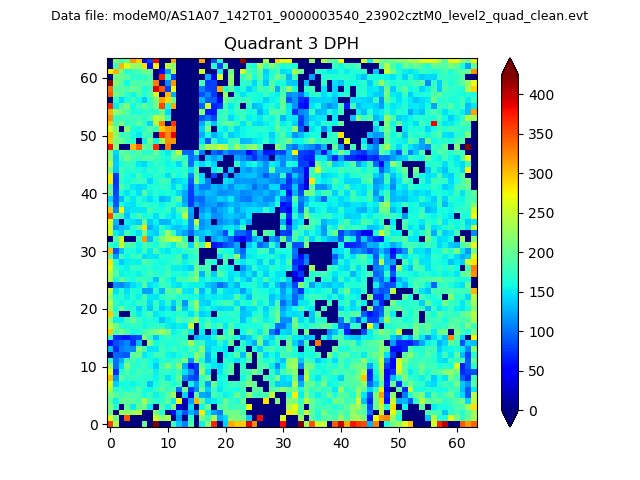 |
 |
Quadrant C |
| Plot type | Count rate plots | Images |
|---|---|---|
| Comparison with Poisson distribution Blue bars denote a histogram of data divided into 1 sec bins. Red curve is a Poisson curve with rate = median count rate of data. |
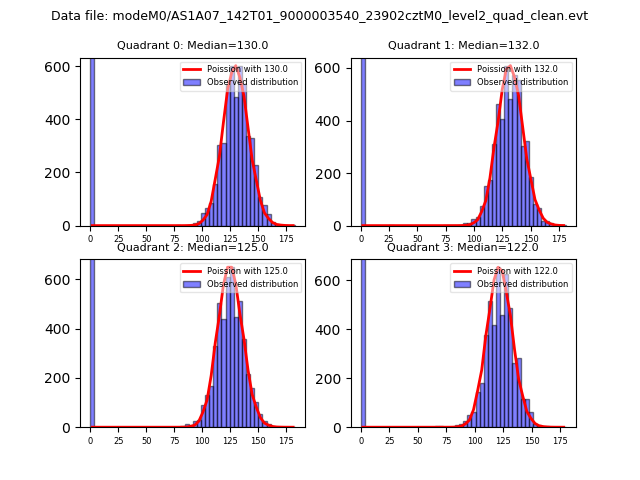 |
 |
| Quadrant-wise count rates Data is divided into 100 sec bins |
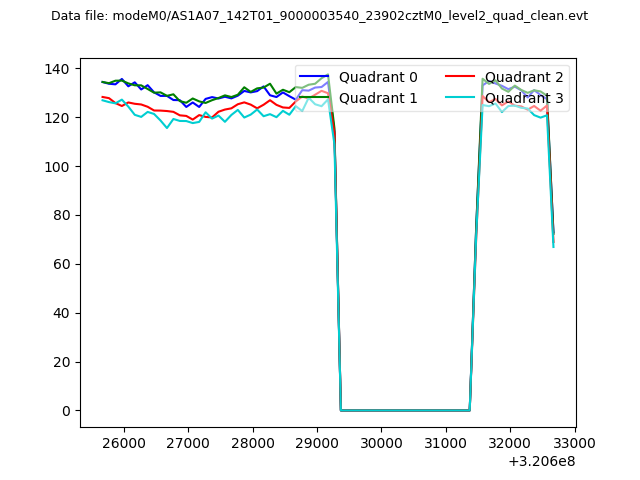 |
|
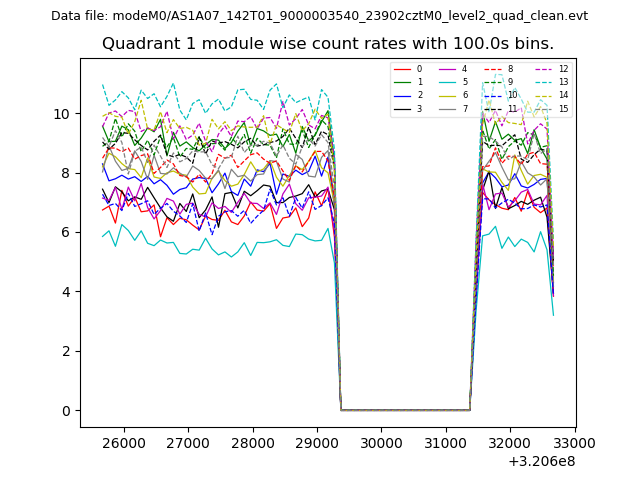
| Module-wise count rates for Quadrant A Data is divided into 100 sec bins |
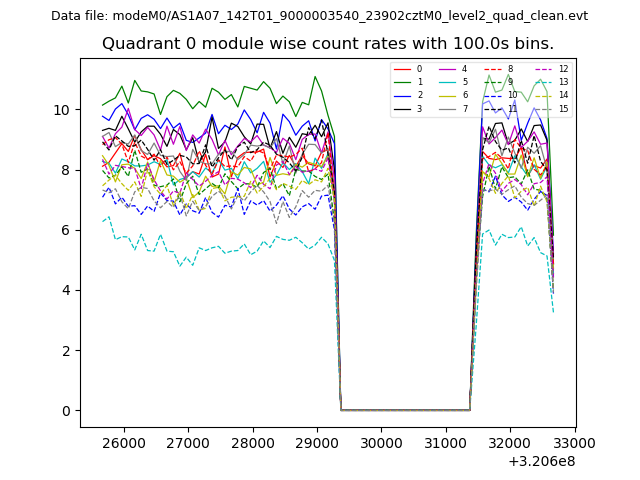 |
 |
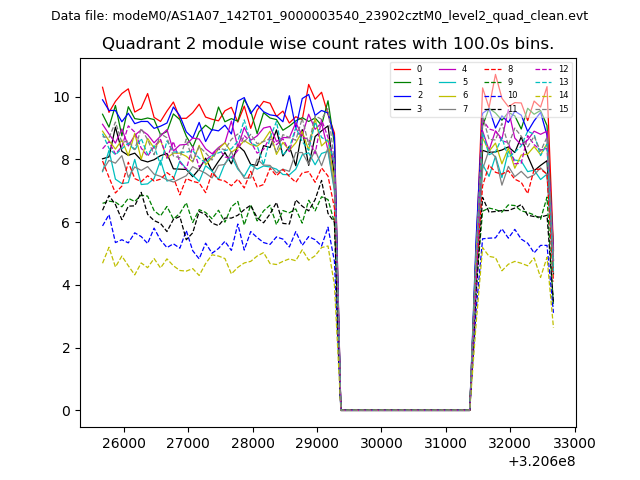
| Module-wise count rates for Quadrant B Data is divided into 100 sec bins |
 |
 |
| Module-wise count rates for Quadrant C Data is divided into 100 sec bins |
 |
 |
| Module-wise count rates for Quadrant D Data is divided into 100 sec bins |
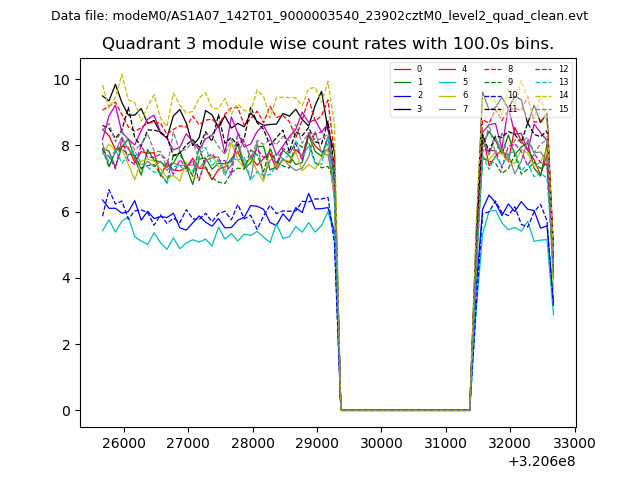 |
 |
| Parameter | Plot |
|---|---|
| CZT HV Monitor | 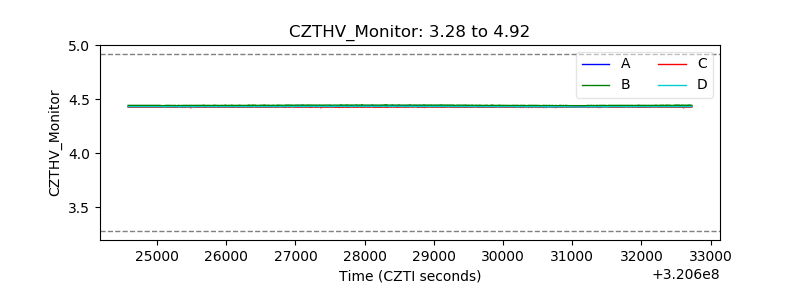 |
| D_VDD | 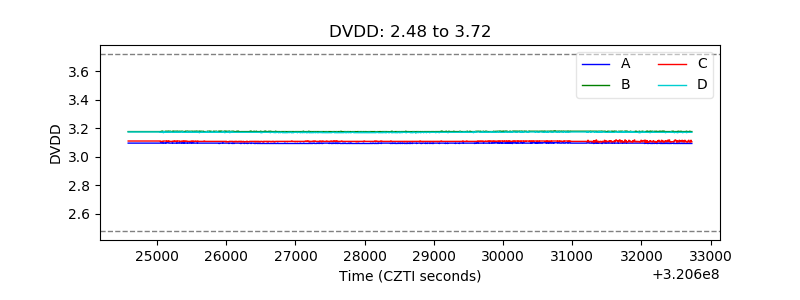 |
| Temperature 1 | 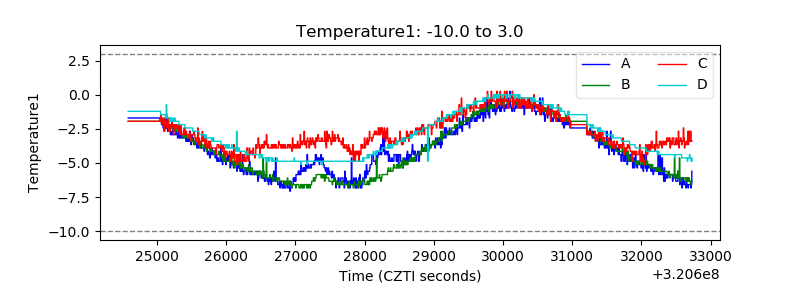 |
| Veto HV Monitor |  |
| Veto LLD | 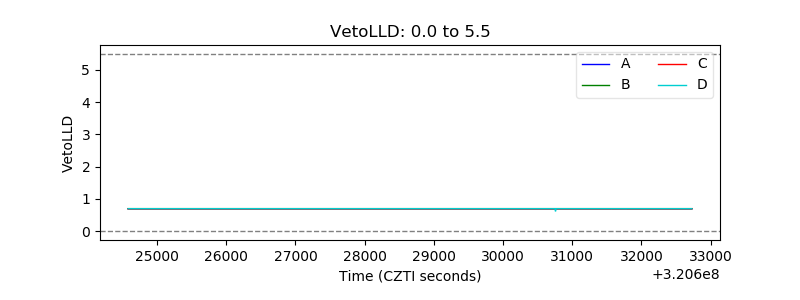 |
| Alpha Counter | 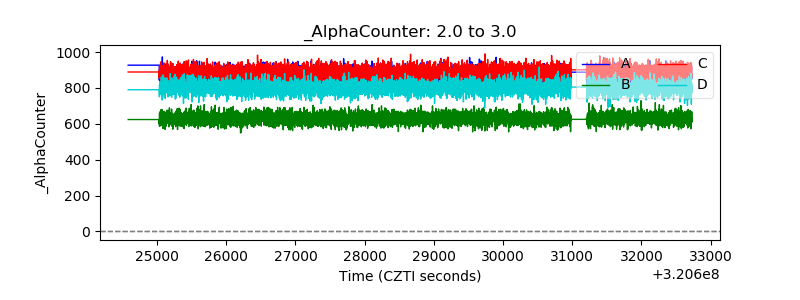 |
| _CPM_Rate | 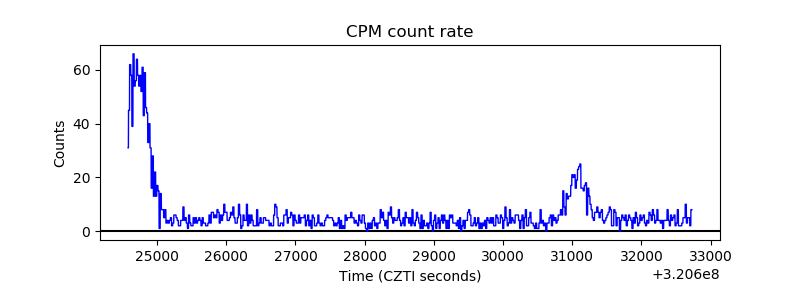 |
| CZT Counter | 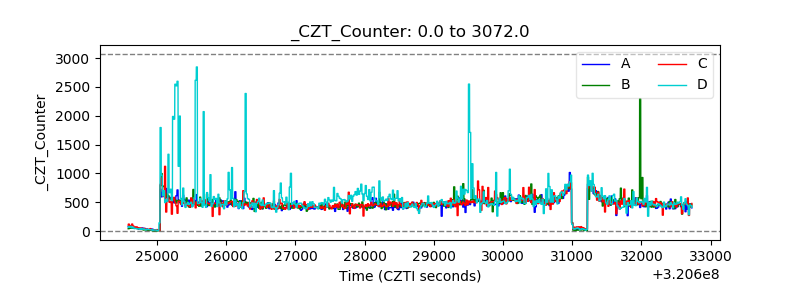 |
| +2.5 Volts monitor | 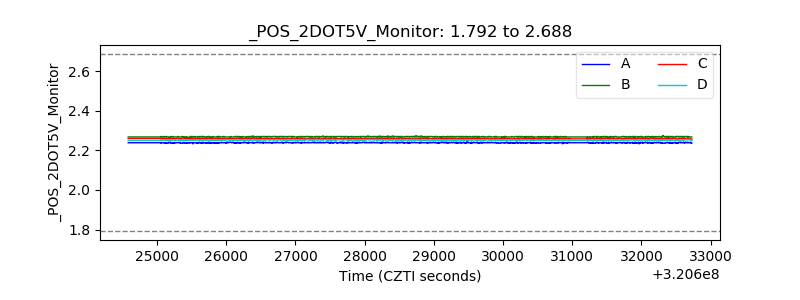 |
| +5 Volts monitor |  |
| _ROLL_ROT | 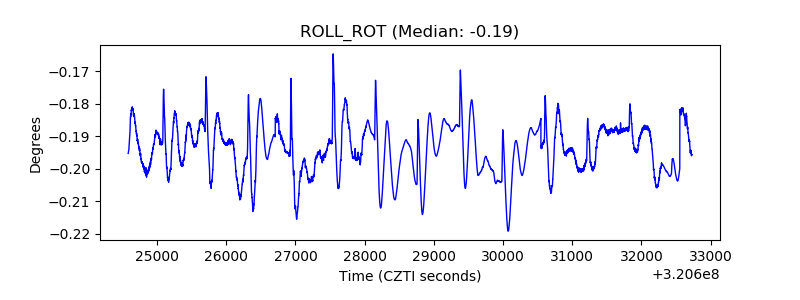 |
| _Roll_DEC | 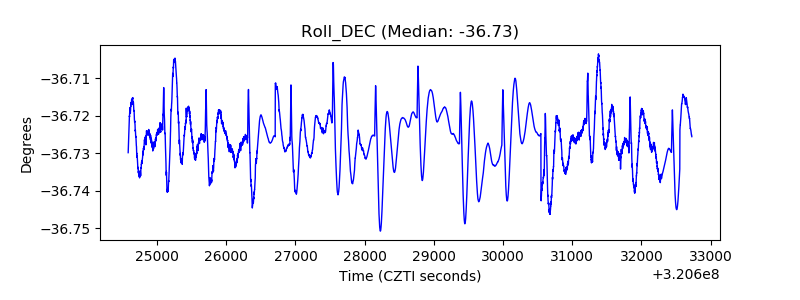 |
| _Roll_RA | 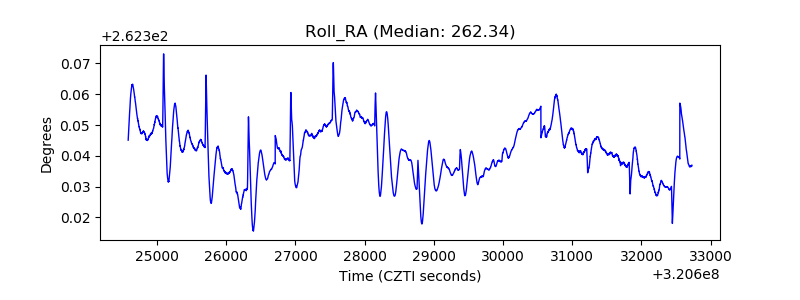 |
| Veto Counter | 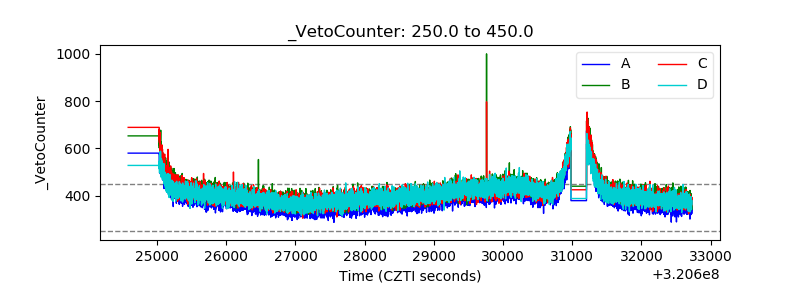 |