| Param | Original file | Final file |
|---|---|---|
| Filename | modeM0/AS1A07_142T01_9000003540_23903cztM0_level2.evt | modeM0/AS1A07_142T01_9000003540_23903cztM0_level2_quad_clean.evt |
| Size (bytes) | 537,704,640 | 105,739,200 |
| Size | 512.8 MB | 100.8 MB |
| Events in quadrant A | 3,647,836 | 680,469 |
| Events in quadrant B | 3,805,847 | 691,349 |
| Events in quadrant C | 3,751,851 | 656,981 |
| Events in quadrant D | 4,558,600 | 640,254 |
| Mode M9 | |||
|---|---|---|---|
| Quadrant | BADHDUFLAG | Total packets | Discarded packets |
| A | 0 | 6 | 0 |
| B | 0 | 6 | 0 |
| C | 0 | 6 | 0 |
| D | 0 | 6 | 0 |
| Mode M0 | |||
|---|---|---|---|
| Quadrant | BADHDUFLAG | Total packets | Discarded packets |
| A | 0 | 15839 | 2 |
| B | 0 | 16165 | 2 |
| C | 0 | 15922 | 3 |
| D | 0 | 18430 | 2 |
| Mode SS | |||
|---|---|---|---|
| Quadrant | BADHDUFLAG | Total packets | Discarded packets |
| A | 0 | 156 | 0 |
| B | 0 | 156 | 0 |
| C | 0 | 156 | 0 |
| D | 0 | 156 | 0 |
| Quadrant | Total seconds | Saturated seconds | Saturation percentage |
|---|---|---|---|
| A | 7672 | 48 | 0.625652% |
| B | 7673 | 109 | 1.420566% |
| C | 7672 | 121 | 1.577164% |
| D | 7672 | 102 | 1.329510% |
Noise dominated data is calculated using 1-second bins in cleaned event files. If a bin has >2000 counts, and if more than 50% of those come from <1% of pixels, then it is considered to be noise-dominated and hence unusable.
| Quadrant | # 1 sec bins | Bins with >0 counts | Bins with >2000 counts | High rate bins dominated by noise | Noise dominated (total time) | Noise dominated (detector-on time) | Marked lightcurve |
|---|---|---|---|---|---|---|---|
| A | 8207 | 7674 | 0 | 0 | 0.00% | 0.00% | 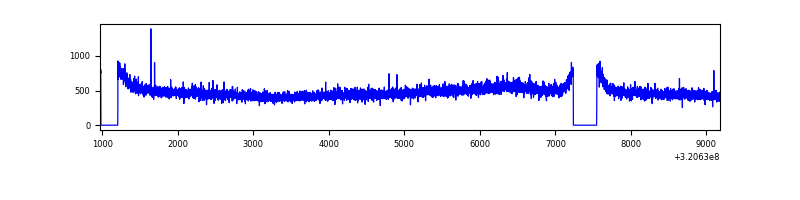 |
| B | 8208 | 7675 | 13 | 13 | 0.16% | 0.17% | 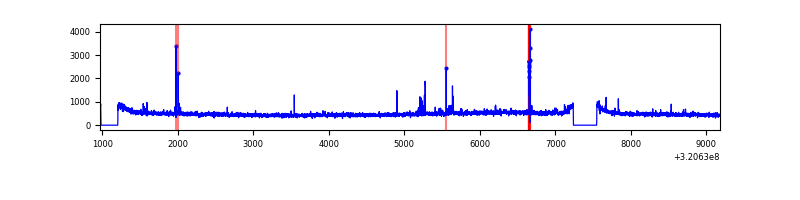 |
| C | 8207 | 7674 | 2 | 2 | 0.02% | 0.03% | 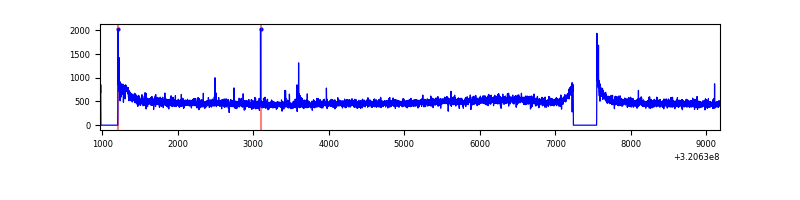 |
| D | 8207 | 7674 | 43 | 43 | 0.52% | 0.56% | 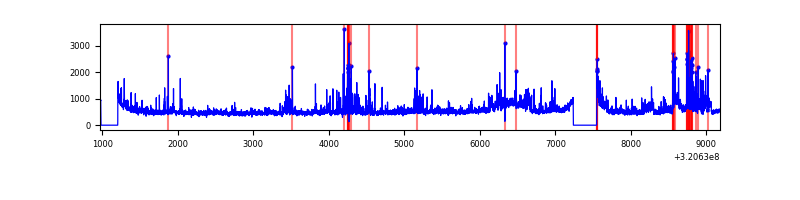 |
Top three noisy pixels from each quadrant. If the there are fewer than three noisy pixels in the level2.evt file, extra rows are filled as -1
| Pixel properties | Quadrant properties | ||||||
|---|---|---|---|---|---|---|---|
| Quadrant | DetID | PixID | Counts | Sigma | Mean | Median | Sigma |
| A | 13 | 254 | 12532 | 60.53 | 944 | 924 | 191.8 |
| A | 3 | 137 | 8343 | 38.69 | 944 | 924 | 191.8 |
| A | 0 | 226 | 8170 | 37.78 | 944 | 924 | 191.8 |
| B | 0 | 228 | 41627 | 226.24 | 945 | 921 | 179.9 |
| B | 12 | 111 | 21473 | 114.22 | 945 | 921 | 179.9 |
| B | 11 | 111 | 18847 | 99.63 | 945 | 921 | 179.9 |
| C | 14 | 238 | 142222 | 660.87 | 907 | 914 | 213.8 |
| C | 0 | 10 | 35663 | 162.51 | 907 | 914 | 213.8 |
| C | 10 | 9 | 12849 | 55.82 | 907 | 914 | 213.8 |
| D | 12 | 218 | 340499 | 1530.1 | 913 | 885 | 222.0 |
| D | 1 | 52 | 299888 | 1347.13 | 913 | 885 | 222.0 |
| D | 7 | 238 | 240401 | 1079.12 | 913 | 885 | 222.0 |
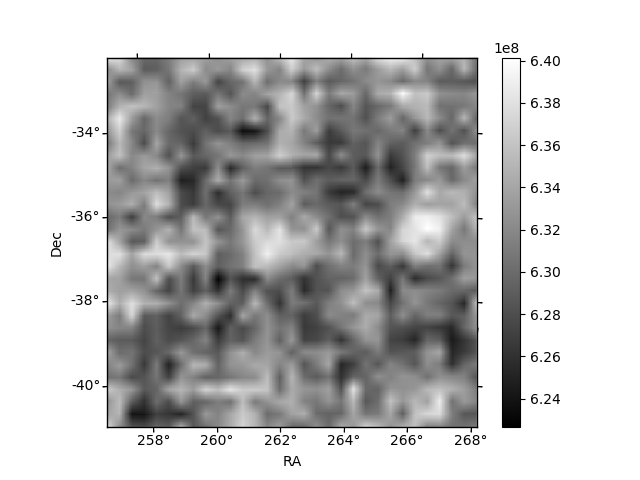
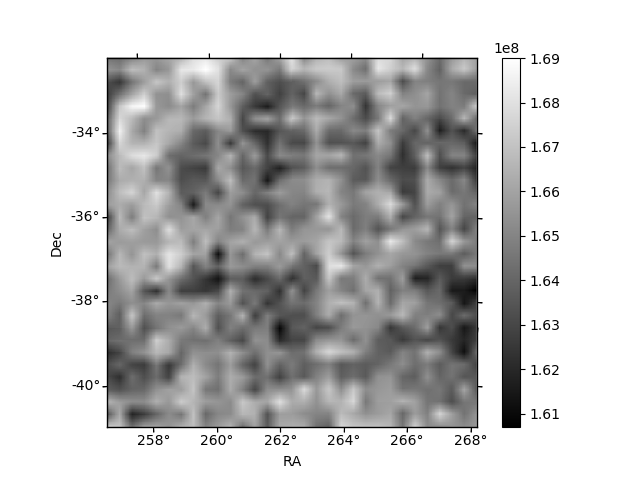
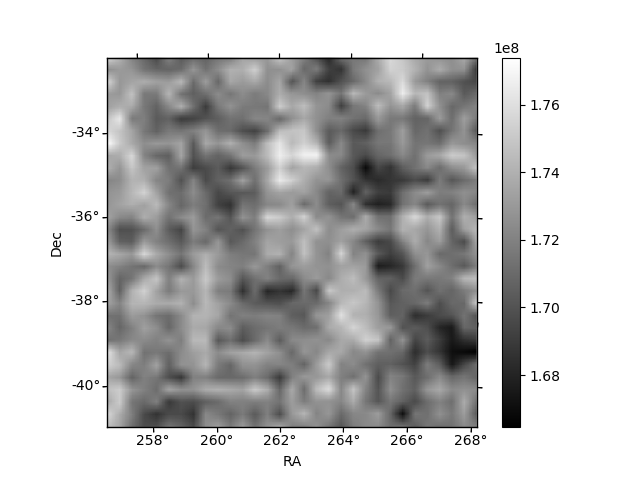
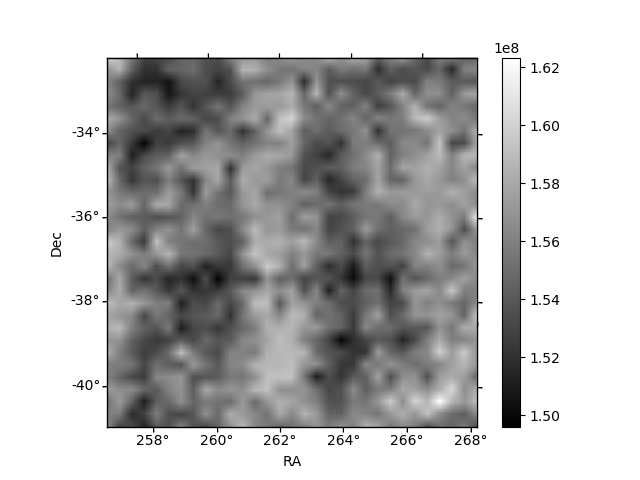
Histogram calculated using DETX and DETY for each event in the final _common_clean file
| Quadrant A | 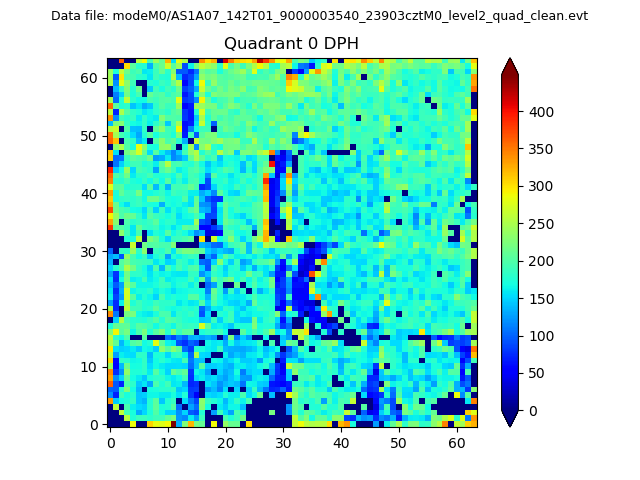 |
 |
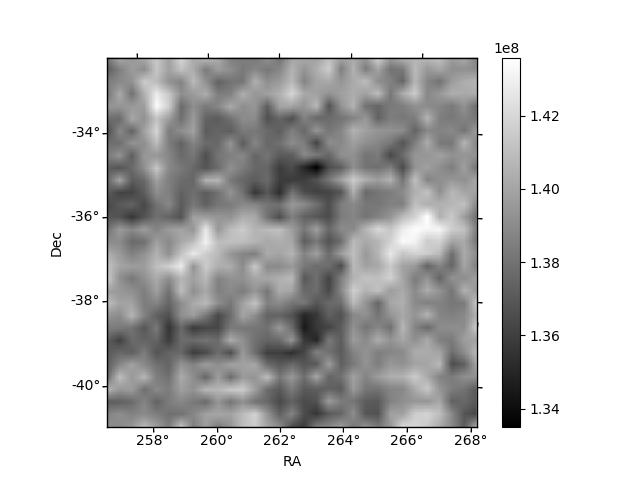
Quadrant B |
|---|---|---|---|
| Quadrant D | 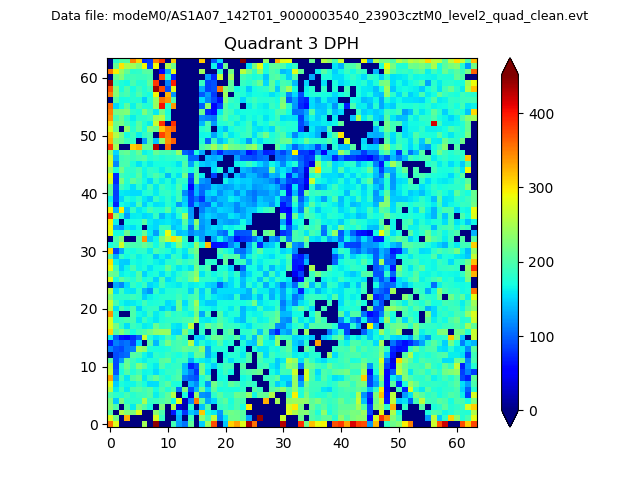 |
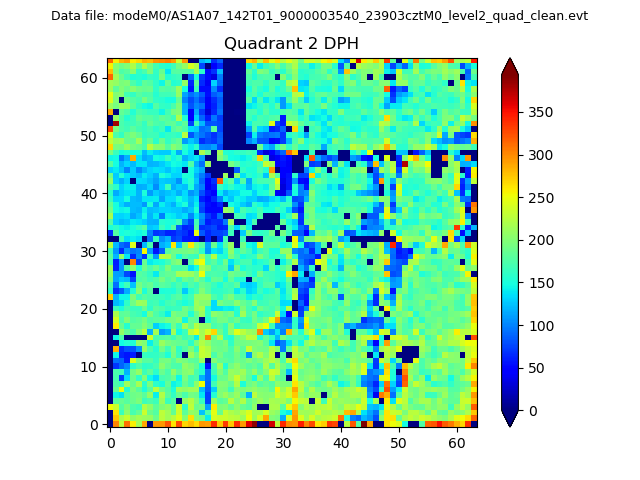 |
Quadrant C |
| Plot type | Count rate plots | Images |
|---|---|---|
| Comparison with Poisson distribution Blue bars denote a histogram of data divided into 1 sec bins. Red curve is a Poisson curve with rate = median count rate of data. |
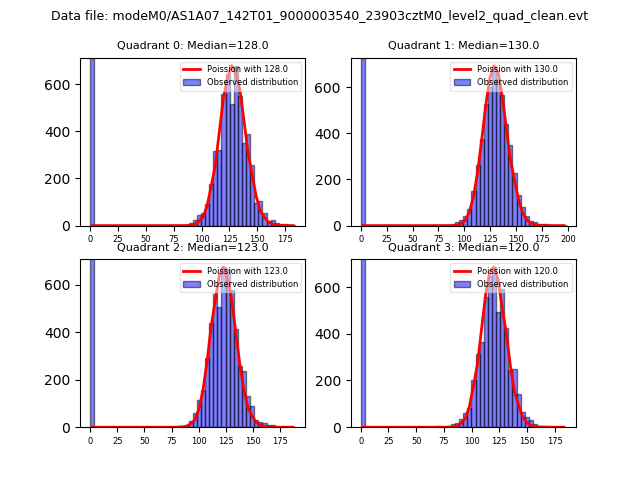 |
 |
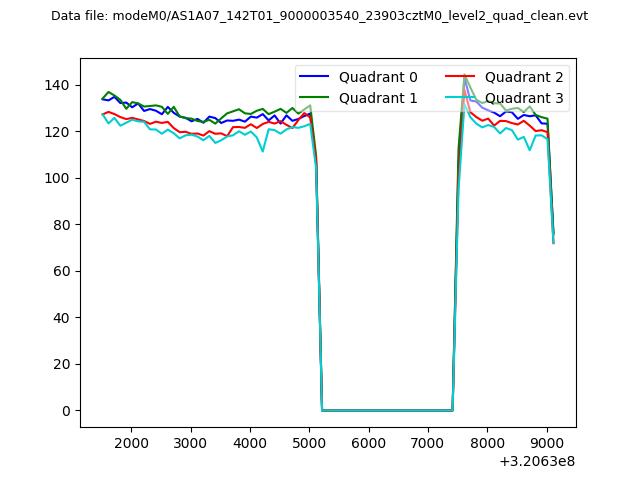
| Quadrant-wise count rates Data is divided into 100 sec bins |
 |
|
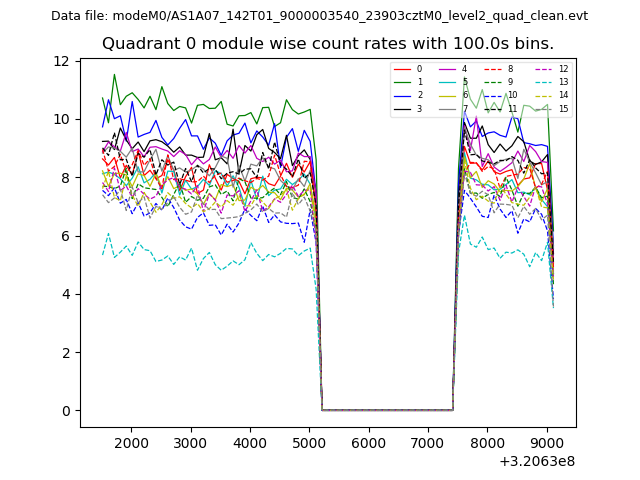
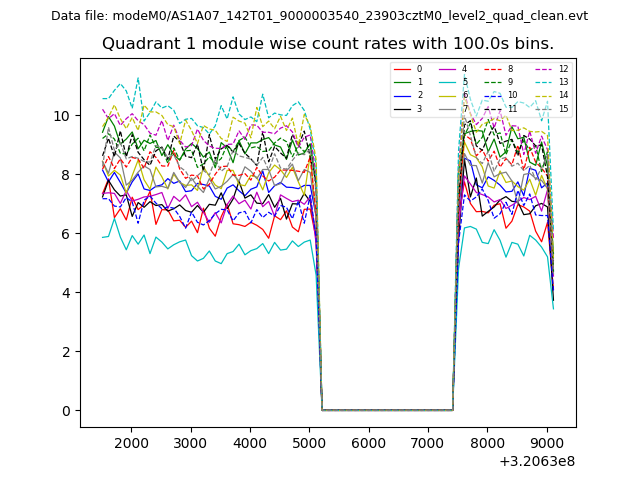
| Module-wise count rates for Quadrant A Data is divided into 100 sec bins |
 |
 |
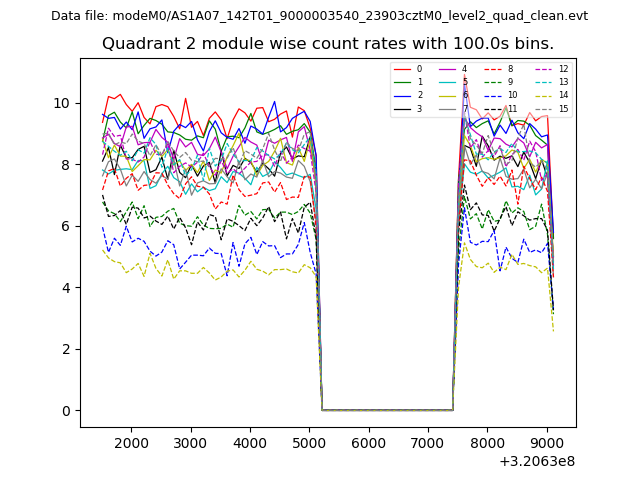
| Module-wise count rates for Quadrant B Data is divided into 100 sec bins |
 |
 |
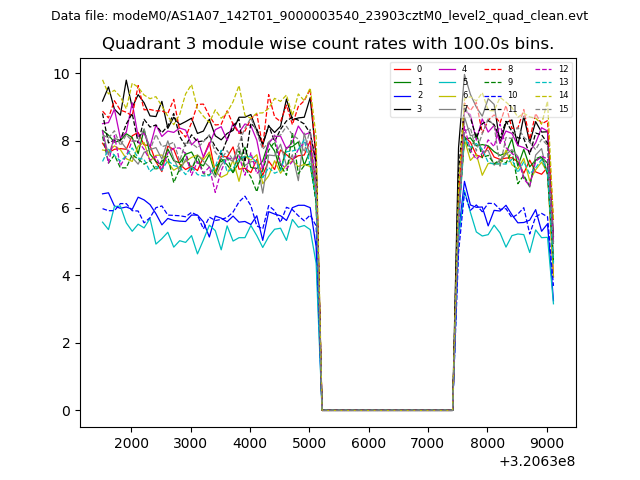
| Module-wise count rates for Quadrant C Data is divided into 100 sec bins |
 |
 |
| Module-wise count rates for Quadrant D Data is divided into 100 sec bins |
 |
 |
| Parameter | Plot |
|---|---|
| CZT HV Monitor | 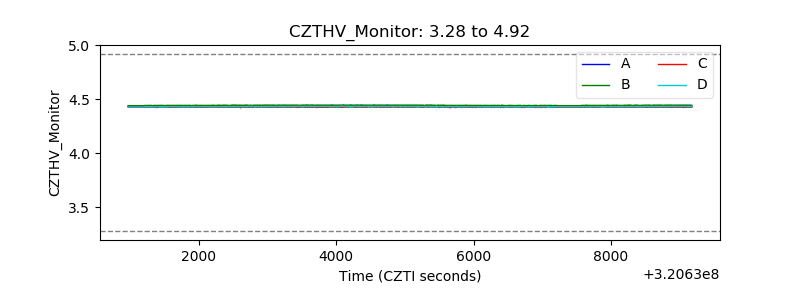 |
| D_VDD | 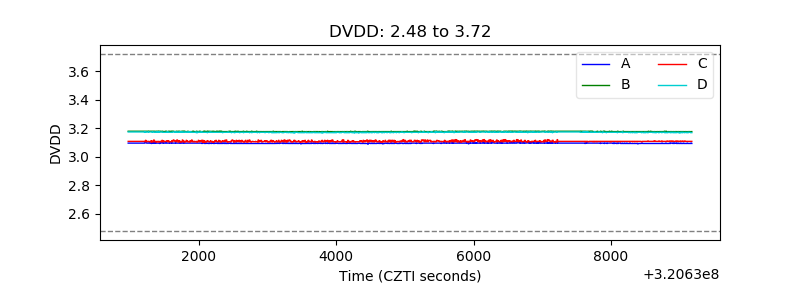 |
| Temperature 1 |  |
| Veto HV Monitor | 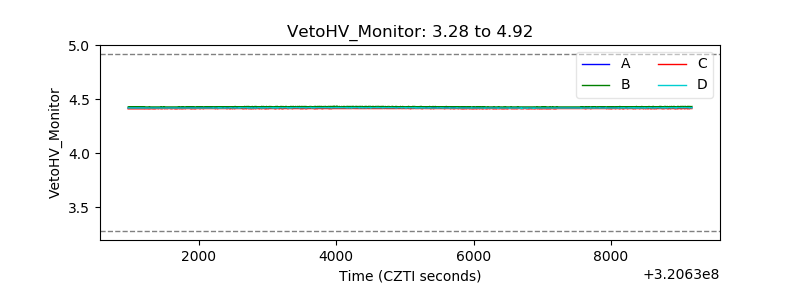 |
| Veto LLD |  |
| Alpha Counter | 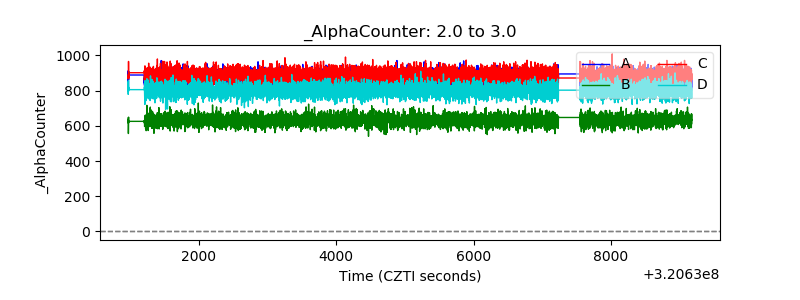 |
| _CPM_Rate | 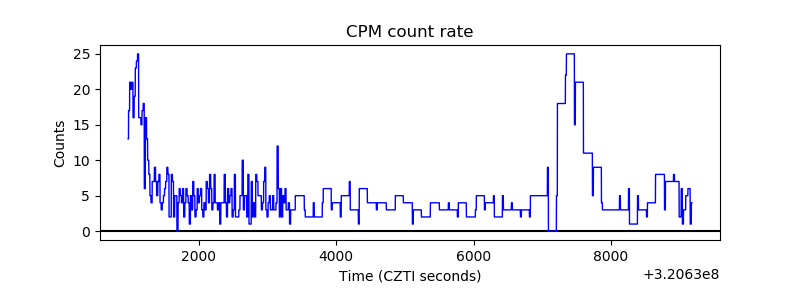 |
| CZT Counter | 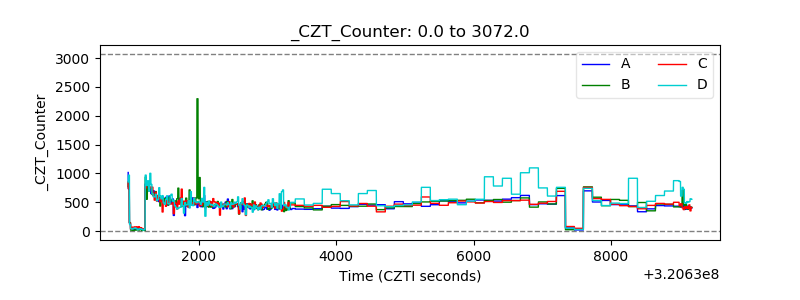 |
| +2.5 Volts monitor |  |
| +5 Volts monitor | 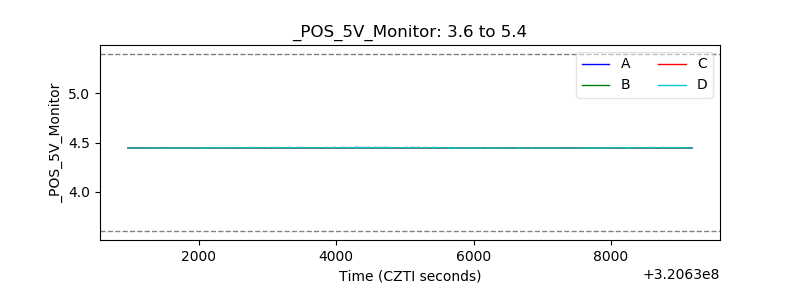 |
| _ROLL_ROT | 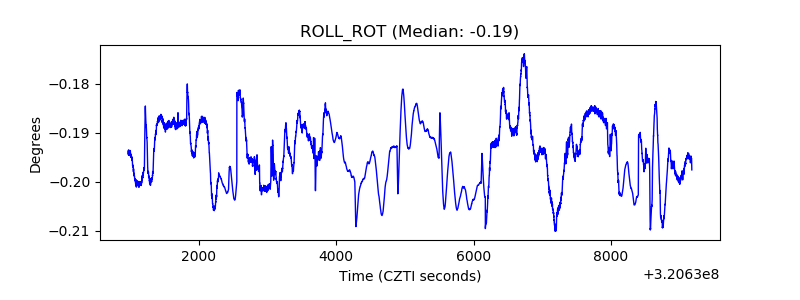 |
| _Roll_DEC | 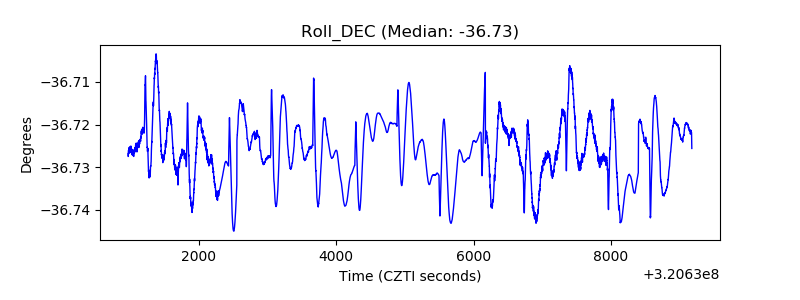 |
| _Roll_RA |  |
| Veto Counter | 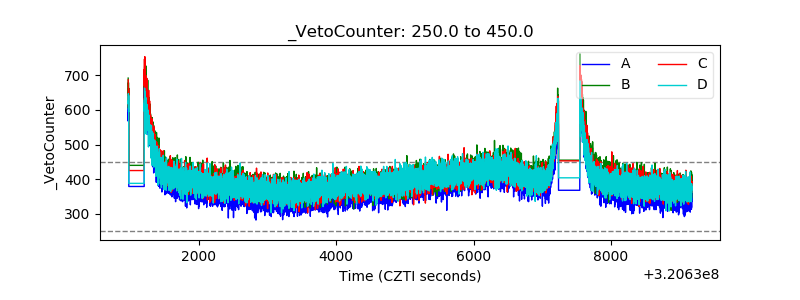 |