| Param | Original file | Final file |
|---|---|---|
| Filename | modeM0/AS1A07_142T01_9000003540_23907cztM0_level2.evt | modeM0/AS1A07_142T01_9000003540_23907cztM0_level2_quad_clean.evt |
| Size (bytes) | 193,170,240 | 47,304,000 |
| Size | 184.2 MB | 45.1 MB |
| Events in quadrant A | 1,288,658 | 320,364 |
| Events in quadrant B | 1,330,438 | 324,750 |
| Events in quadrant C | 1,336,366 | 310,675 |
| Events in quadrant D | 1,699,615 | 274,166 |
| Mode M9 | |||
|---|---|---|---|
| Quadrant | BADHDUFLAG | Total packets | Discarded packets |
| A | 0 | 11 | 4 |
| B | 0 | 11 | 5 |
| C | 0 | 11 | 4 |
| D | 0 | 10 | 6 |
| Mode M0 | |||
|---|---|---|---|
| Quadrant | BADHDUFLAG | Total packets | Discarded packets |
| A | 0 | 26061 | 20285 |
| B | 0 | 26377 | 20549 |
| C | 0 | 26143 | 20323 |
| D | 0 | 36970 | 30270 |
| Mode SS | |||
|---|---|---|---|
| Quadrant | BADHDUFLAG | Total packets | Discarded packets |
| A | 0 | 265 | 207 |
| B | 0 | 263 | 204 |
| C | 0 | 267 | 207 |
| D | 0 | 268 | 209 |
| Quadrant | Total seconds | Saturated seconds | Saturation percentage |
|---|---|---|---|
| A | 2869 | 8 | 0.278843% |
| B | 2884 | 10 | 0.346741% |
| C | 2890 | 25 | 0.865052% |
| D | 2631 | 48 | 1.824401% |
Noise dominated data is calculated using 1-second bins in cleaned event files. If a bin has >2000 counts, and if more than 50% of those come from <1% of pixels, then it is considered to be noise-dominated and hence unusable.
| Quadrant | # 1 sec bins | Bins with >0 counts | Bins with >2000 counts | High rate bins dominated by noise | Noise dominated (total time) | Noise dominated (detector-on time) | Marked lightcurve |
|---|---|---|---|---|---|---|---|
| A | 15369 | 3474 | 0 | 0 | 0.00% | 0.00% | 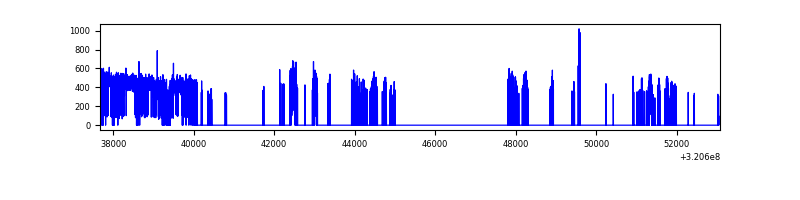 |
| B | 15381 | 3508 | 0 | 0 | 0.00% | 0.00% | 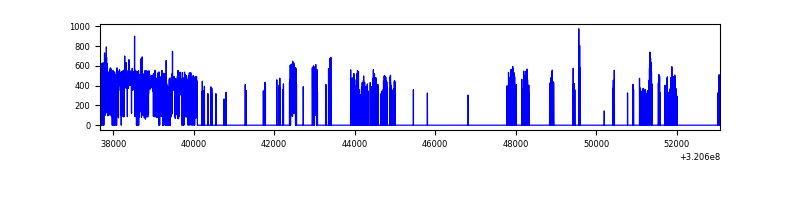 |
| C | 15394 | 3539 | 0 | 0 | 0.00% | 0.00% | 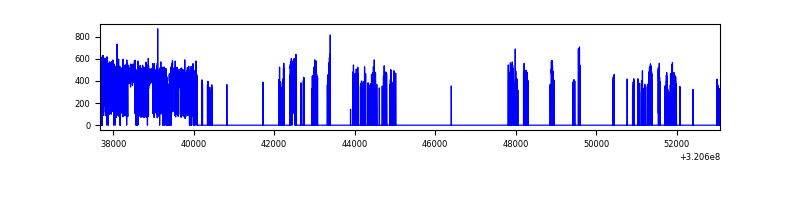 |
| D | 15384 | 3230 | 15 | 15 | 0.10% | 0.46% | 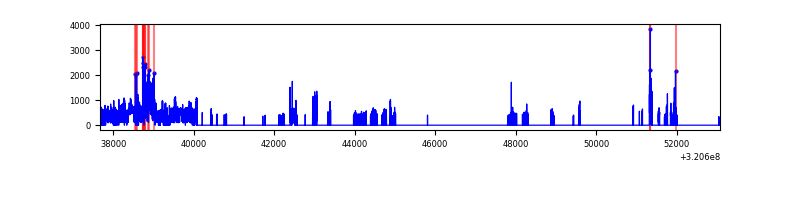 |
Top three noisy pixels from each quadrant. If the there are fewer than three noisy pixels in the level2.evt file, extra rows are filled as -1
| Pixel properties | Quadrant properties | ||||||
|---|---|---|---|---|---|---|---|
| Quadrant | DetID | PixID | Counts | Sigma | Mean | Median | Sigma |
| A | 13 | 254 | 4611 | 62.38 | 334 | 327 | 68.7 |
| A | 3 | 137 | 2927 | 37.86 | 334 | 327 | 68.7 |
| A | 0 | 226 | 2858 | 36.85 | 334 | 327 | 68.7 |
| B | 12 | 111 | 7703 | 109.97 | 338 | 329 | 67.1 |
| B | 11 | 111 | 6751 | 95.77 | 338 | 329 | 67.1 |
| B | 14 | 111 | 5971 | 84.14 | 338 | 329 | 67.1 |
| C | 14 | 238 | 51330 | 641.26 | 328 | 330 | 79.5 |
| C | 13 | 61 | 2274 | 24.44 | 328 | 330 | 79.5 |
| C | 7 | 247 | 1551 | 15.35 | 328 | 330 | 79.5 |
| D | 7 | 238 | 255606 | 3462.13 | 296 | 288 | 73.7 |
| D | 12 | 218 | 175194 | 2371.74 | 296 | 288 | 73.7 |
| D | 1 | 52 | 68970 | 931.33 | 296 | 288 | 73.7 |
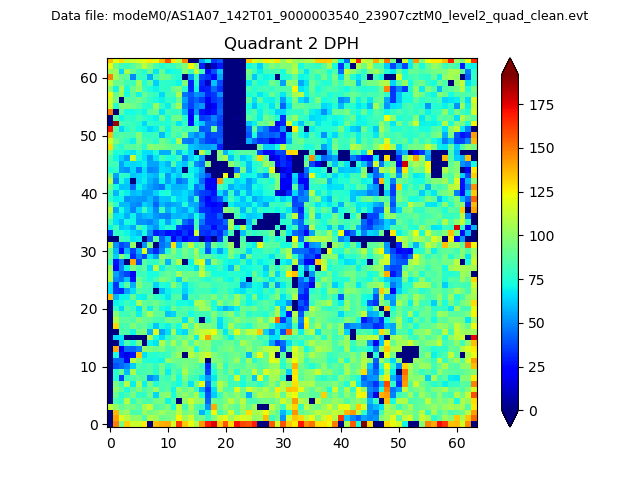
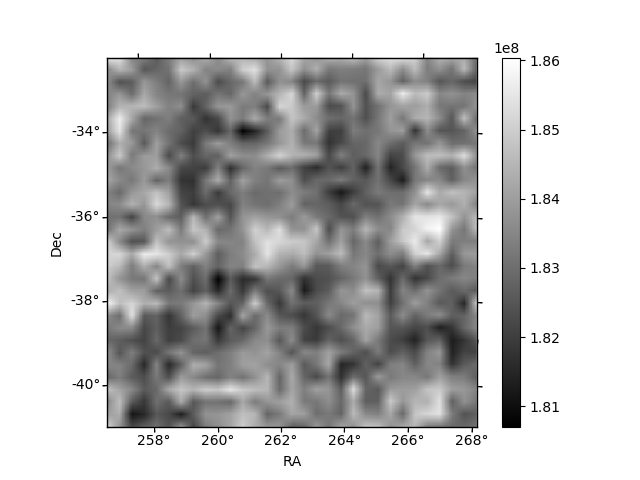
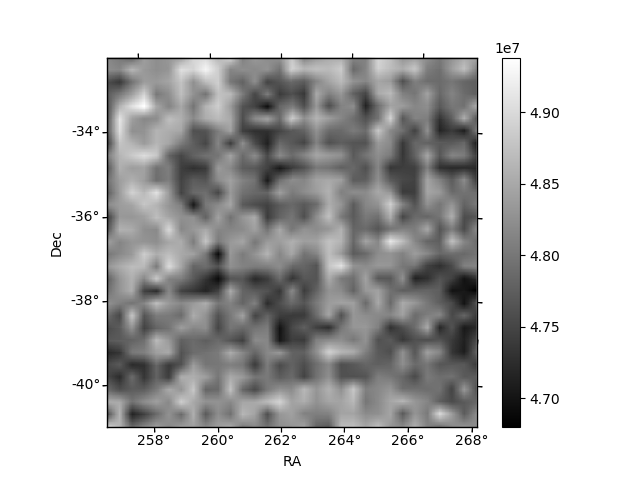
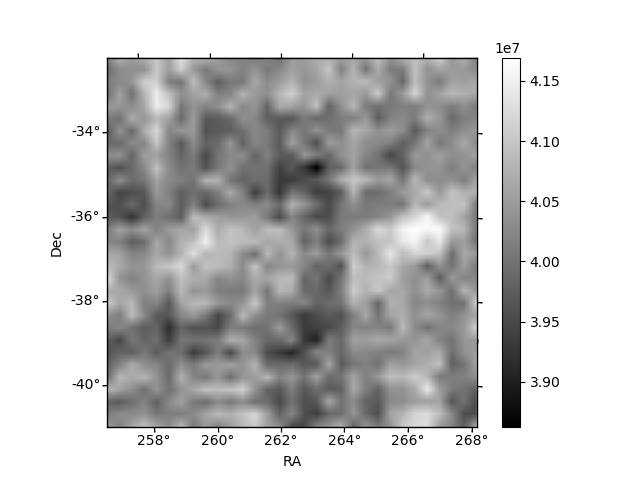
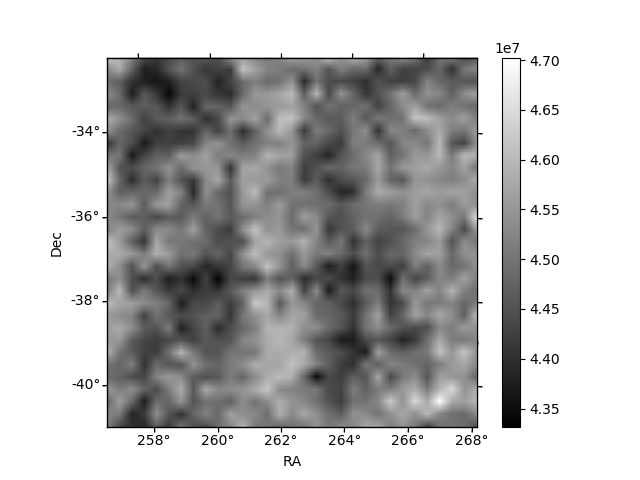
Histogram calculated using DETX and DETY for each event in the final _common_clean file
| Quadrant A | 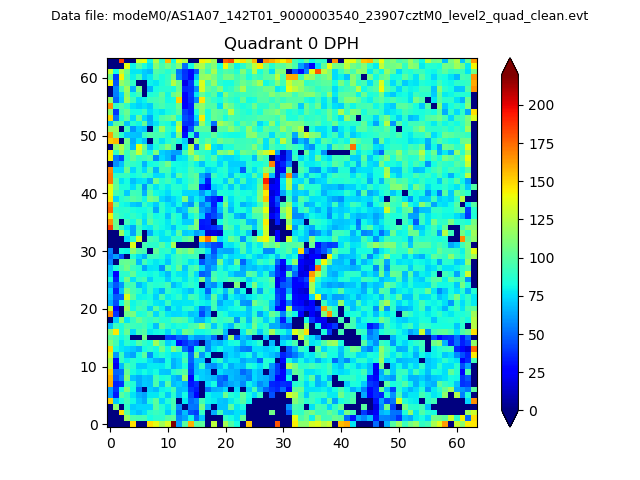 |
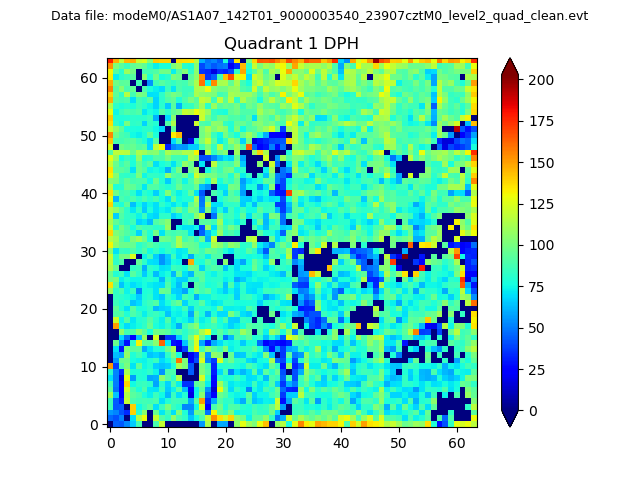 |
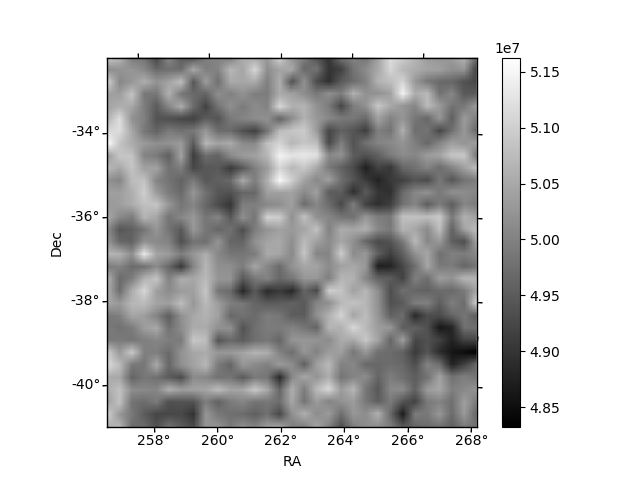
Quadrant B |
|---|---|---|---|
| Quadrant D | 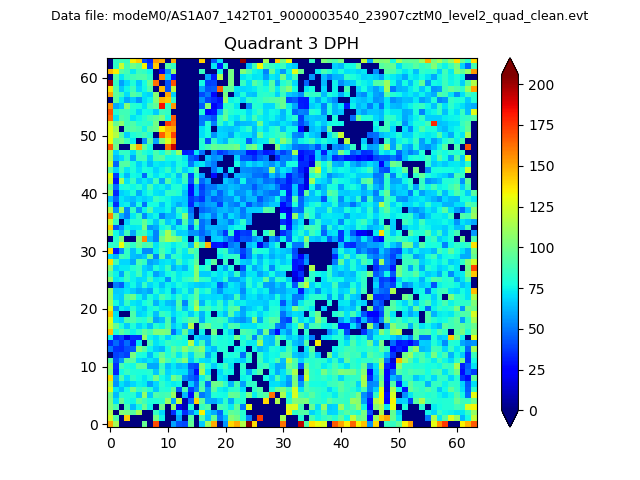 |
 |
Quadrant C |
| Plot type | Count rate plots | Images |
|---|---|---|
| Comparison with Poisson distribution Blue bars denote a histogram of data divided into 1 sec bins. Red curve is a Poisson curve with rate = median count rate of data. |
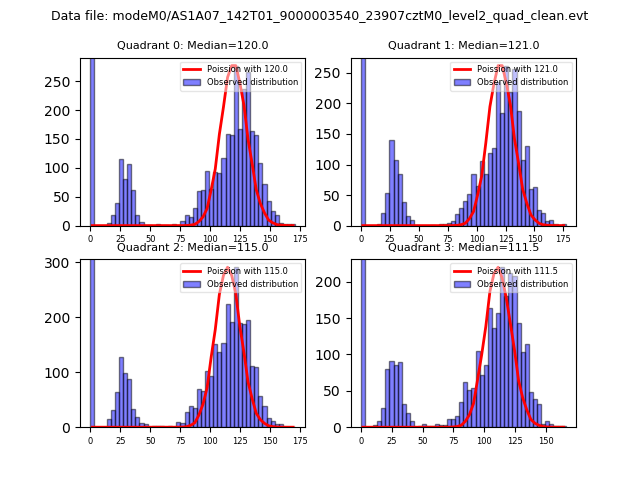 |
 |
| Quadrant-wise count rates Data is divided into 100 sec bins |
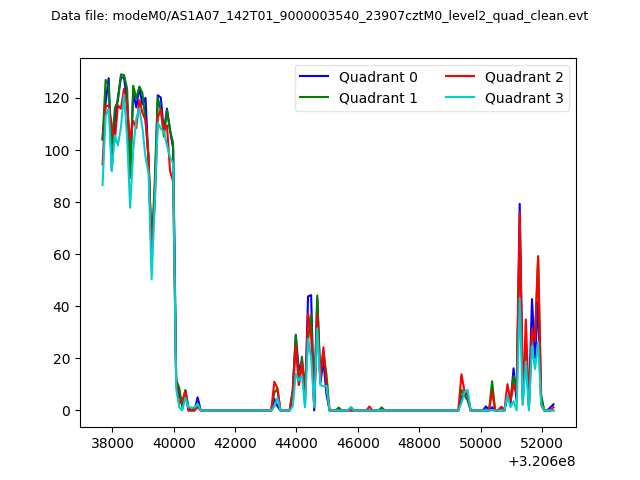 |
|
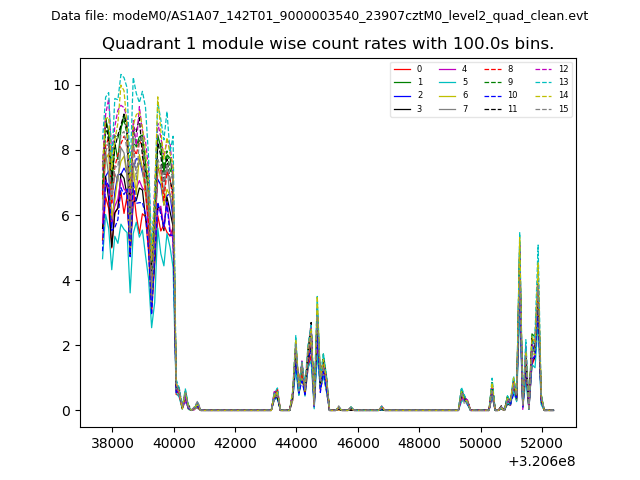
| Module-wise count rates for Quadrant A Data is divided into 100 sec bins |
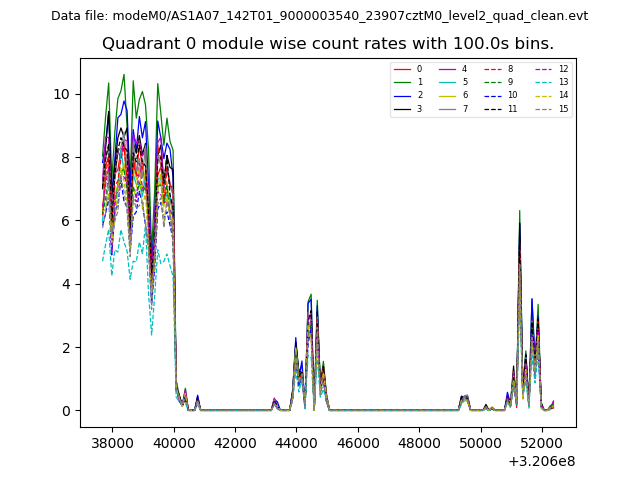 |
 |
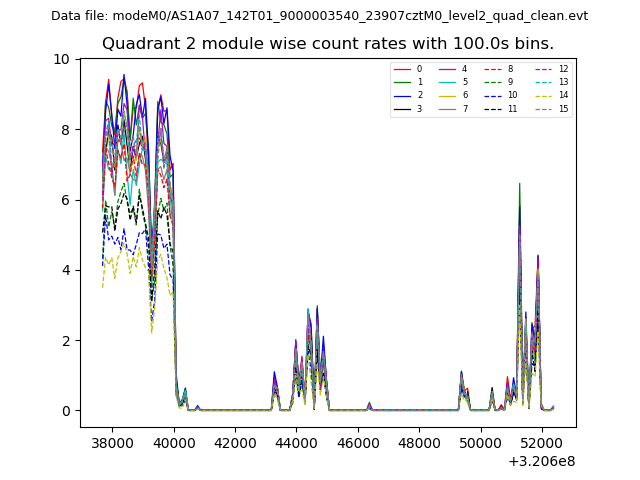
| Module-wise count rates for Quadrant B Data is divided into 100 sec bins |
 |
 |
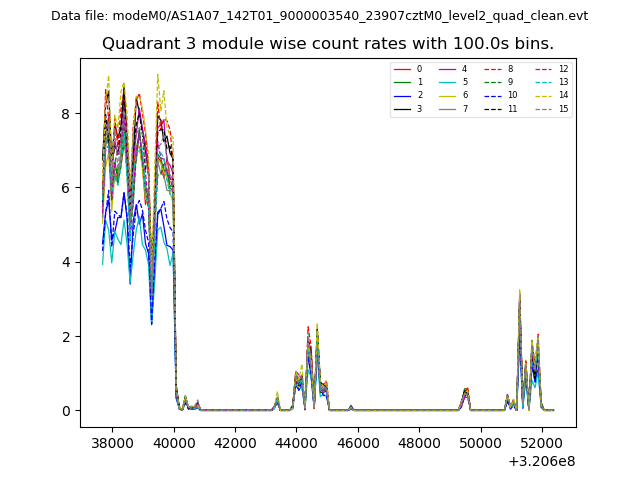
| Module-wise count rates for Quadrant C Data is divided into 100 sec bins |
 |
 |
| Module-wise count rates for Quadrant D Data is divided into 100 sec bins |
 |
 |
| Parameter | Plot |
|---|---|
| CZT HV Monitor | 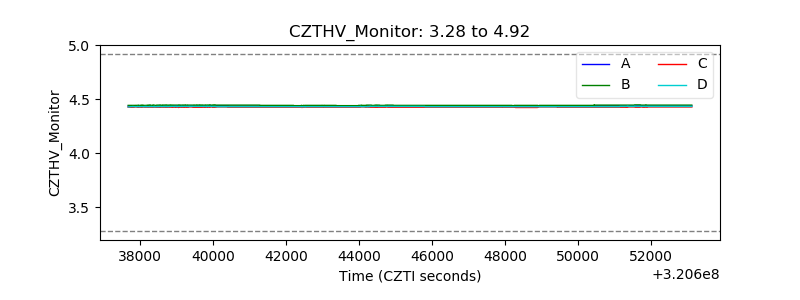 |
| D_VDD | 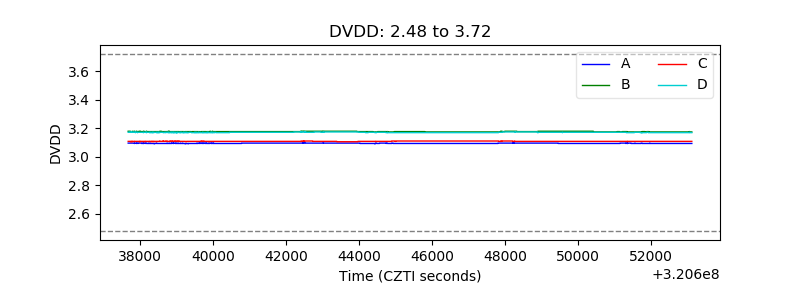 |
| Temperature 1 | 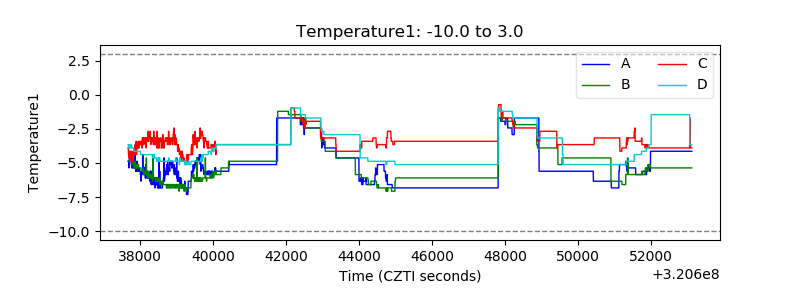 |
| Veto HV Monitor | 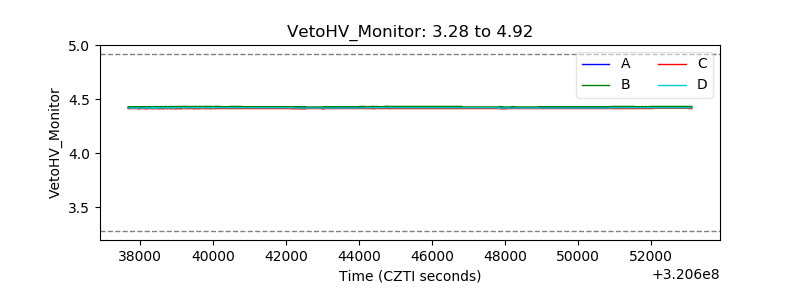 |
| Veto LLD | 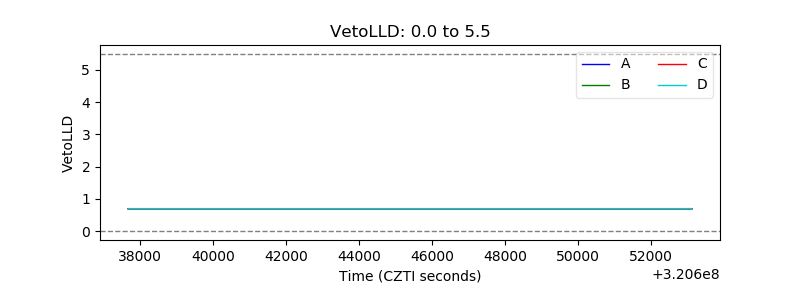 |
| Alpha Counter | 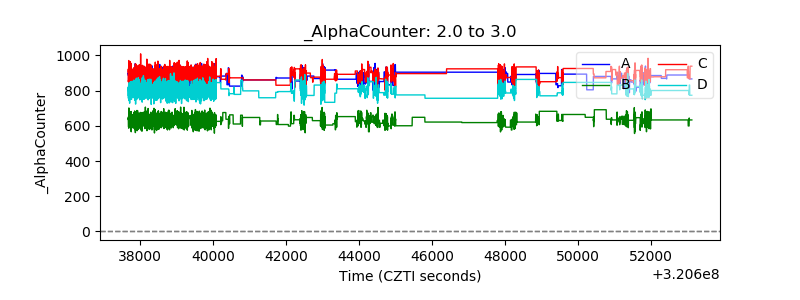 |
| _CPM_Rate | 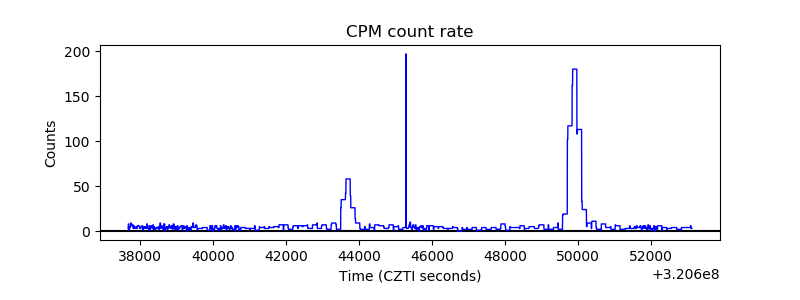 |
| CZT Counter | 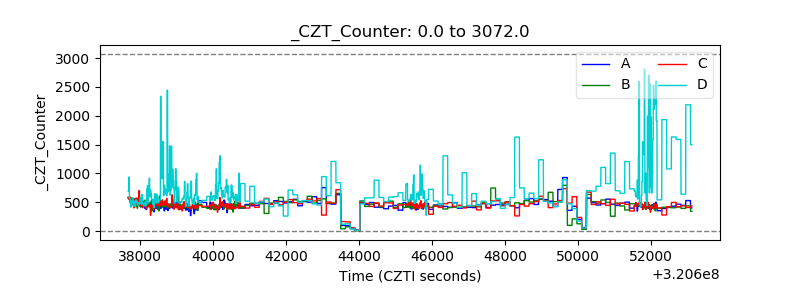 |
| +2.5 Volts monitor |  |
| +5 Volts monitor |  |
| _ROLL_ROT | 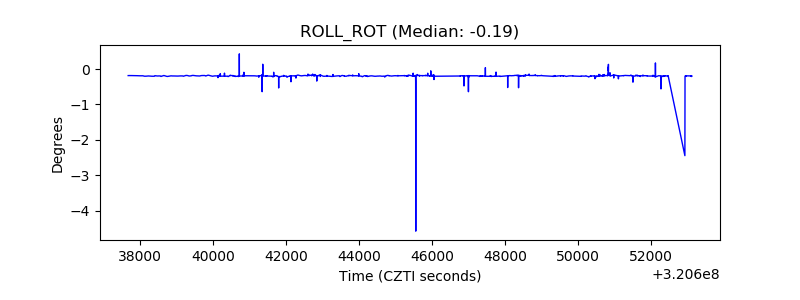 |
| _Roll_DEC | 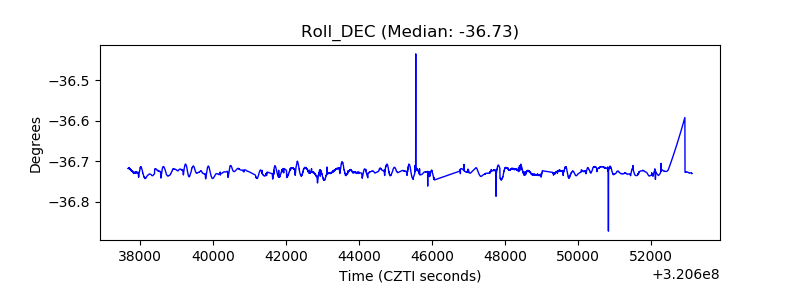 |
| _Roll_RA | 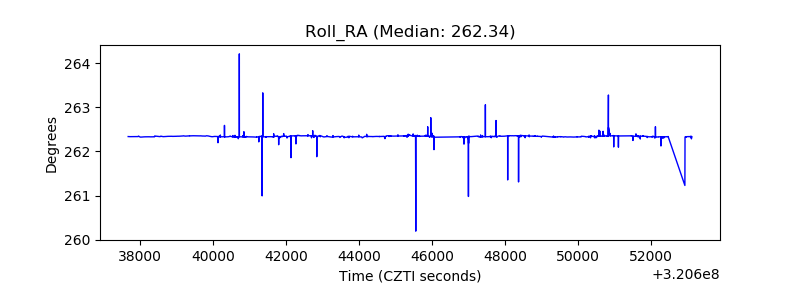 |
| Veto Counter | 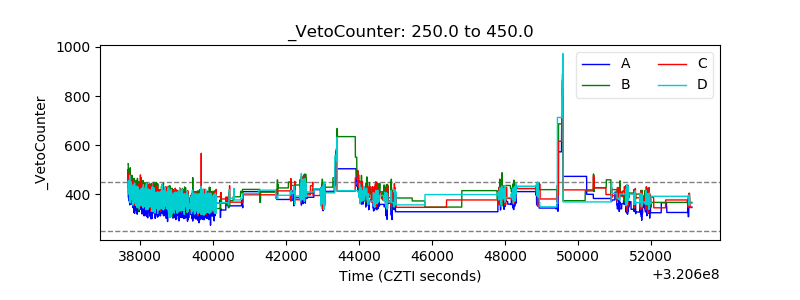 |