| Param | Original file | Final file |
|---|---|---|
| Filename | modeM0/AS1A07_142T01_9000003540_23910cztM0_level2.evt | modeM0/AS1A07_142T01_9000003540_23910cztM0_level2_quad_clean.evt |
| Size (bytes) | 652,728,960 | 82,679,040 |
| Size | 622.5 MB | 78.8 MB |
| Events in quadrant A | 3,405,010 | 556,627 |
| Events in quadrant B | 3,570,467 | 561,084 |
| Events in quadrant C | 3,421,672 | 525,908 |
| Events in quadrant D | 8,930,461 | 406,091 |
| Mode M9 | |||
|---|---|---|---|
| Quadrant | BADHDUFLAG | Total packets | Discarded packets |
| A | 0 | 12 | 0 |
| B | 0 | 12 | 0 |
| C | 0 | 12 | 0 |
| D | 0 | 12 | 0 |
| Mode M0 | |||
|---|---|---|---|
| Quadrant | BADHDUFLAG | Total packets | Discarded packets |
| A | 0 | 14103 | 1 |
| B | 0 | 14630 | 1 |
| C | 0 | 14124 | 1 |
| D | 0 | 30980 | 1 |
| Mode SS | |||
|---|---|---|---|
| Quadrant | BADHDUFLAG | Total packets | Discarded packets |
| A | 0 | 132 | 0 |
| B | 0 | 132 | 0 |
| C | 0 | 132 | 0 |
| D | 0 | 132 | 0 |
| Quadrant | Total seconds | Saturated seconds | Saturation percentage |
|---|---|---|---|
| A | 6497 | 69 | 1.062029% |
| B | 6498 | 83 | 1.277316% |
| C | 6498 | 115 | 1.769775% |
| D | 6498 | 2547 | 39.196676% |
Noise dominated data is calculated using 1-second bins in cleaned event files. If a bin has >2000 counts, and if more than 50% of those come from <1% of pixels, then it is considered to be noise-dominated and hence unusable.
| Quadrant | # 1 sec bins | Bins with >0 counts | Bins with >2000 counts | High rate bins dominated by noise | Noise dominated (total time) | Noise dominated (detector-on time) | Marked lightcurve |
|---|---|---|---|---|---|---|---|
| A | 7697 | 6498 | 0 | 0 | 0.00% | 0.00% | 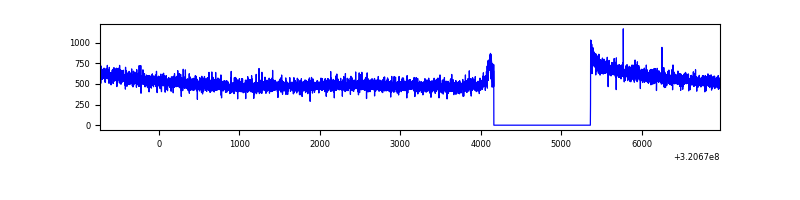 |
| B | 7698 | 6499 | 2 | 2 | 0.03% | 0.03% | 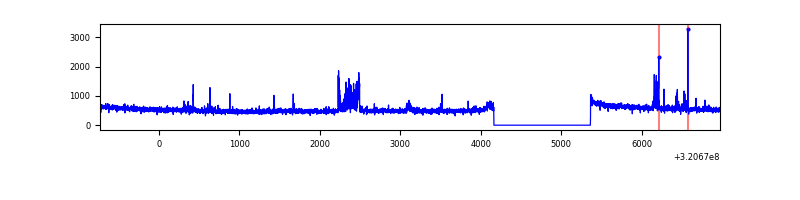 |
| C | 7698 | 6499 | 6 | 6 | 0.08% | 0.09% | 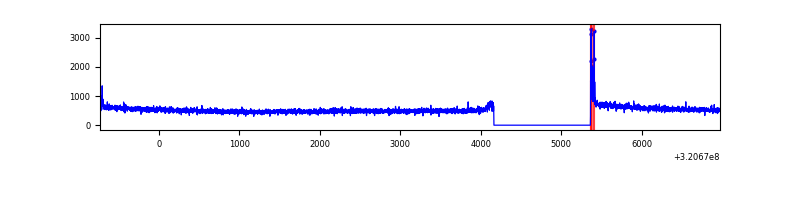 |
| D | 7698 | 6497 | 1821 | 1821 | 23.66% | 28.03% | 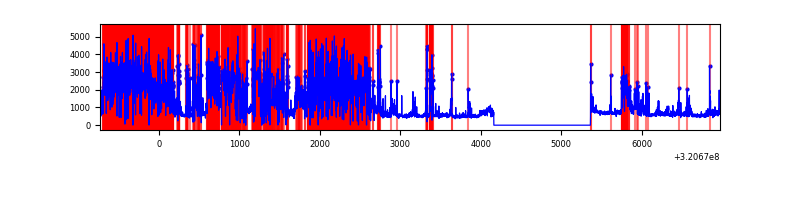 |
Top three noisy pixels from each quadrant. If the there are fewer than three noisy pixels in the level2.evt file, extra rows are filled as -1
| Pixel properties | Quadrant properties | ||||||
|---|---|---|---|---|---|---|---|
| Quadrant | DetID | PixID | Counts | Sigma | Mean | Median | Sigma |
| A | 13 | 254 | 10936 | 57.11 | 883 | 868 | 176.3 |
| A | 0 | 226 | 7783 | 39.22 | 883 | 868 | 176.3 |
| A | 3 | 137 | 6876 | 34.08 | 883 | 868 | 176.3 |
| B | 15 | 32 | 114111 | 699.15 | 866 | 848 | 162.0 |
| B | 0 | 228 | 26544 | 158.62 | 866 | 848 | 162.0 |
| B | 12 | 111 | 18655 | 109.92 | 866 | 848 | 162.0 |
| C | 14 | 238 | 135899 | 709.11 | 829 | 837 | 190.5 |
| C | 0 | 10 | 47970 | 247.46 | 829 | 837 | 190.5 |
| C | 13 | 61 | 5728 | 25.68 | 829 | 837 | 190.5 |
| D | 12 | 218 | 5610924 | 35978.56 | 642 | 624 | 155.9 |
| D | 12 | 250 | 419739 | 2687.76 | 642 | 624 | 155.9 |
| D | 8 | 195 | 275983 | 1765.86 | 642 | 624 | 155.9 |
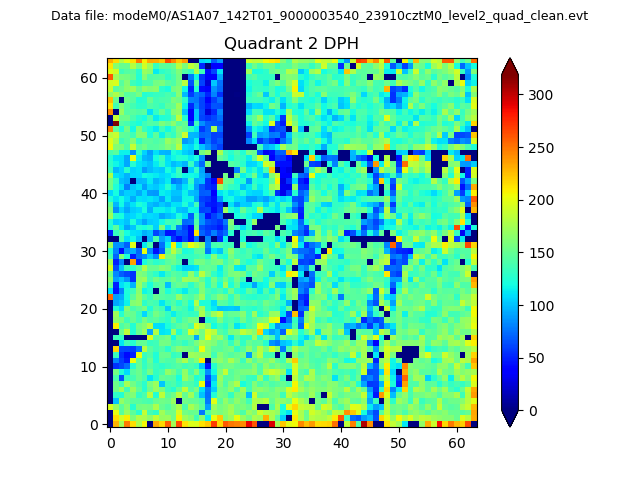
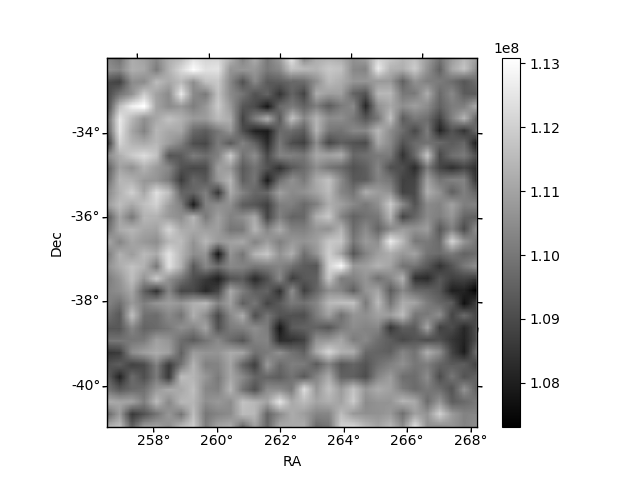
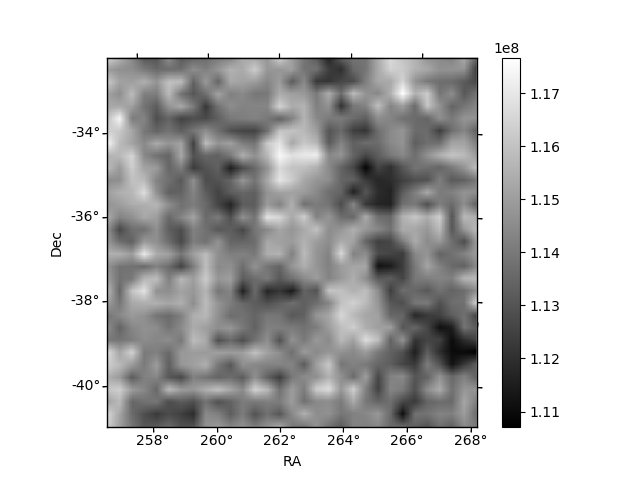
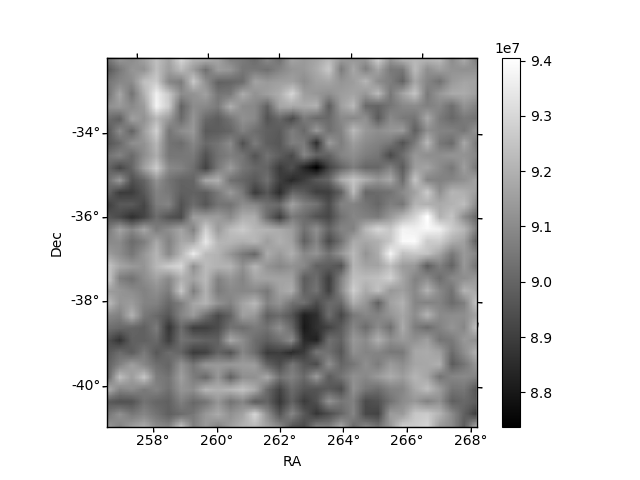
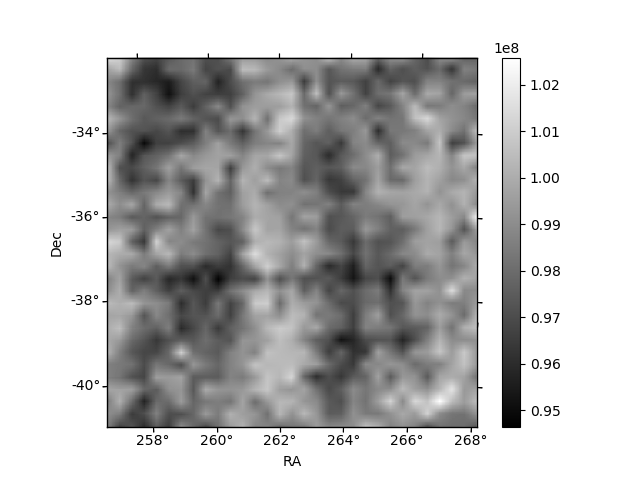
Histogram calculated using DETX and DETY for each event in the final _common_clean file
| Quadrant A | 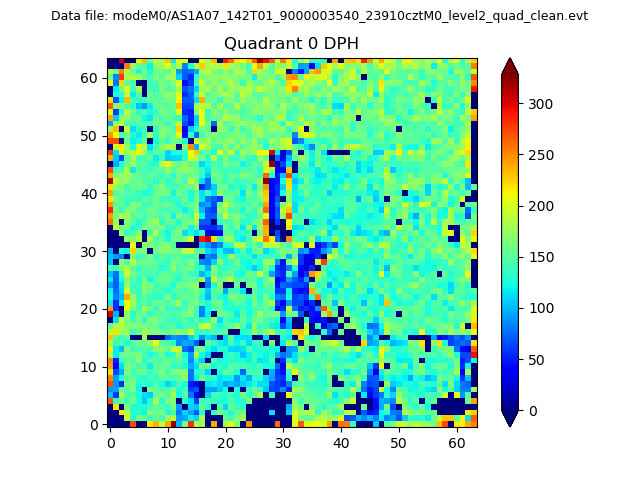 |
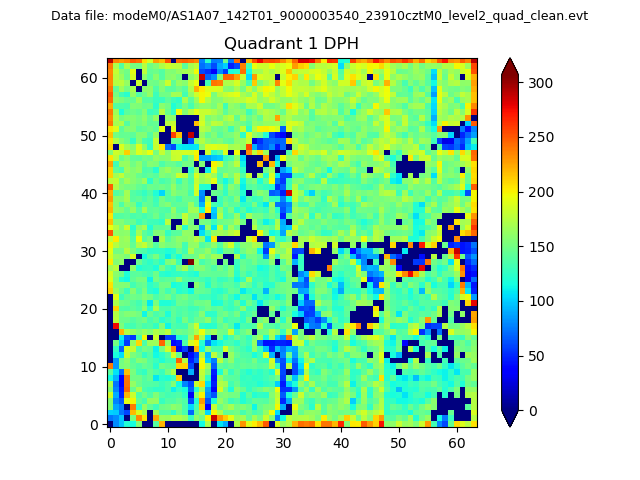 |
Quadrant B |
|---|---|---|---|
| Quadrant D | 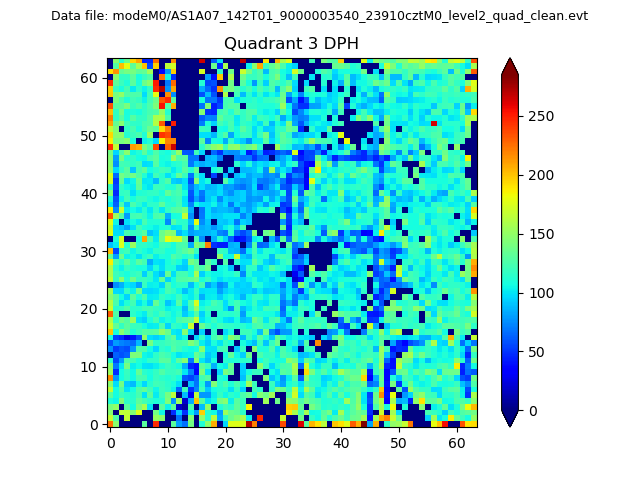 |
 |
Quadrant C |
| Plot type | Count rate plots | Images |
|---|---|---|
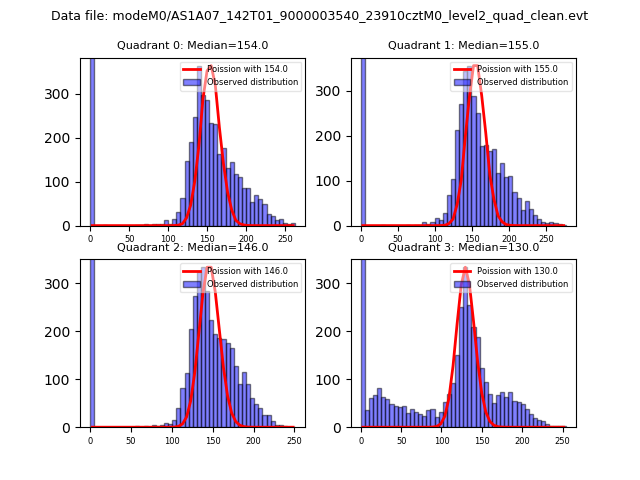
| Comparison with Poisson distribution Blue bars denote a histogram of data divided into 1 sec bins. Red curve is a Poisson curve with rate = median count rate of data. |
 |
 |
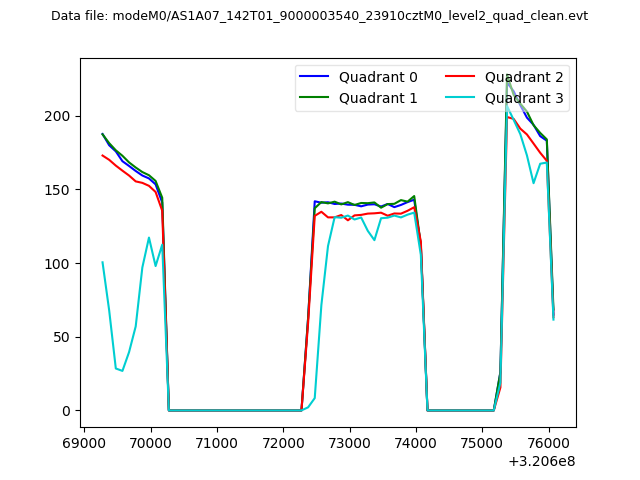
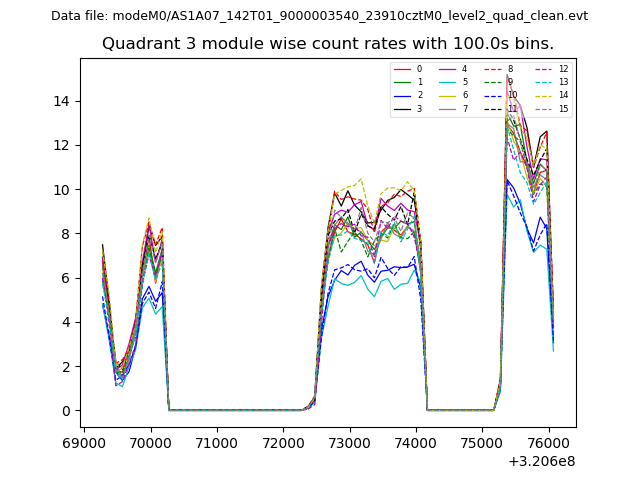
| Quadrant-wise count rates Data is divided into 100 sec bins |
 |
|
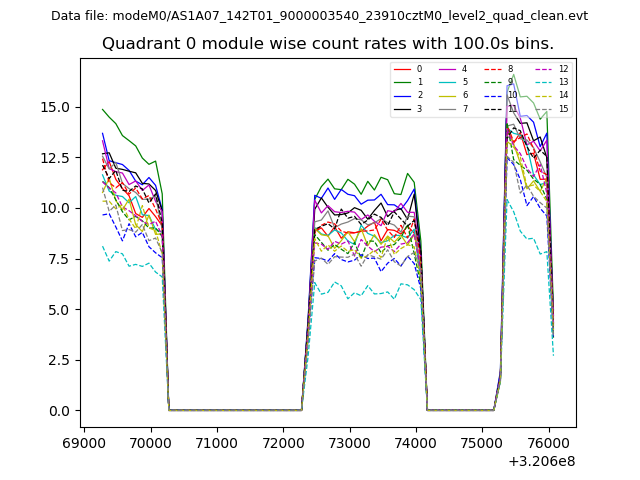
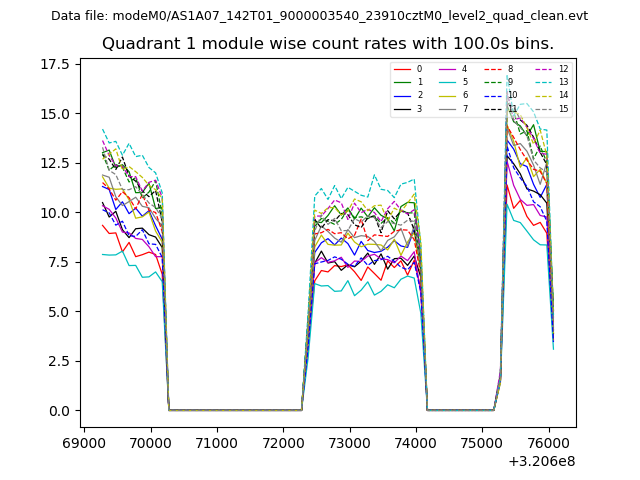
| Module-wise count rates for Quadrant A Data is divided into 100 sec bins |
 |
 |
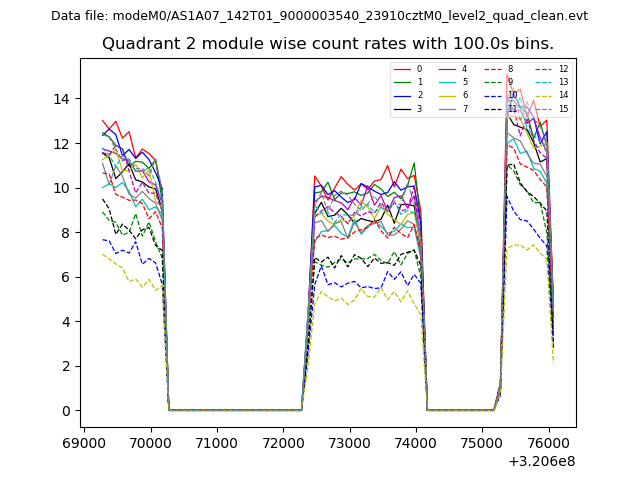
| Module-wise count rates for Quadrant B Data is divided into 100 sec bins |
 |
 |
| Module-wise count rates for Quadrant C Data is divided into 100 sec bins |
 |
 |
| Module-wise count rates for Quadrant D Data is divided into 100 sec bins |
 |
 |
| Parameter | Plot |
|---|---|
| CZT HV Monitor | 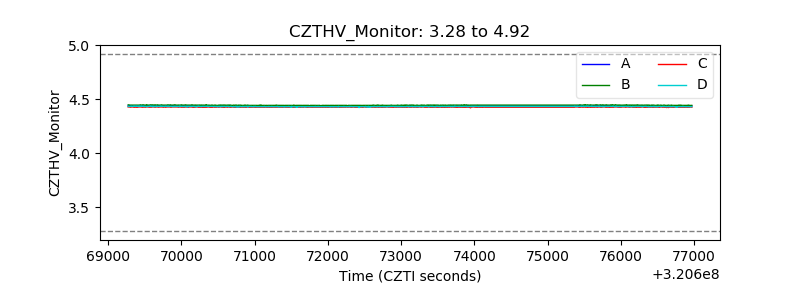 |
| D_VDD | 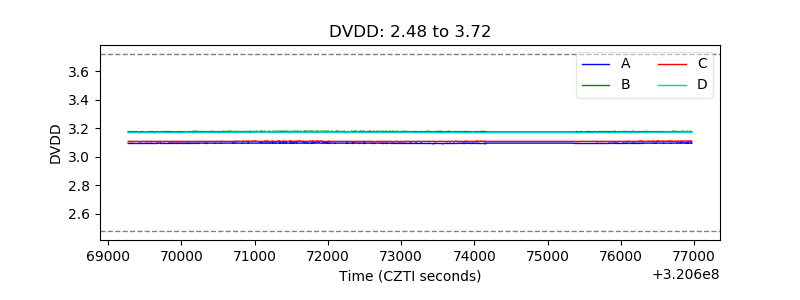 |
| Temperature 1 | 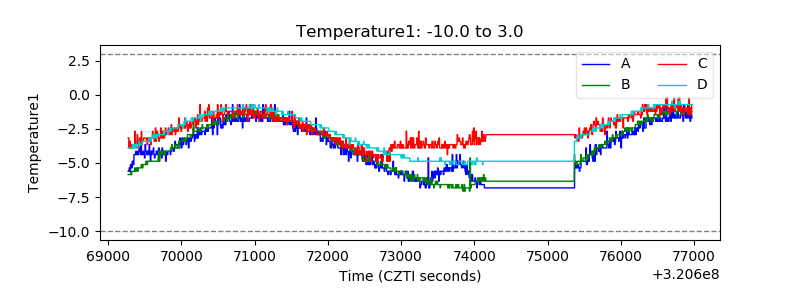 |
| Veto HV Monitor |  |
| Veto LLD | 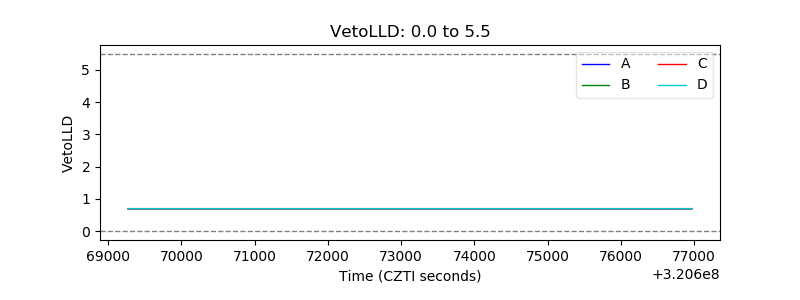 |
| Alpha Counter | 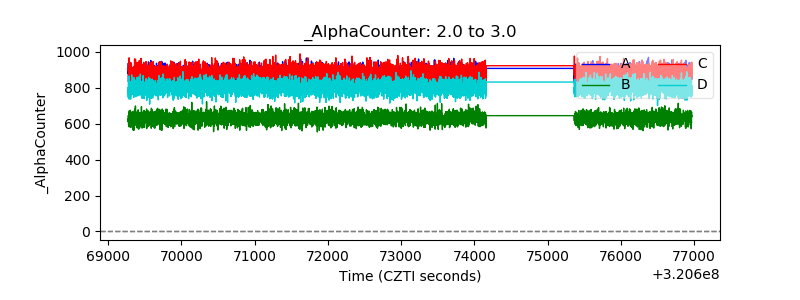 |
| _CPM_Rate | 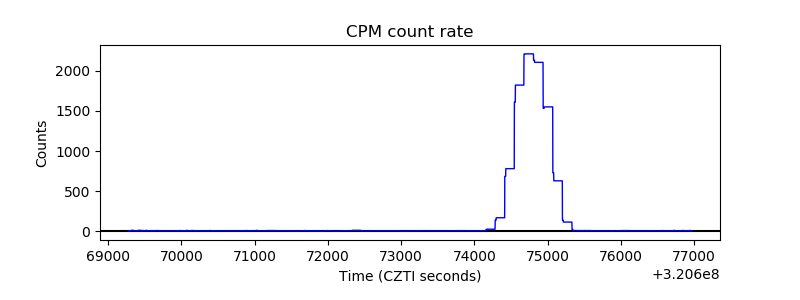 |
| CZT Counter | 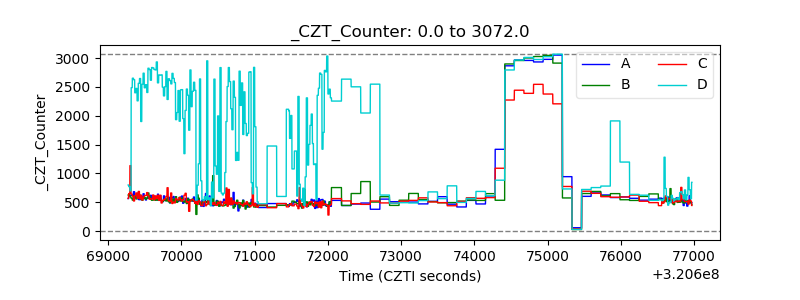 |
| +2.5 Volts monitor | 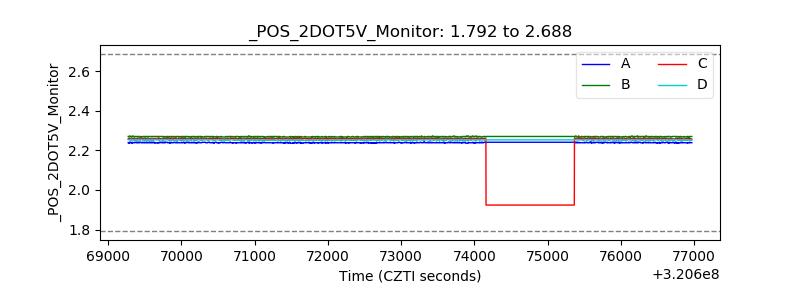 |
| +5 Volts monitor |  |
| _ROLL_ROT | 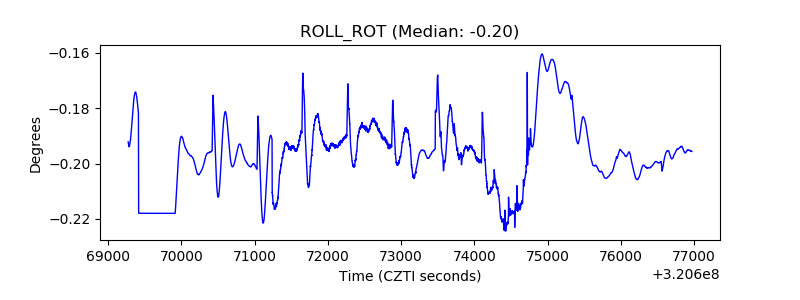 |
| _Roll_DEC | 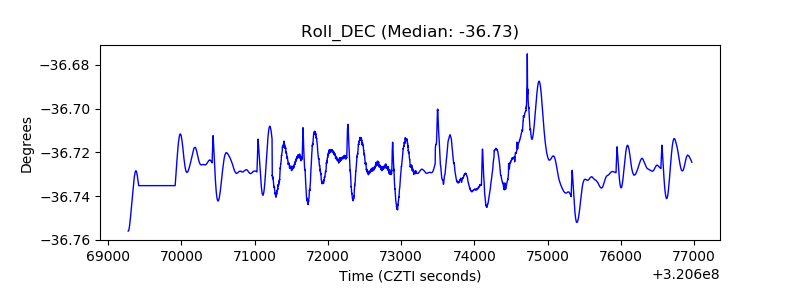 |
| _Roll_RA | 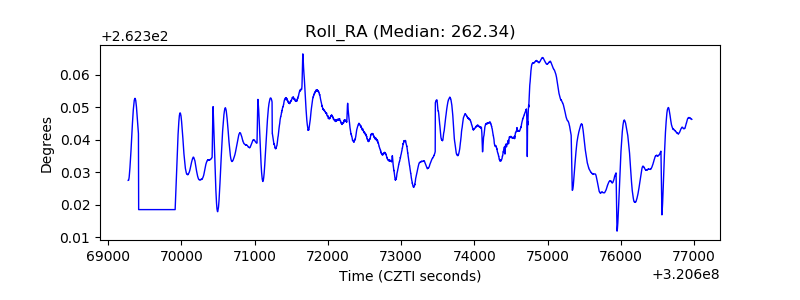 |
| Veto Counter | 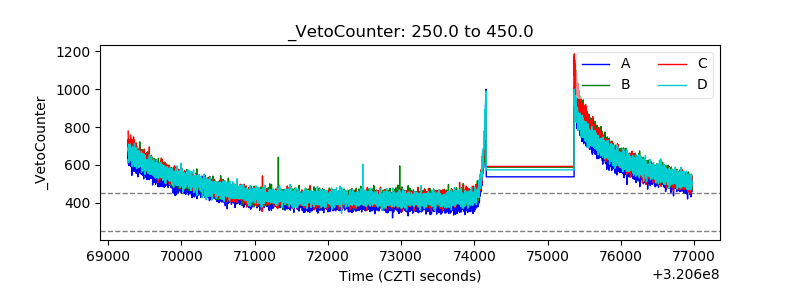 |