| Param | Original file | Final file |
|---|---|---|
| Filename | modeM0/AS1A07_142T01_9000003540_23911cztM0_level2.evt | modeM0/AS1A07_142T01_9000003540_23911cztM0_level2_quad_clean.evt |
| Size (bytes) | 575,187,840 | 81,187,200 |
| Size | 548.5 MB | 77.4 MB |
| Events in quadrant A | 3,631,009 | 522,571 |
| Events in quadrant B | 3,679,265 | 526,860 |
| Events in quadrant C | 3,626,451 | 487,435 |
| Events in quadrant D | 6,040,854 | 466,126 |
| Mode M9 | |||
|---|---|---|---|
| Quadrant | BADHDUFLAG | Total packets | Discarded packets |
| A | 0 | 13 | 0 |
| B | 0 | 13 | 0 |
| C | 0 | 13 | 0 |
| D | 0 | 13 | 0 |
| Mode M0 | |||
|---|---|---|---|
| Quadrant | BADHDUFLAG | Total packets | Discarded packets |
| A | 0 | 14894 | 1 |
| B | 0 | 14987 | 1 |
| C | 0 | 14782 | 1 |
| D | 0 | 22785 | 1 |
| Mode SS | |||
|---|---|---|---|
| Quadrant | BADHDUFLAG | Total packets | Discarded packets |
| A | 0 | 132 | 0 |
| B | 0 | 132 | 0 |
| C | 0 | 132 | 0 |
| D | 0 | 132 | 0 |
| Quadrant | Total seconds | Saturated seconds | Saturation percentage |
|---|---|---|---|
| A | 6529 | 96 | 1.470363% |
| B | 6529 | 97 | 1.485679% |
| C | 6529 | 143 | 2.190228% |
| D | 6529 | 502 | 7.688773% |
Noise dominated data is calculated using 1-second bins in cleaned event files. If a bin has >2000 counts, and if more than 50% of those come from <1% of pixels, then it is considered to be noise-dominated and hence unusable.
| Quadrant | # 1 sec bins | Bins with >0 counts | Bins with >2000 counts | High rate bins dominated by noise | Noise dominated (total time) | Noise dominated (detector-on time) | Marked lightcurve |
|---|---|---|---|---|---|---|---|
| A | 7804 | 6530 | 0 | 0 | 0.00% | 0.00% | 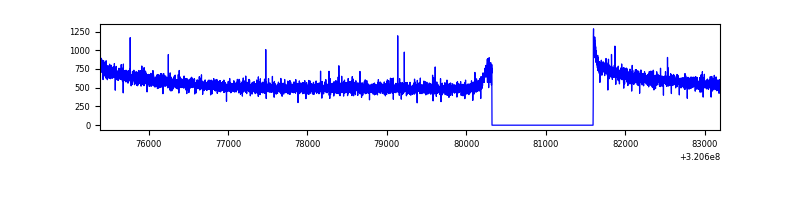 |
| B | 7804 | 6530 | 2 | 2 | 0.03% | 0.03% | 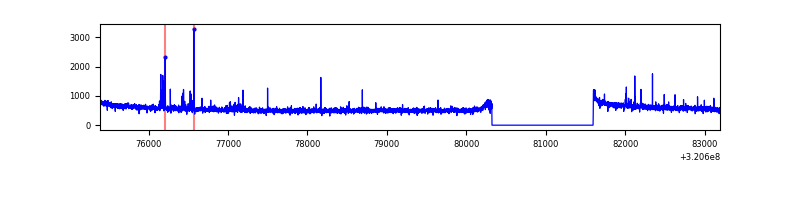 |
| C | 7804 | 6530 | 9 | 9 | 0.12% | 0.14% | 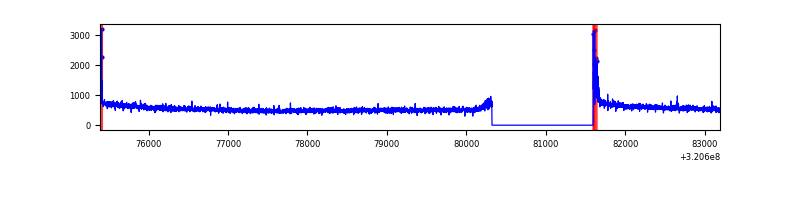 |
| D | 7804 | 6530 | 382 | 382 | 4.89% | 5.85% | 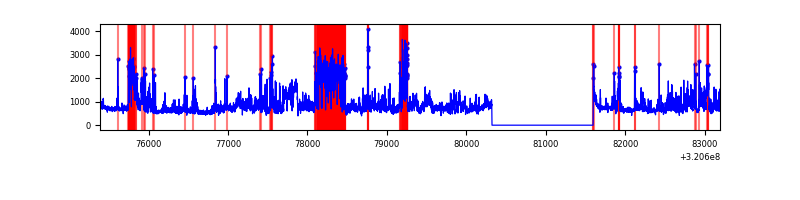 |
Top three noisy pixels from each quadrant. If the there are fewer than three noisy pixels in the level2.evt file, extra rows are filled as -1
| Pixel properties | Quadrant properties | ||||||
|---|---|---|---|---|---|---|---|
| Quadrant | DetID | PixID | Counts | Sigma | Mean | Median | Sigma |
| A | 13 | 254 | 11249 | 55.7 | 942 | 926 | 185.3 |
| A | 0 | 226 | 8397 | 40.31 | 942 | 926 | 185.3 |
| A | 3 | 137 | 7148 | 33.58 | 942 | 926 | 185.3 |
| B | 0 | 228 | 25243 | 142.95 | 922 | 905 | 170.3 |
| B | 12 | 111 | 19093 | 106.83 | 922 | 905 | 170.3 |
| B | 5 | 172 | 17742 | 98.89 | 922 | 905 | 170.3 |
| C | 14 | 238 | 141856 | 704.97 | 875 | 882 | 200.0 |
| C | 0 | 10 | 63040 | 310.83 | 875 | 882 | 200.0 |
| C | 7 | 247 | 7078 | 30.98 | 875 | 882 | 200.0 |
| D | 12 | 218 | 1593904 | 7489.57 | 890 | 865 | 212.7 |
| D | 8 | 195 | 862643 | 4051.59 | 890 | 865 | 212.7 |
| D | 1 | 52 | 86495 | 402.58 | 890 | 865 | 212.7 |
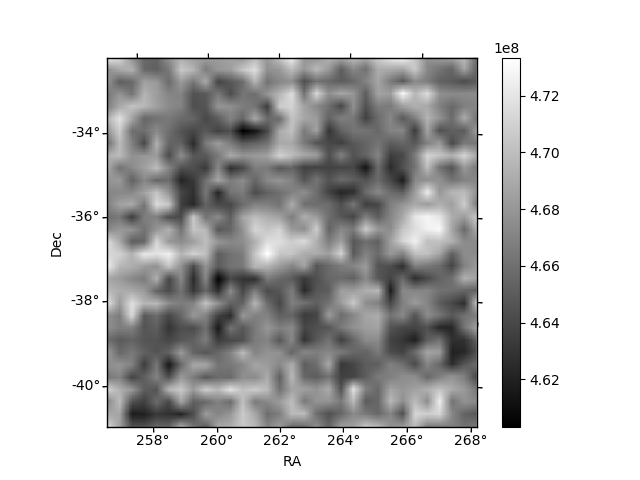
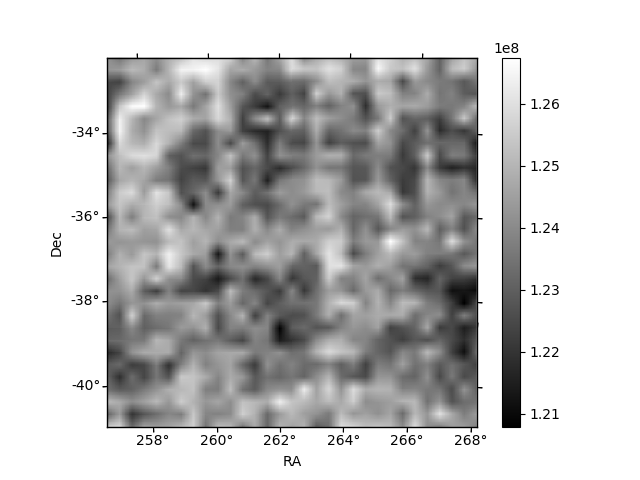
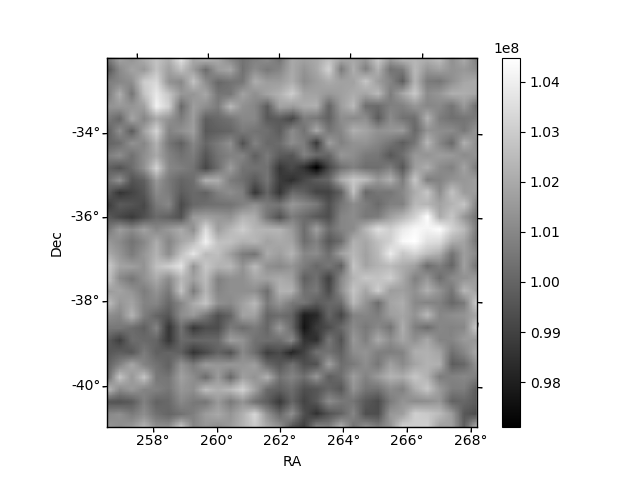
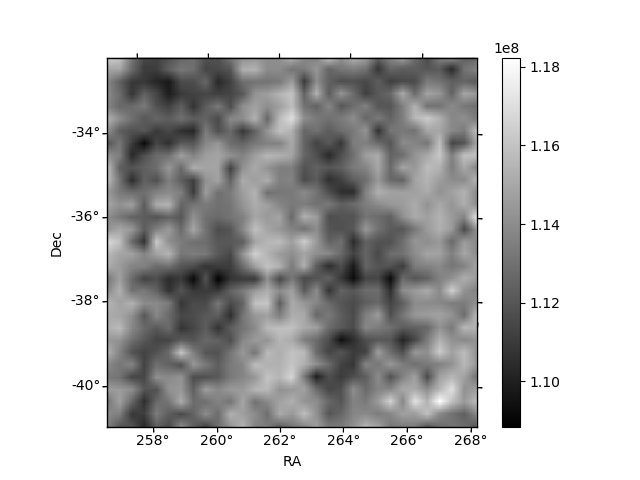
Histogram calculated using DETX and DETY for each event in the final _common_clean file
| Quadrant A | 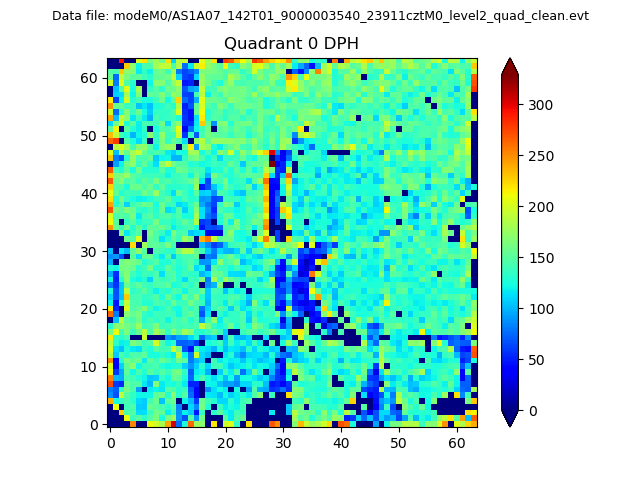 |
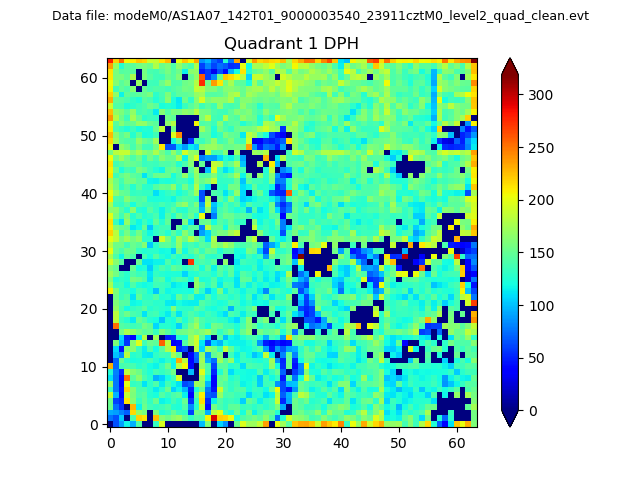 |
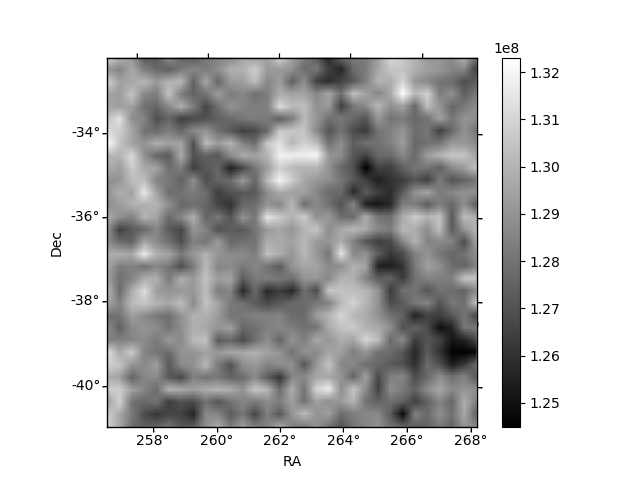
Quadrant B |
|---|---|---|---|
| Quadrant D | 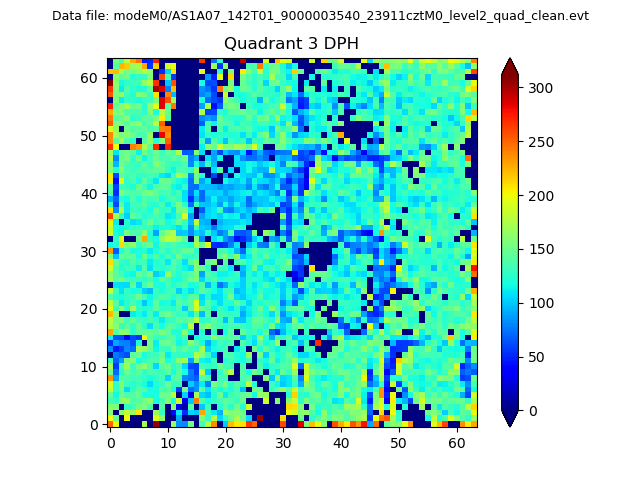 |
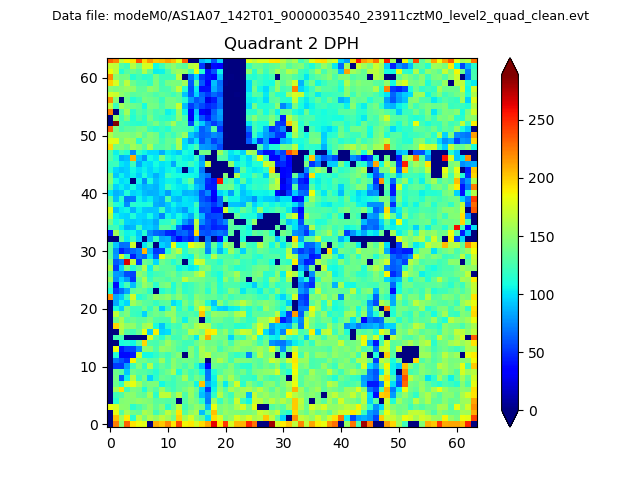 |
Quadrant C |
| Plot type | Count rate plots | Images |
|---|---|---|
| Comparison with Poisson distribution Blue bars denote a histogram of data divided into 1 sec bins. Red curve is a Poisson curve with rate = median count rate of data. |
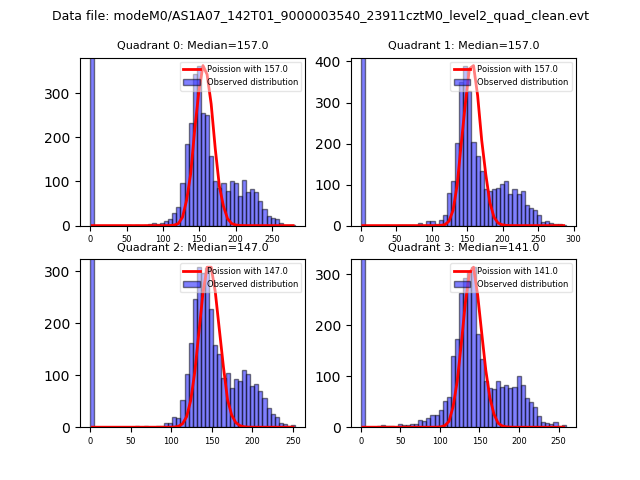 |
 |
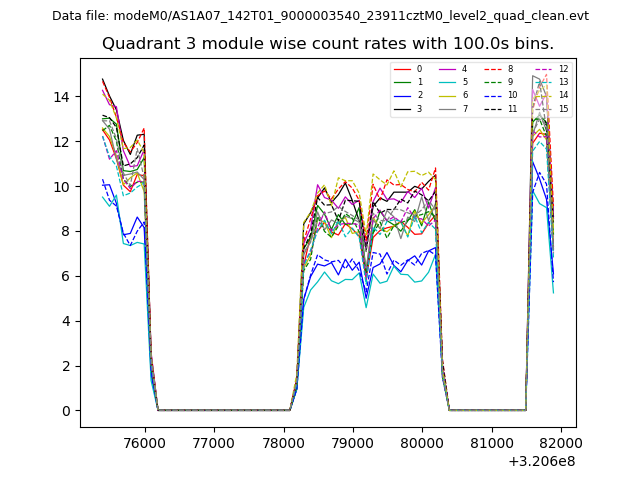
| Quadrant-wise count rates Data is divided into 100 sec bins |
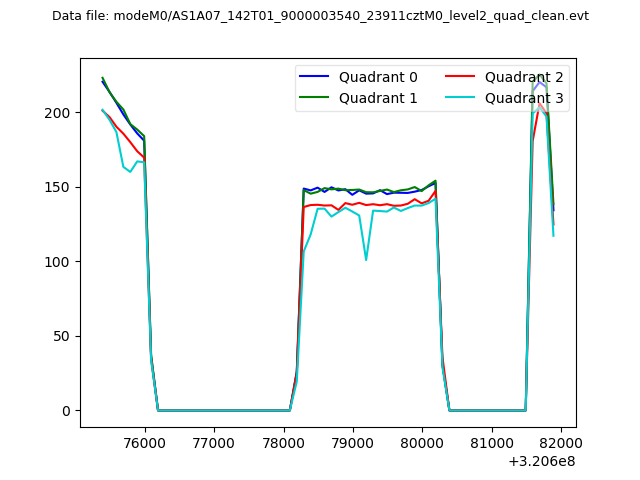 |
|
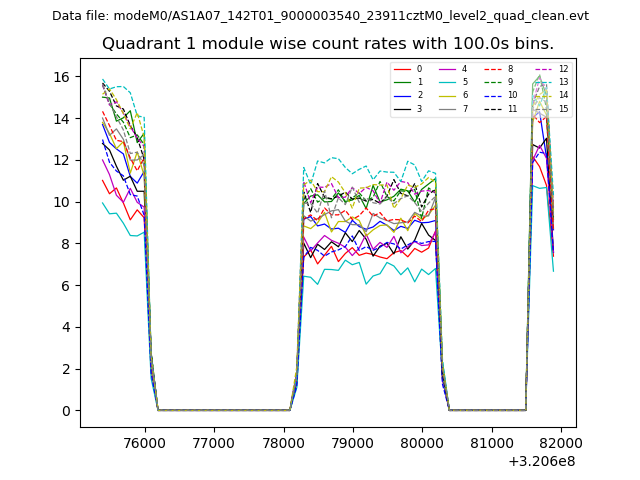
| Module-wise count rates for Quadrant A Data is divided into 100 sec bins |
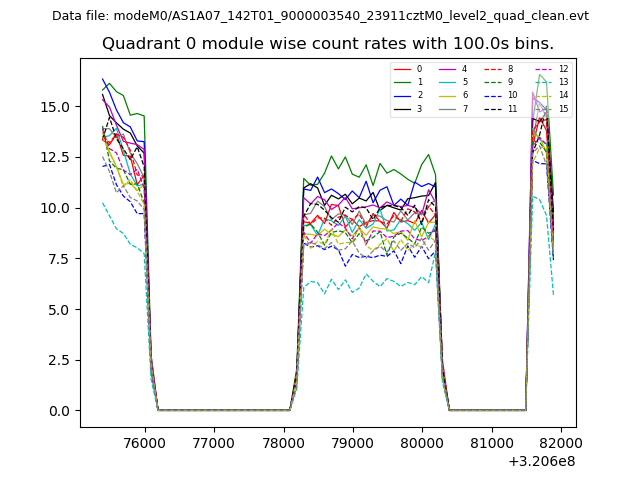 |
 |
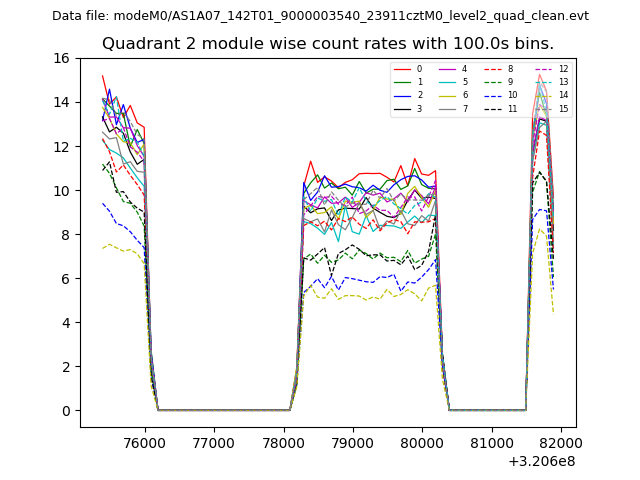
| Module-wise count rates for Quadrant B Data is divided into 100 sec bins |
 |
 |
| Module-wise count rates for Quadrant C Data is divided into 100 sec bins |
 |
 |
| Module-wise count rates for Quadrant D Data is divided into 100 sec bins |
 |
 |
| Parameter | Plot |
|---|---|
| CZT HV Monitor | 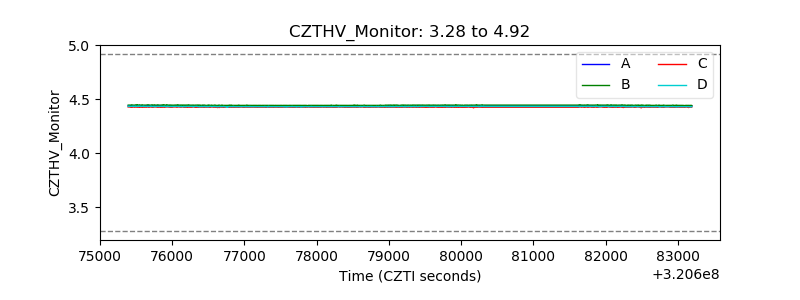 |
| D_VDD | 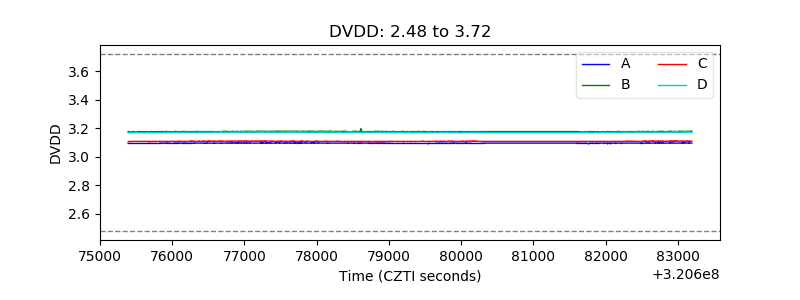 |
| Temperature 1 | 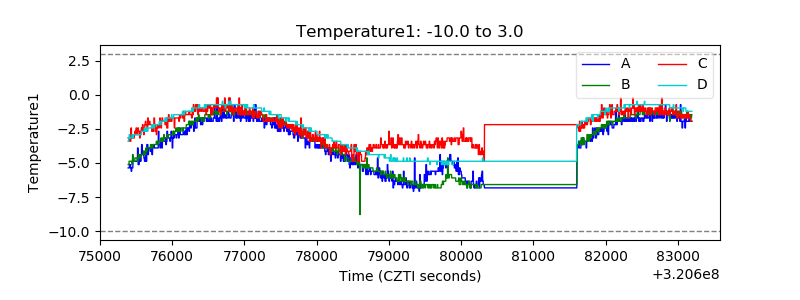 |
| Veto HV Monitor | 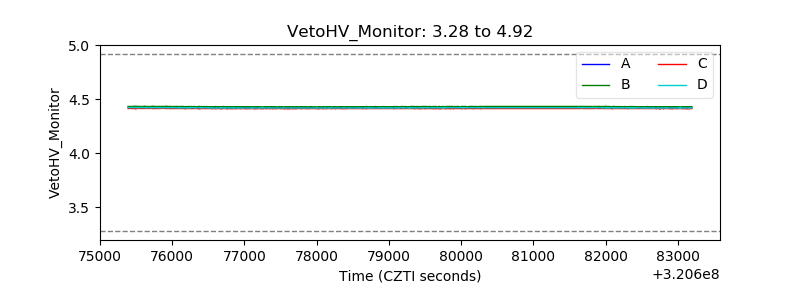 |
| Veto LLD | 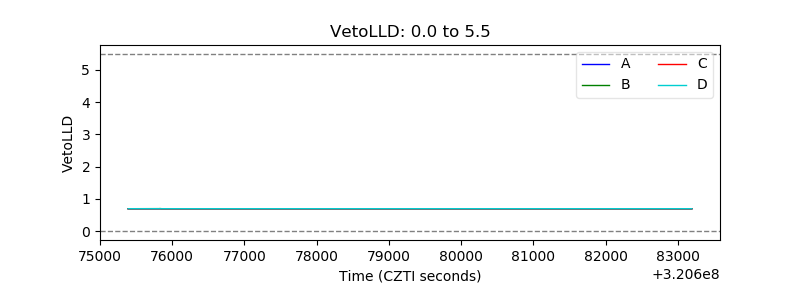 |
| Alpha Counter | 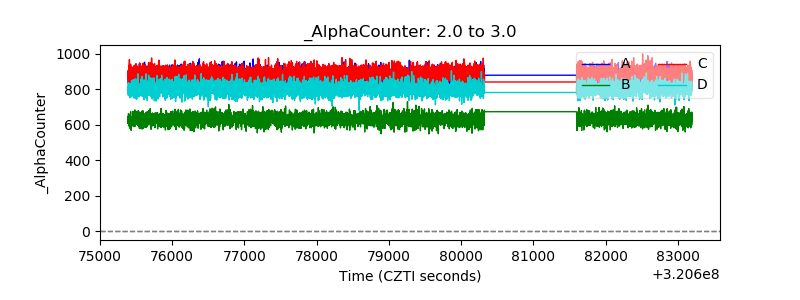 |
| _CPM_Rate | 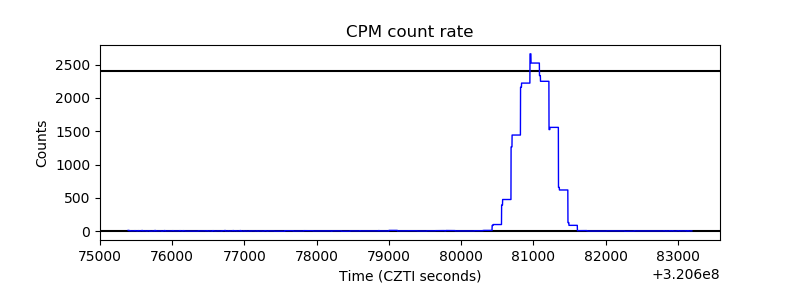 |
| CZT Counter | 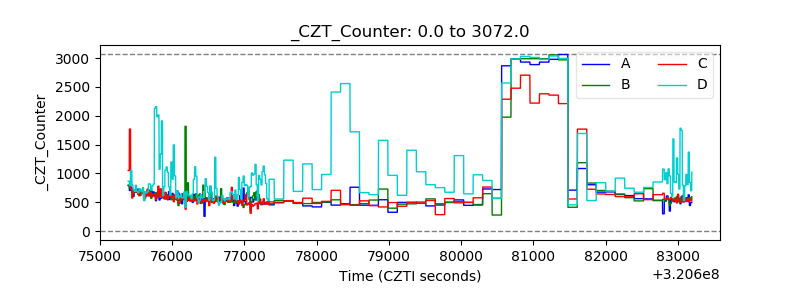 |
| +2.5 Volts monitor | 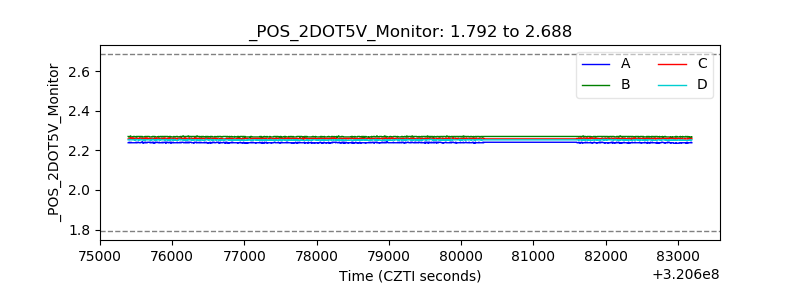 |
| +5 Volts monitor |  |
| _ROLL_ROT | 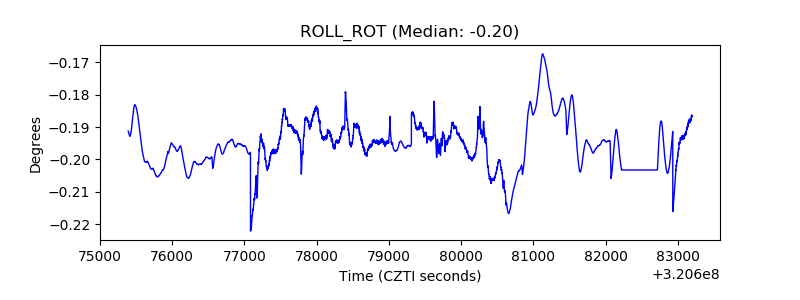 |
| _Roll_DEC | 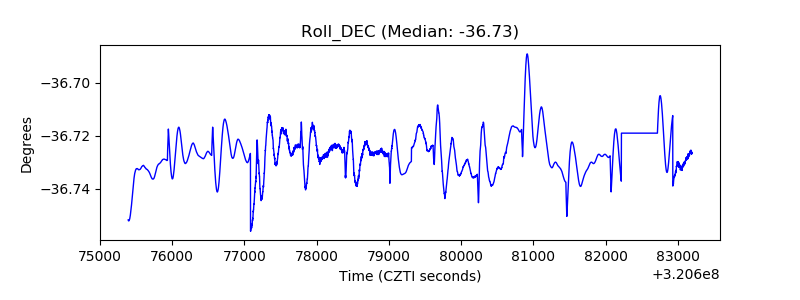 |
| _Roll_RA | 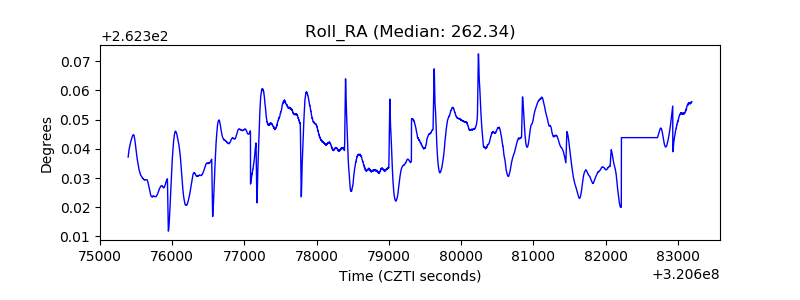 |
| Veto Counter | 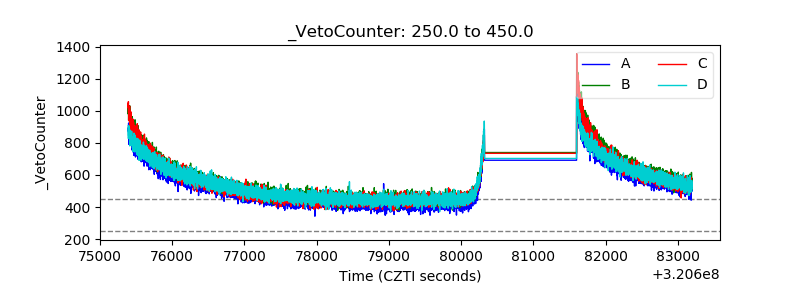 |