| Param | Original file | Final file |
|---|---|---|
| Filename | modeM0/AS1A07_142T01_9000003540_23914cztM0_level2.evt | modeM0/AS1A07_142T01_9000003540_23914cztM0_level2_quad_clean.evt |
| Size (bytes) | 500,693,760 | 78,327,360 |
| Size | 477.5 MB | 74.7 MB |
| Events in quadrant A | 3,335,935 | 497,327 |
| Events in quadrant B | 3,541,121 | 502,946 |
| Events in quadrant C | 3,429,371 | 468,857 |
| Events in quadrant D | 4,426,354 | 459,738 |
| Mode M9 | |||
|---|---|---|---|
| Quadrant | BADHDUFLAG | Total packets | Discarded packets |
| A | 0 | 15 | 0 |
| B | 0 | 16 | 0 |
| C | 0 | 16 | 0 |
| D | 0 | 16 | 0 |
| Mode M0 | |||
|---|---|---|---|
| Quadrant | BADHDUFLAG | Total packets | Discarded packets |
| A | 0 | 13730 | 2 |
| B | 0 | 14389 | 2 |
| C | 0 | 13886 | 2 |
| D | 0 | 17582 | 2 |
| Mode SS | |||
|---|---|---|---|
| Quadrant | BADHDUFLAG | Total packets | Discarded packets |
| A | 0 | 130 | 0 |
| B | 0 | 130 | 0 |
| C | 0 | 130 | 0 |
| D | 0 | 130 | 0 |
| Quadrant | Total seconds | Saturated seconds | Saturation percentage |
|---|---|---|---|
| A | 6345 | 115 | 1.812451% |
| B | 6345 | 155 | 2.442868% |
| C | 6345 | 195 | 3.073286% |
| D | 6345 | 125 | 1.970055% |
Noise dominated data is calculated using 1-second bins in cleaned event files. If a bin has >2000 counts, and if more than 50% of those come from <1% of pixels, then it is considered to be noise-dominated and hence unusable.
| Quadrant | # 1 sec bins | Bins with >0 counts | Bins with >2000 counts | High rate bins dominated by noise | Noise dominated (total time) | Noise dominated (detector-on time) | Marked lightcurve |
|---|---|---|---|---|---|---|---|
| A | 7485 | 6346 | 0 | 0 | 0.00% | 0.00% | 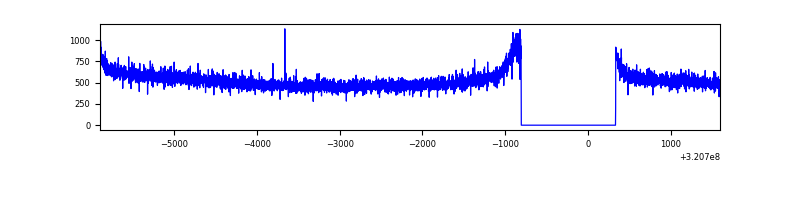 |
| B | 7485 | 6346 | 4 | 4 | 0.05% | 0.06% | 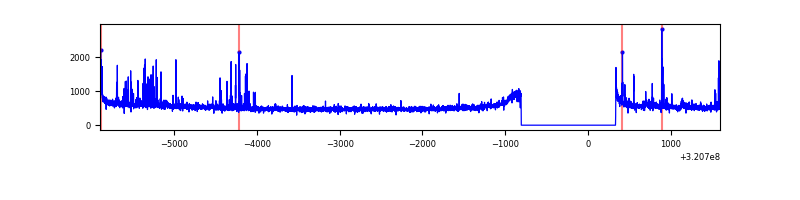 |
| C | 7485 | 6346 | 11 | 11 | 0.15% | 0.17% | 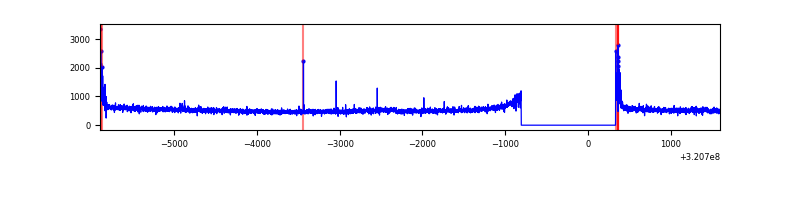 |
| D | 7485 | 6346 | 25 | 25 | 0.33% | 0.39% | 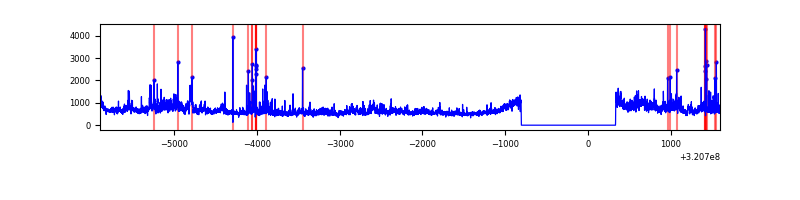 |
Top three noisy pixels from each quadrant. If the there are fewer than three noisy pixels in the level2.evt file, extra rows are filled as -1
| Pixel properties | Quadrant properties | ||||||
|---|---|---|---|---|---|---|---|
| Quadrant | DetID | PixID | Counts | Sigma | Mean | Median | Sigma |
| A | 13 | 254 | 10491 | 56.12 | 865 | 850 | 171.8 |
| A | 0 | 226 | 7683 | 39.77 | 865 | 850 | 171.8 |
| A | 3 | 137 | 7035 | 36.0 | 865 | 850 | 171.8 |
| B | 15 | 33 | 154111 | 962.04 | 857 | 840 | 159.3 |
| B | 12 | 111 | 17951 | 107.4 | 857 | 840 | 159.3 |
| B | 11 | 111 | 15837 | 94.13 | 857 | 840 | 159.3 |
| C | 14 | 238 | 130045 | 696.28 | 807 | 815 | 185.6 |
| C | 0 | 10 | 100211 | 535.54 | 807 | 815 | 185.6 |
| C | 7 | 247 | 53729 | 285.1 | 807 | 815 | 185.6 |
| D | 8 | 195 | 920503 | 4602.58 | 827 | 805 | 199.8 |
| D | 1 | 52 | 187592 | 934.76 | 827 | 805 | 199.8 |
| D | 12 | 218 | 104058 | 516.72 | 827 | 805 | 199.8 |
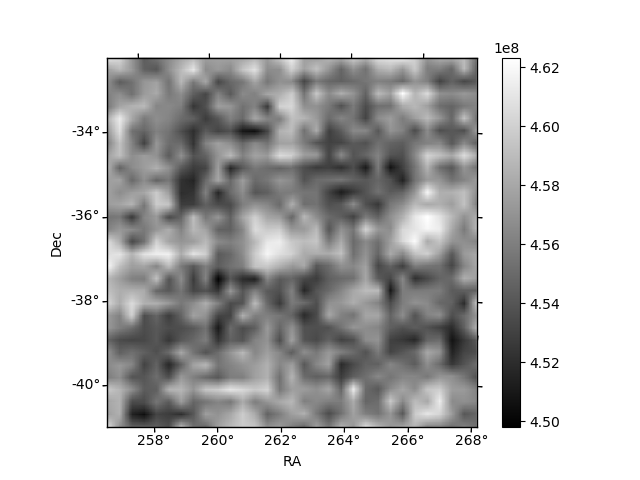
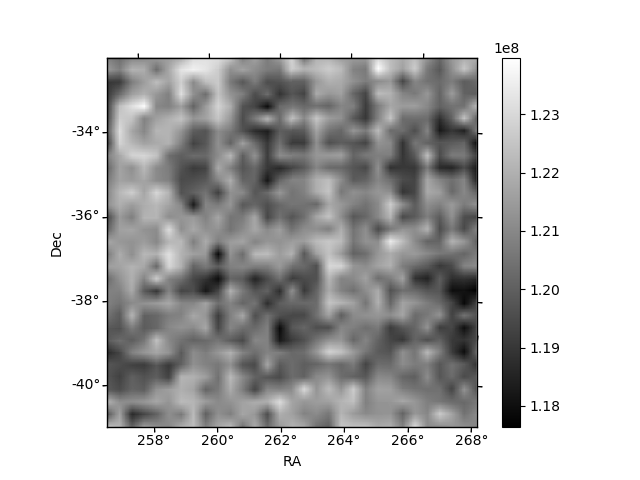
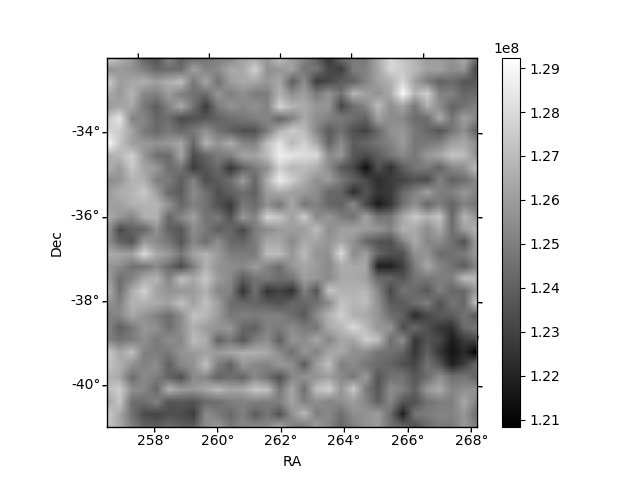
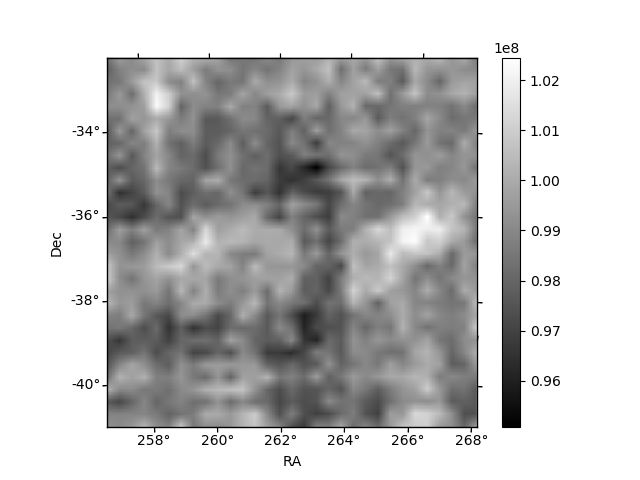
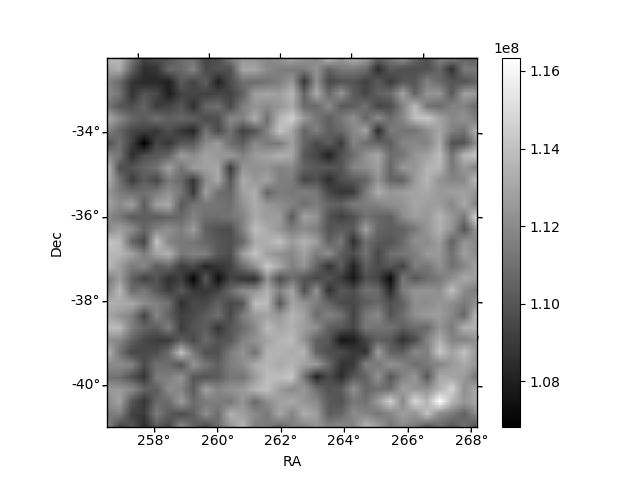
Histogram calculated using DETX and DETY for each event in the final _common_clean file
| Quadrant A | 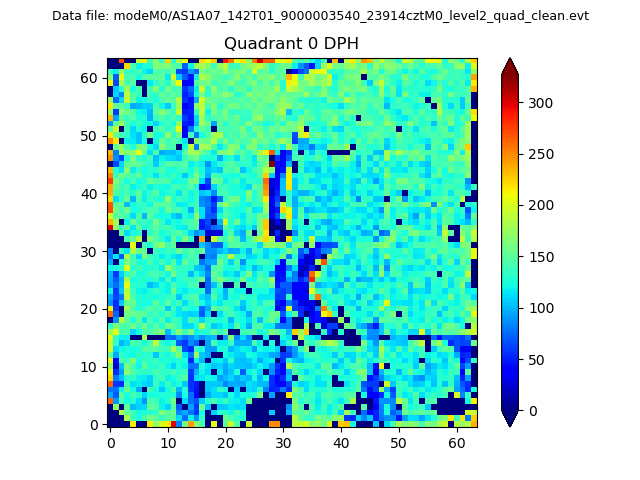 |
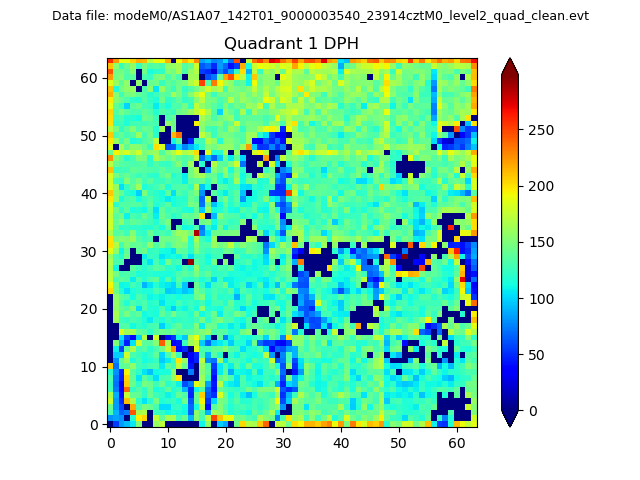 |
Quadrant B |
|---|---|---|---|
| Quadrant D |  |
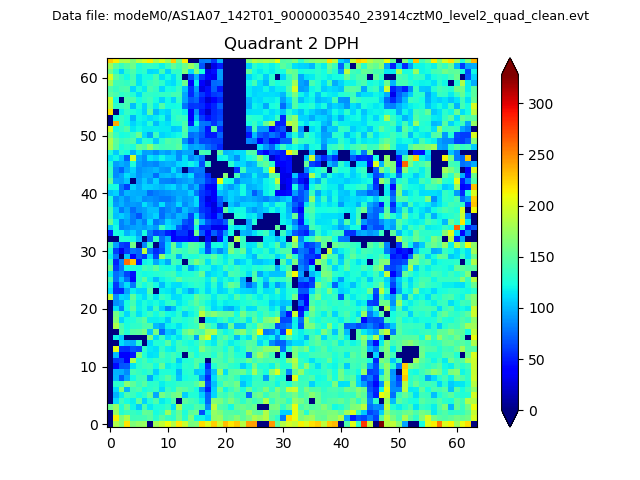 |
Quadrant C |
| Plot type | Count rate plots | Images |
|---|---|---|
| Comparison with Poisson distribution Blue bars denote a histogram of data divided into 1 sec bins. Red curve is a Poisson curve with rate = median count rate of data. |
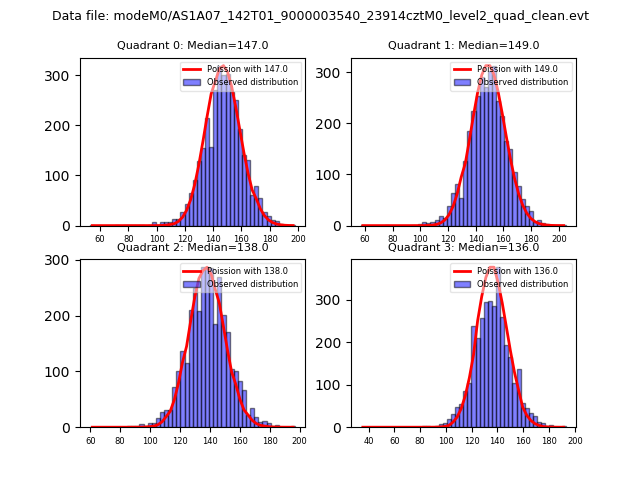 |
 |
| Quadrant-wise count rates Data is divided into 100 sec bins |
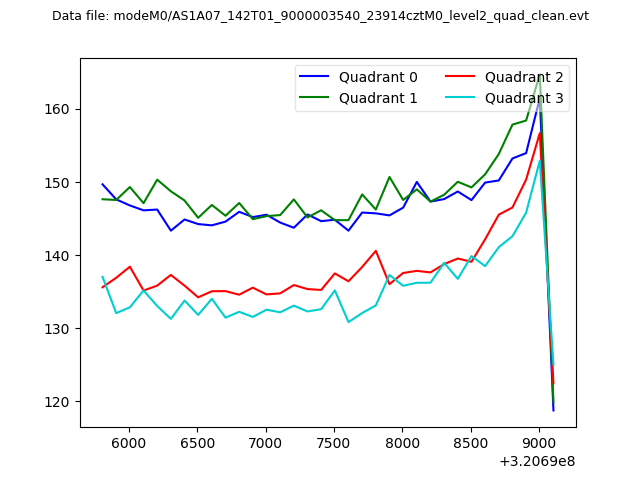 |
|
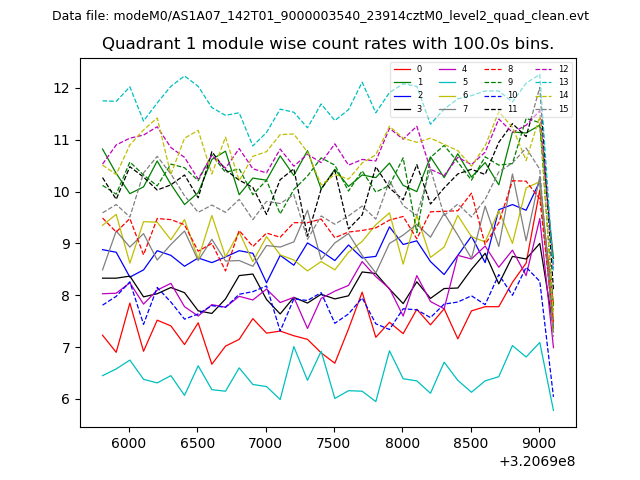
| Module-wise count rates for Quadrant A Data is divided into 100 sec bins |
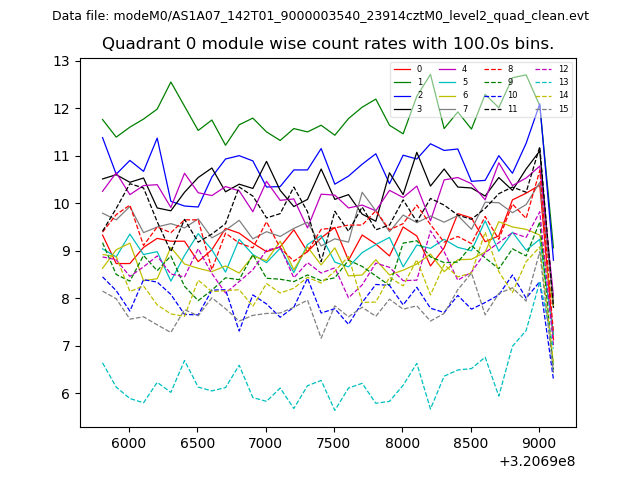 |
 |
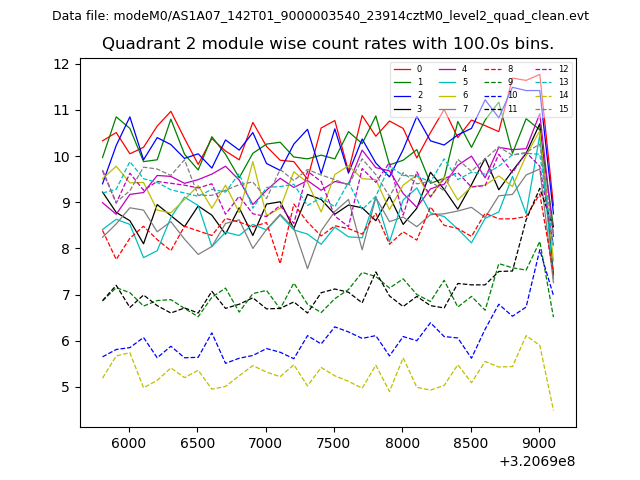
| Module-wise count rates for Quadrant B Data is divided into 100 sec bins |
 |
 |
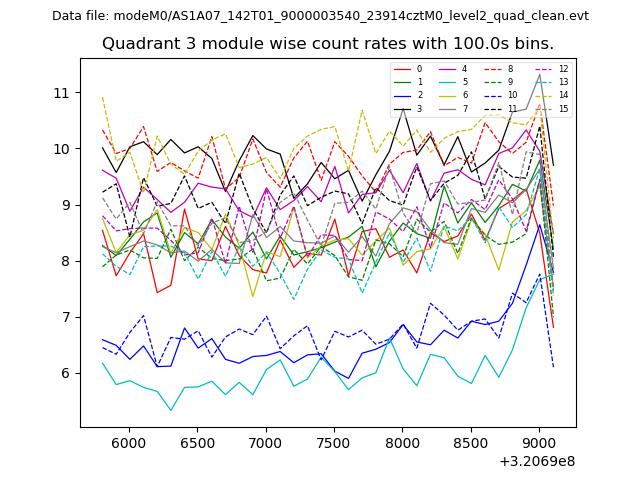
| Module-wise count rates for Quadrant C Data is divided into 100 sec bins |
 |
 |
| Module-wise count rates for Quadrant D Data is divided into 100 sec bins |
 |
 |
| Parameter | Plot |
|---|---|
| CZT HV Monitor | 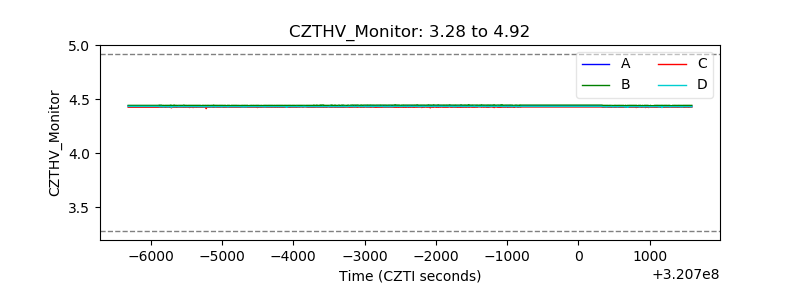 |
| D_VDD | 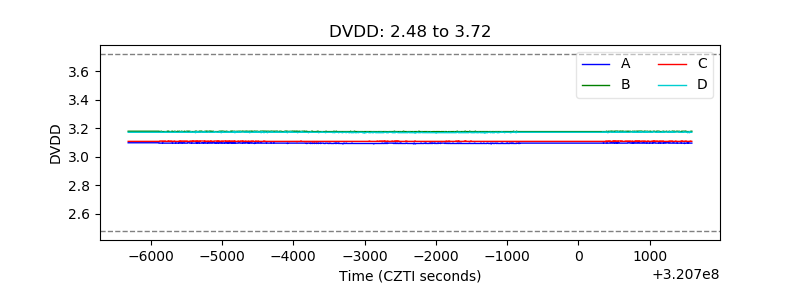 |
| Temperature 1 | 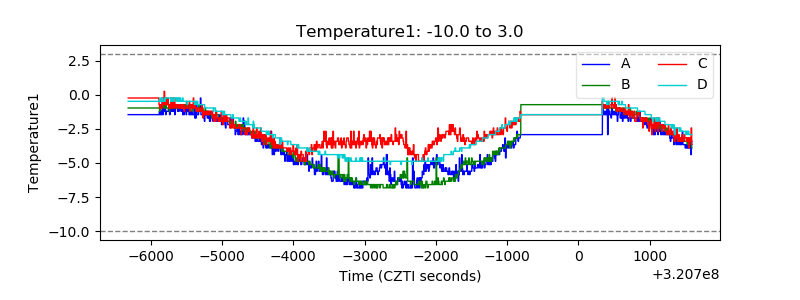 |
| Veto HV Monitor | 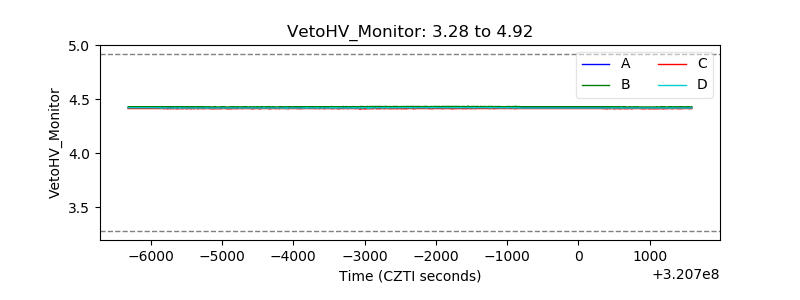 |
| Veto LLD | 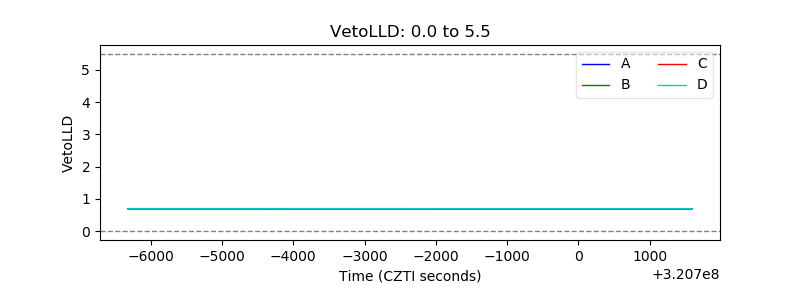 |
| Alpha Counter |  |
| _CPM_Rate | 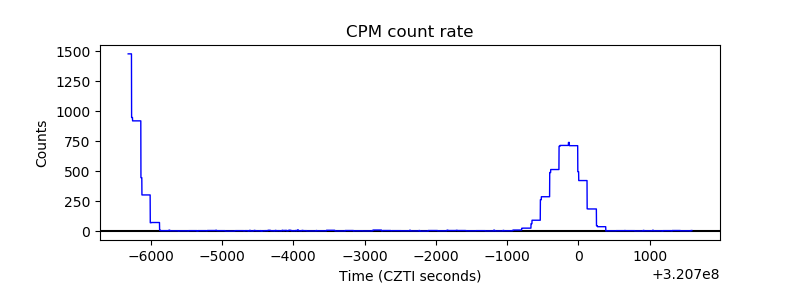 |
| CZT Counter | 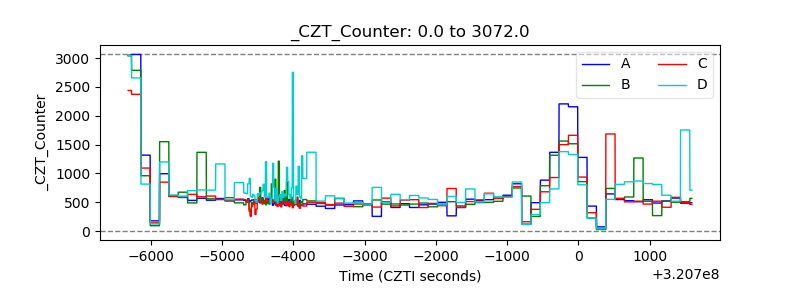 |
| +2.5 Volts monitor |  |
| +5 Volts monitor |  |
| _ROLL_ROT | 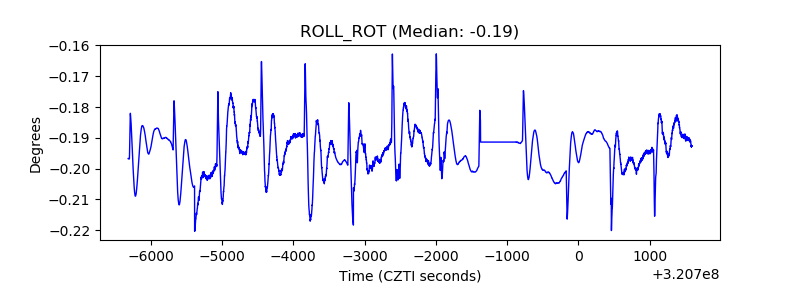 |
| _Roll_DEC | 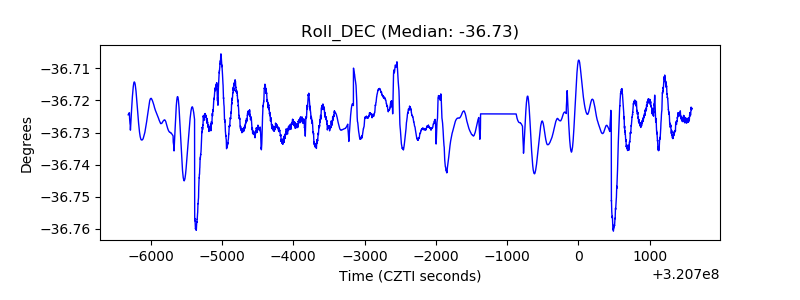 |
| _Roll_RA |  |
| Veto Counter | 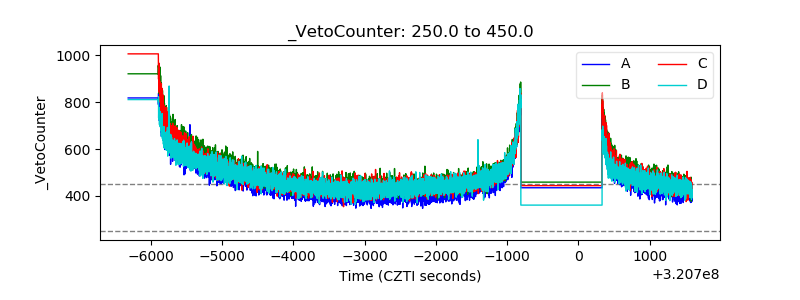 |