| Param | Original file | Final file |
|---|---|---|
| Filename | modeM0/AS1A07_142T01_9000003540_23915cztM0_level2.evt | modeM0/AS1A07_142T01_9000003540_23915cztM0_level2_quad_clean.evt |
| Size (bytes) | 545,880,960 | 89,838,720 |
| Size | 520.6 MB | 85.7 MB |
| Events in quadrant A | 3,407,210 | 576,227 |
| Events in quadrant B | 3,535,804 | 582,422 |
| Events in quadrant C | 3,809,158 | 548,019 |
| Events in quadrant D | 5,314,731 | 535,803 |
| Mode M9 | |||
|---|---|---|---|
| Quadrant | BADHDUFLAG | Total packets | Discarded packets |
| A | 0 | 19 | 0 |
| B | 0 | 19 | 0 |
| C | 0 | 19 | 0 |
| D | 0 | 19 | 0 |
| Mode M0 | |||
|---|---|---|---|
| Quadrant | BADHDUFLAG | Total packets | Discarded packets |
| A | 0 | 14339 | 2 |
| B | 0 | 14651 | 2 |
| C | 0 | 15423 | 2 |
| D | 0 | 20539 | 2 |
| Mode SS | |||
|---|---|---|---|
| Quadrant | BADHDUFLAG | Total packets | Discarded packets |
| A | 0 | 142 | 0 |
| B | 0 | 142 | 0 |
| C | 0 | 142 | 0 |
| D | 0 | 142 | 0 |
| Quadrant | Total seconds | Saturated seconds | Saturation percentage |
|---|---|---|---|
| A | 6859 | 121 | 1.764106% |
| B | 6859 | 155 | 2.259805% |
| C | 6859 | 208 | 3.032512% |
| D | 6859 | 289 | 4.213442% |
Noise dominated data is calculated using 1-second bins in cleaned event files. If a bin has >2000 counts, and if more than 50% of those come from <1% of pixels, then it is considered to be noise-dominated and hence unusable.
| Quadrant | # 1 sec bins | Bins with >0 counts | Bins with >2000 counts | High rate bins dominated by noise | Noise dominated (total time) | Noise dominated (detector-on time) | Marked lightcurve |
|---|---|---|---|---|---|---|---|
| A | 8825 | 6861 | 0 | 0 | 0.00% | 0.00% | 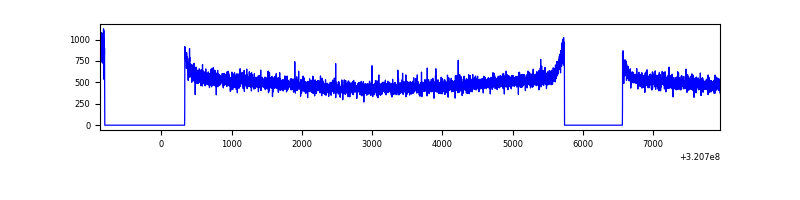 |
| B | 8825 | 6861 | 5 | 5 | 0.06% | 0.07% | 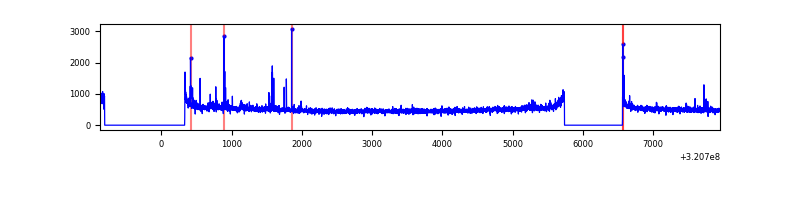 |
| C | 8825 | 6861 | 27 | 27 | 0.31% | 0.39% | 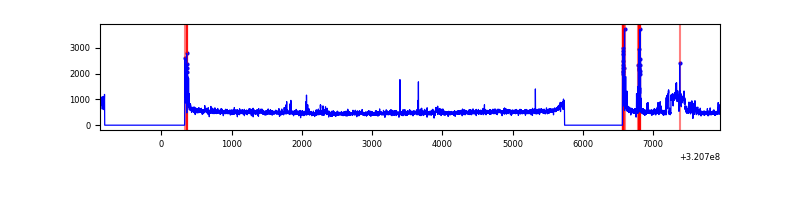 |
| D | 8825 | 6861 | 135 | 135 | 1.53% | 1.97% | 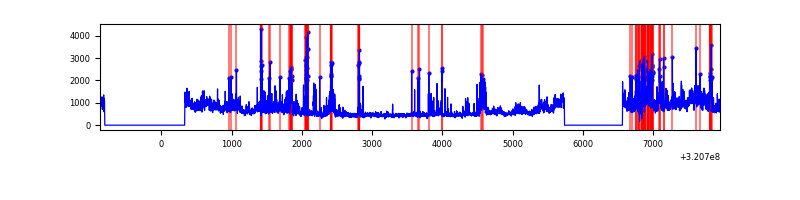 |
Top three noisy pixels from each quadrant. If the there are fewer than three noisy pixels in the level2.evt file, extra rows are filled as -1
| Pixel properties | Quadrant properties | ||||||
|---|---|---|---|---|---|---|---|
| Quadrant | DetID | PixID | Counts | Sigma | Mean | Median | Sigma |
| A | 13 | 254 | 12216 | 64.27 | 883 | 866 | 176.6 |
| A | 0 | 226 | 7821 | 39.38 | 883 | 866 | 176.6 |
| A | 3 | 137 | 7530 | 37.73 | 883 | 866 | 176.6 |
| B | 15 | 33 | 52692 | 309.9 | 878 | 858 | 167.3 |
| B | 12 | 111 | 19195 | 109.63 | 878 | 858 | 167.3 |
| B | 11 | 111 | 16812 | 95.38 | 878 | 858 | 167.3 |
| C | 10 | 9 | 225235 | 1157.65 | 830 | 835 | 193.8 |
| C | 0 | 10 | 147296 | 755.58 | 830 | 835 | 193.8 |
| C | 14 | 238 | 129970 | 666.19 | 830 | 835 | 193.8 |
| D | 8 | 195 | 1023496 | 4954.22 | 845 | 820 | 206.4 |
| D | 1 | 52 | 709319 | 3432.23 | 845 | 820 | 206.4 |
| D | 12 | 218 | 277015 | 1337.99 | 845 | 820 | 206.4 |
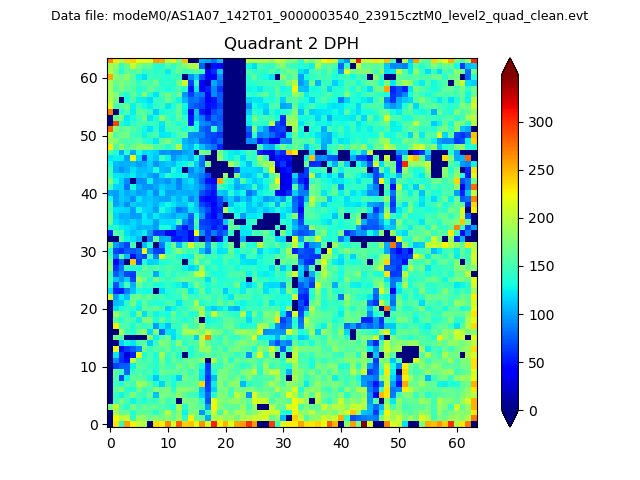
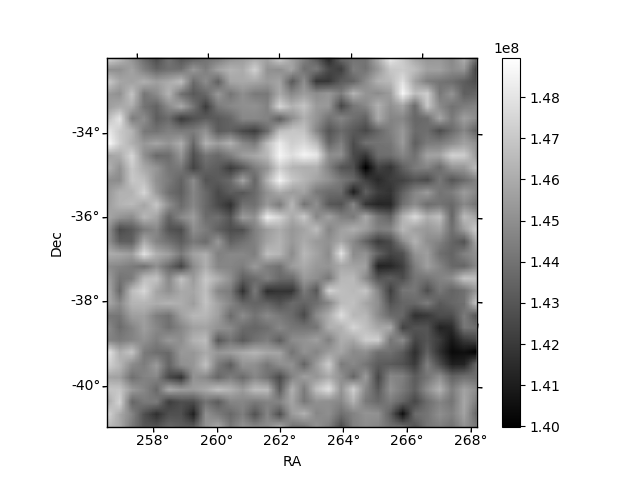
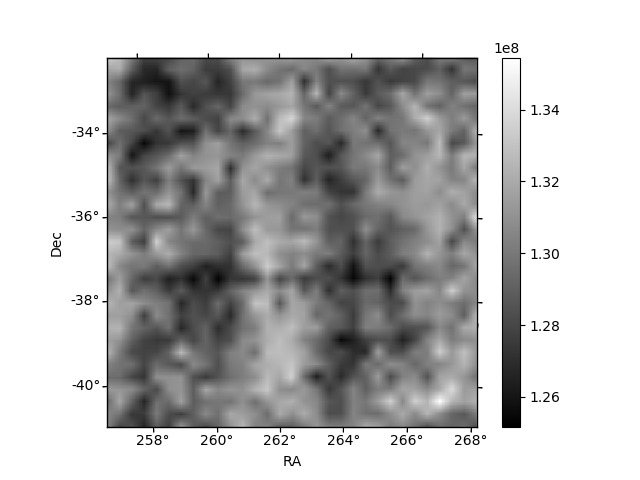
Histogram calculated using DETX and DETY for each event in the final _common_clean file
| Quadrant A | 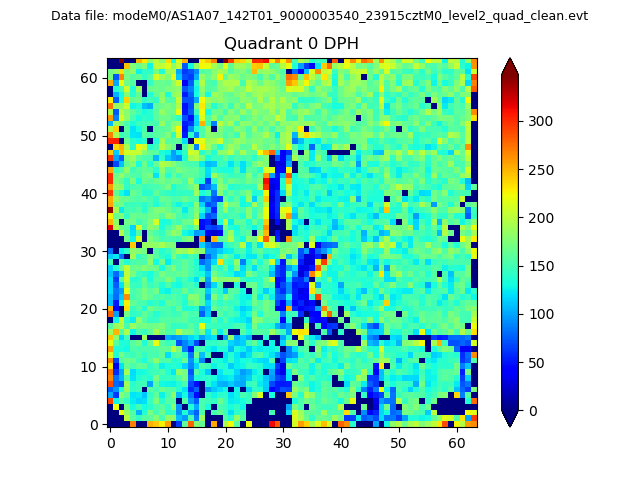 |
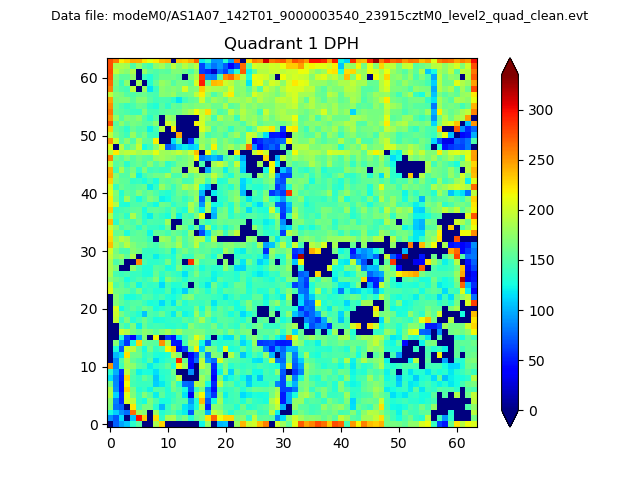 |
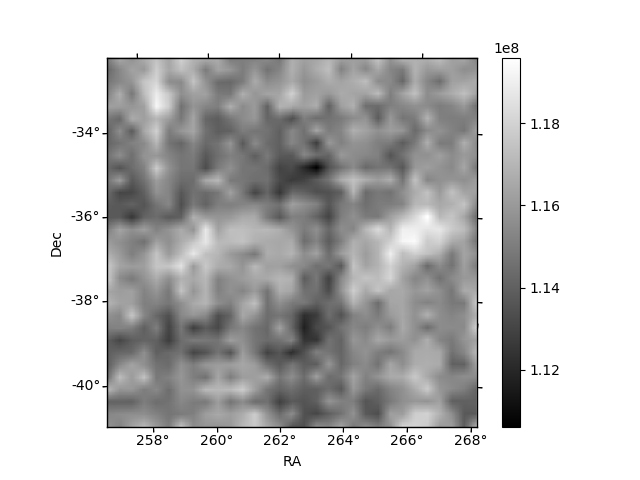
Quadrant B |
|---|---|---|---|
| Quadrant D | 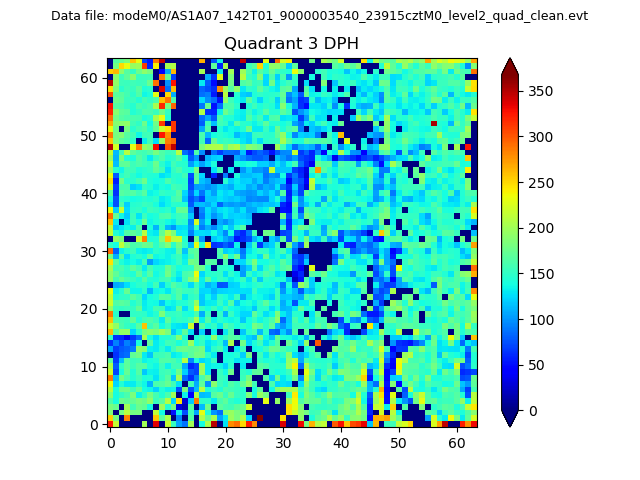 |
 |
Quadrant C |
| Plot type | Count rate plots | Images |
|---|---|---|
| Comparison with Poisson distribution Blue bars denote a histogram of data divided into 1 sec bins. Red curve is a Poisson curve with rate = median count rate of data. |
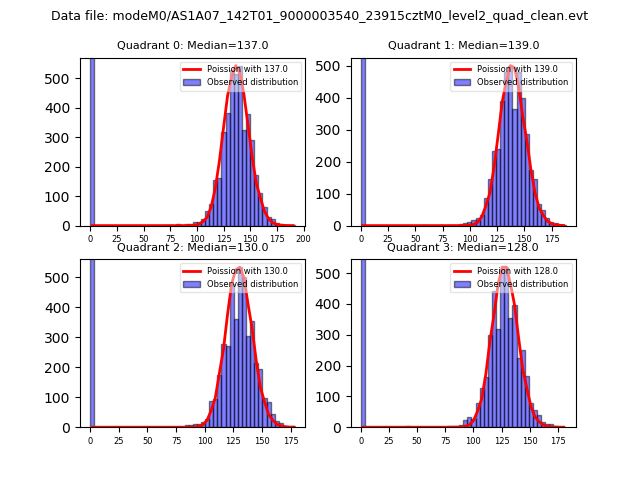 |
 |
| Quadrant-wise count rates Data is divided into 100 sec bins |
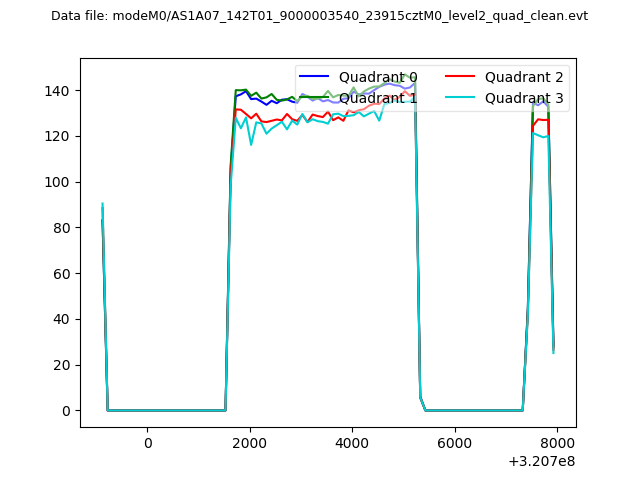 |
|
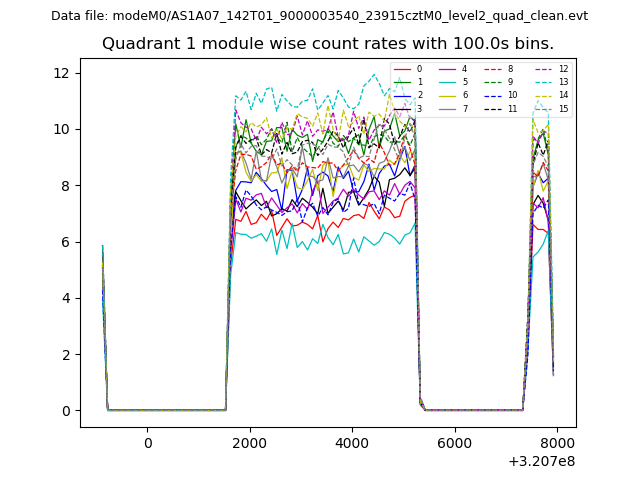
| Module-wise count rates for Quadrant A Data is divided into 100 sec bins |
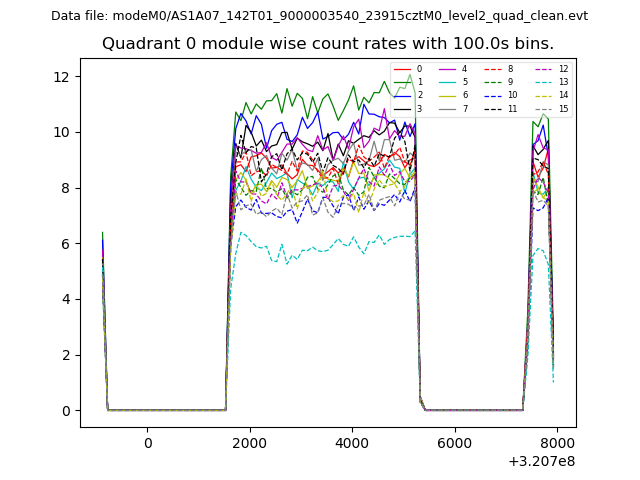 |
 |
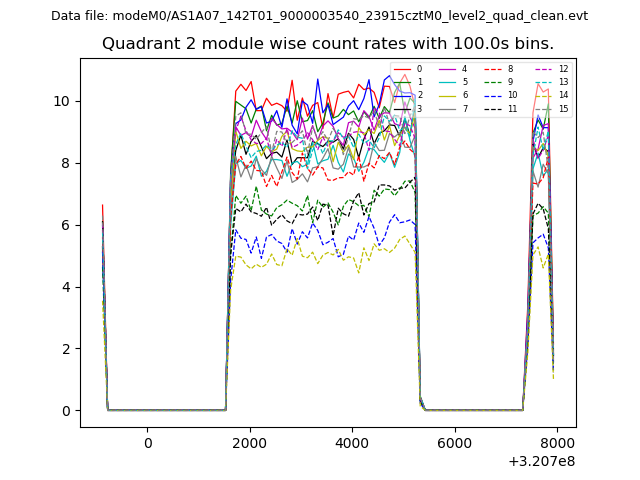
| Module-wise count rates for Quadrant B Data is divided into 100 sec bins |
 |
 |
| Module-wise count rates for Quadrant C Data is divided into 100 sec bins |
 |
 |
| Module-wise count rates for Quadrant D Data is divided into 100 sec bins |
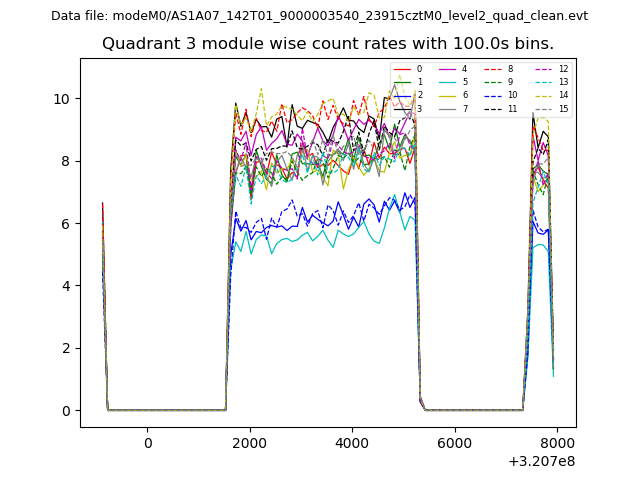 |
 |
| Parameter | Plot |
|---|---|
| CZT HV Monitor | 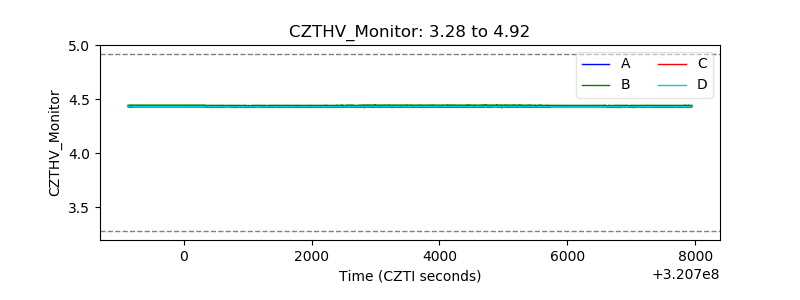 |
| D_VDD | 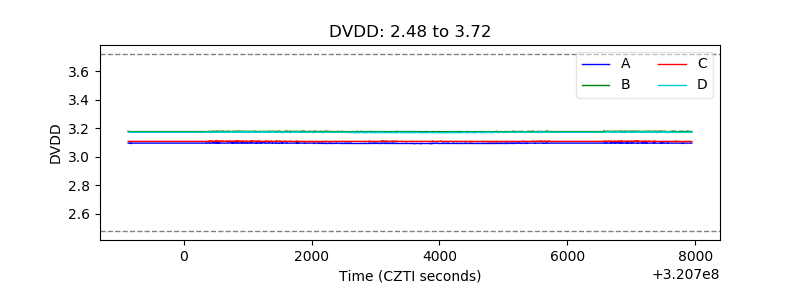 |
| Temperature 1 | 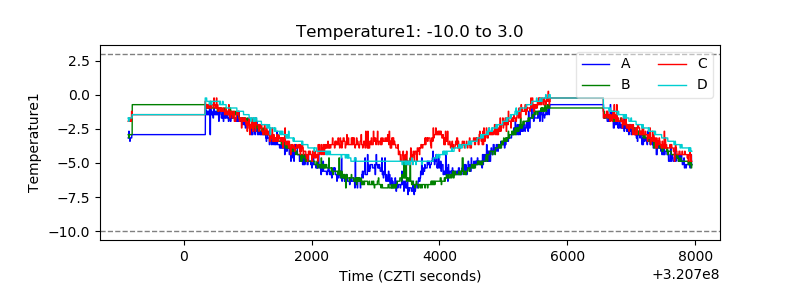 |
| Veto HV Monitor |  |
| Veto LLD | 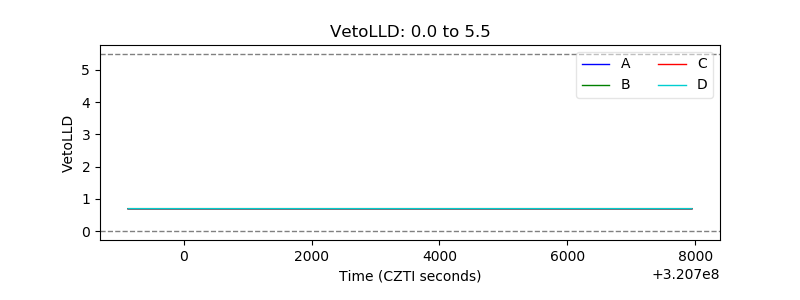 |
| Alpha Counter |  |
| _CPM_Rate | 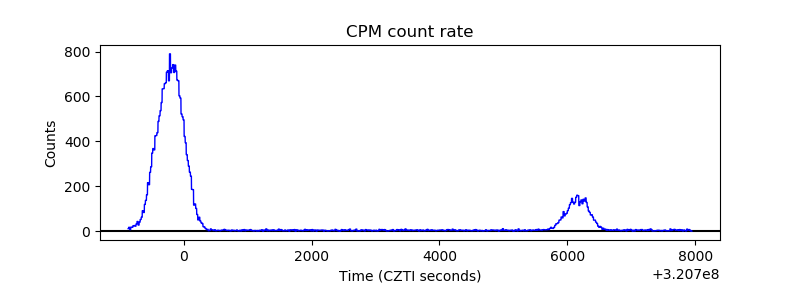 |
| CZT Counter | 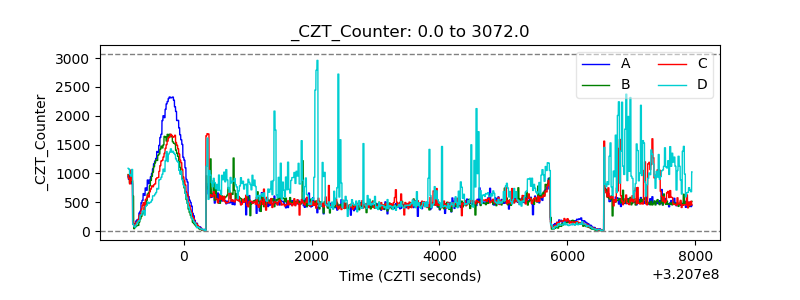 |
| +2.5 Volts monitor |  |
| +5 Volts monitor |  |
| _ROLL_ROT | 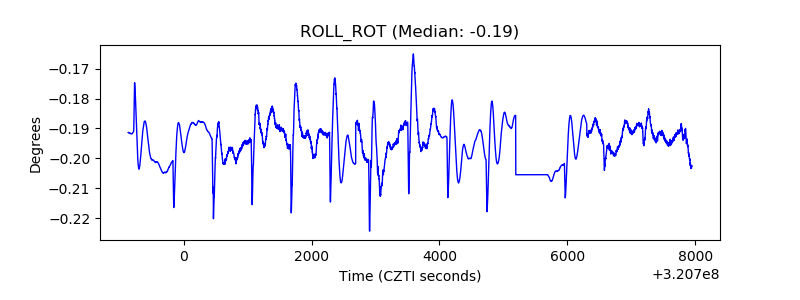 |
| _Roll_DEC | 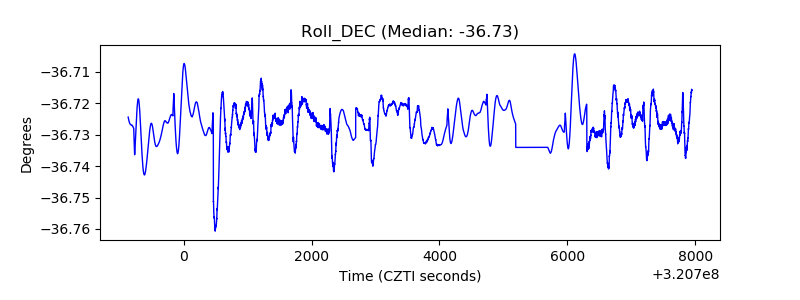 |
| _Roll_RA |  |
| Veto Counter | 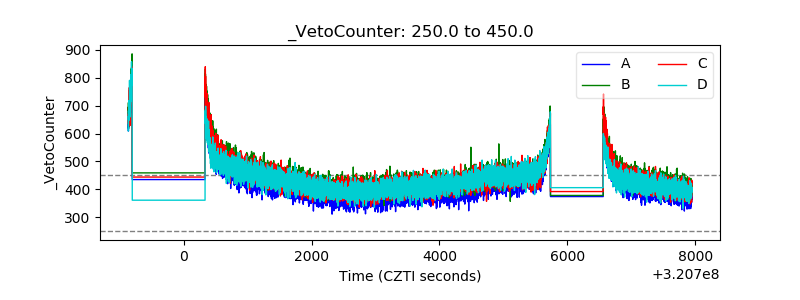 |