| Param | Original file | Final file |
|---|---|---|
| Filename | modeM0/AS1A07_142T01_9000003540_23917cztM0_level2.evt | modeM0/AS1A07_142T01_9000003540_23917cztM0_level2_quad_clean.evt |
| Size (bytes) | 599,132,160 | 102,075,840 |
| Size | 571.4 MB | 97.3 MB |
| Events in quadrant A | 3,717,695 | 655,796 |
| Events in quadrant B | 4,268,648 | 658,195 |
| Events in quadrant C | 3,789,651 | 626,812 |
| Events in quadrant D | 5,842,341 | 610,545 |
| Mode M9 | |||
|---|---|---|---|
| Quadrant | BADHDUFLAG | Total packets | Discarded packets |
| A | 0 | 6 | 0 |
| B | 0 | 6 | 0 |
| C | 0 | 6 | 0 |
| D | 0 | 6 | 0 |
| Mode M0 | |||
|---|---|---|---|
| Quadrant | BADHDUFLAG | Total packets | Discarded packets |
| A | 0 | 16070 | 2 |
| B | 0 | 17714 | 2 |
| C | 0 | 16110 | 2 |
| D | 0 | 22574 | 2 |
| Mode SS | |||
|---|---|---|---|
| Quadrant | BADHDUFLAG | Total packets | Discarded packets |
| A | 0 | 162 | 0 |
| B | 0 | 162 | 0 |
| C | 0 | 162 | 0 |
| D | 0 | 162 | 0 |
| Quadrant | Total seconds | Saturated seconds | Saturation percentage |
|---|---|---|---|
| A | 7755 | 55 | 0.709220% |
| B | 7756 | 292 | 3.764827% |
| C | 7756 | 133 | 1.714801% |
| D | 7756 | 308 | 3.971119% |
Noise dominated data is calculated using 1-second bins in cleaned event files. If a bin has >2000 counts, and if more than 50% of those come from <1% of pixels, then it is considered to be noise-dominated and hence unusable.
| Quadrant | # 1 sec bins | Bins with >0 counts | Bins with >2000 counts | High rate bins dominated by noise | Noise dominated (total time) | Noise dominated (detector-on time) | Marked lightcurve |
|---|---|---|---|---|---|---|---|
| A | 8445 | 7757 | 0 | 0 | 0.00% | 0.00% | 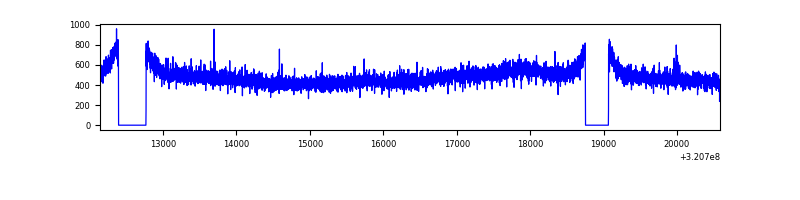 |
| B | 8446 | 7758 | 121 | 121 | 1.43% | 1.56% | 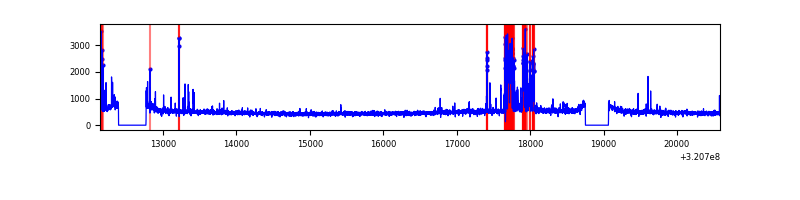 |
| C | 8446 | 7758 | 1 | 1 | 0.01% | 0.01% | 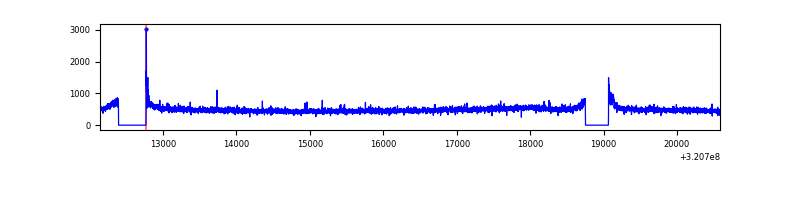 |
| D | 8446 | 7758 | 168 | 168 | 1.99% | 2.17% | 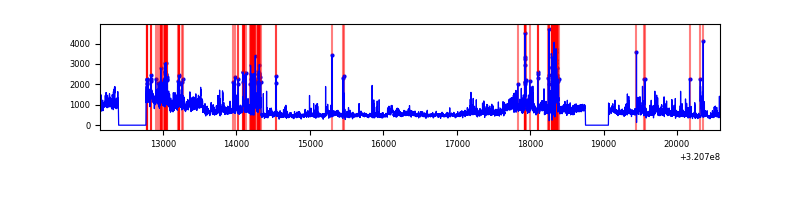 |
Top three noisy pixels from each quadrant. If the there are fewer than three noisy pixels in the level2.evt file, extra rows are filled as -1
| Pixel properties | Quadrant properties | ||||||
|---|---|---|---|---|---|---|---|
| Quadrant | DetID | PixID | Counts | Sigma | Mean | Median | Sigma |
| A | 13 | 254 | 13261 | 63.17 | 963 | 943 | 195.0 |
| A | 3 | 137 | 8383 | 38.15 | 963 | 943 | 195.0 |
| A | 0 | 226 | 8355 | 38.01 | 963 | 943 | 195.0 |
| B | 15 | 33 | 497940 | 2751.1 | 952 | 927 | 180.7 |
| B | 12 | 111 | 21386 | 113.25 | 952 | 927 | 180.7 |
| B | 11 | 111 | 18589 | 97.76 | 952 | 927 | 180.7 |
| C | 14 | 238 | 144233 | 664.29 | 919 | 924 | 215.7 |
| C | 0 | 10 | 26271 | 117.49 | 919 | 924 | 215.7 |
| C | 7 | 247 | 18932 | 83.47 | 919 | 924 | 215.7 |
| D | 8 | 195 | 1205546 | 5351.97 | 921 | 892 | 225.1 |
| D | 1 | 52 | 698488 | 3099.24 | 921 | 892 | 225.1 |
| D | 12 | 218 | 214928 | 950.91 | 921 | 892 | 225.1 |
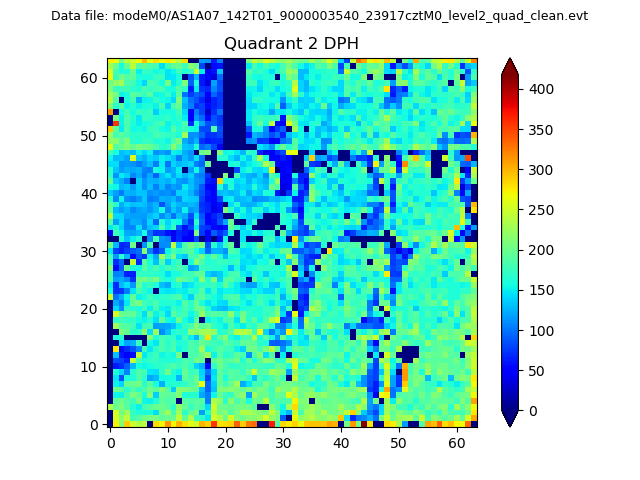
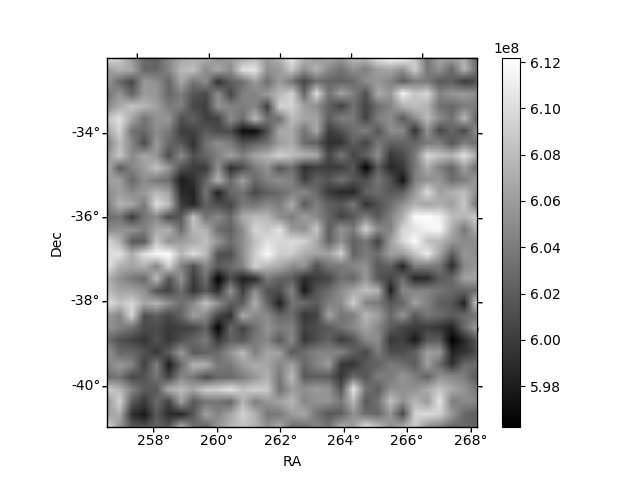
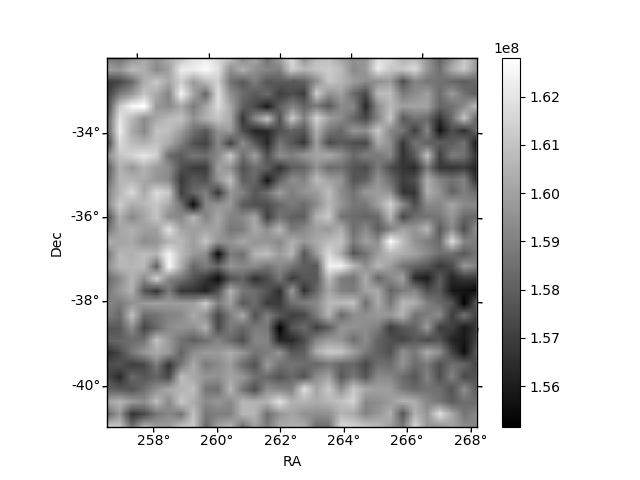
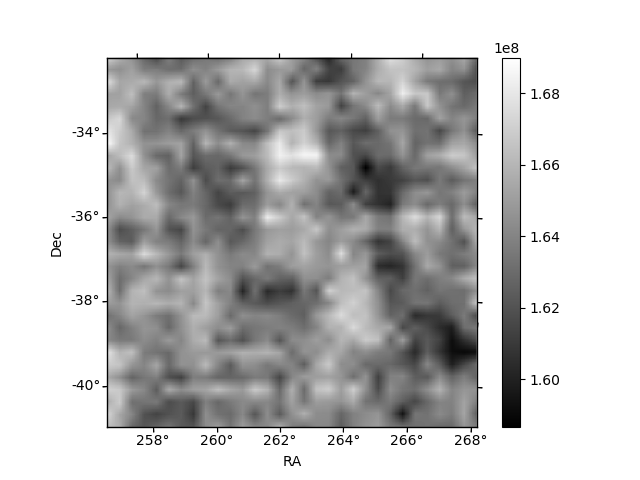
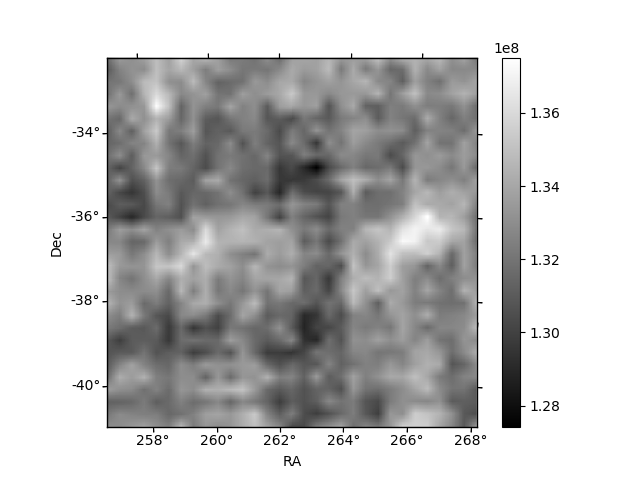
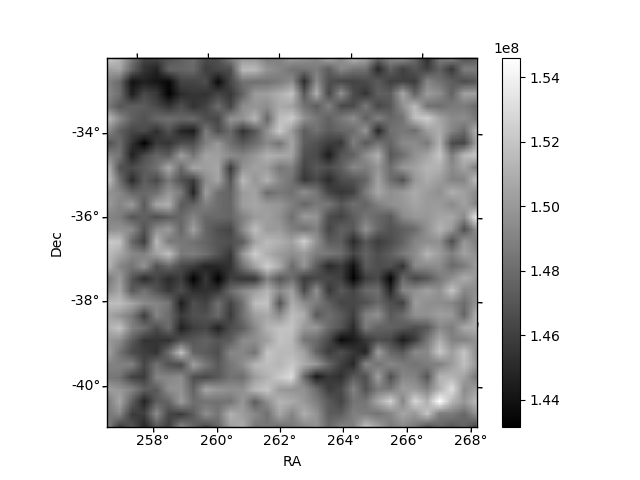
Histogram calculated using DETX and DETY for each event in the final _common_clean file
| Quadrant A | 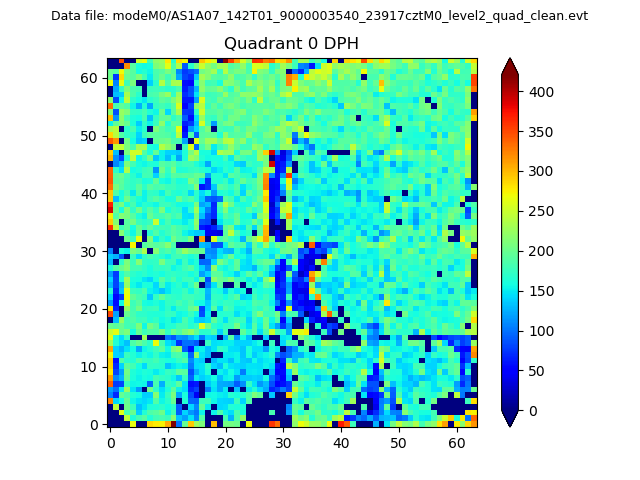 |
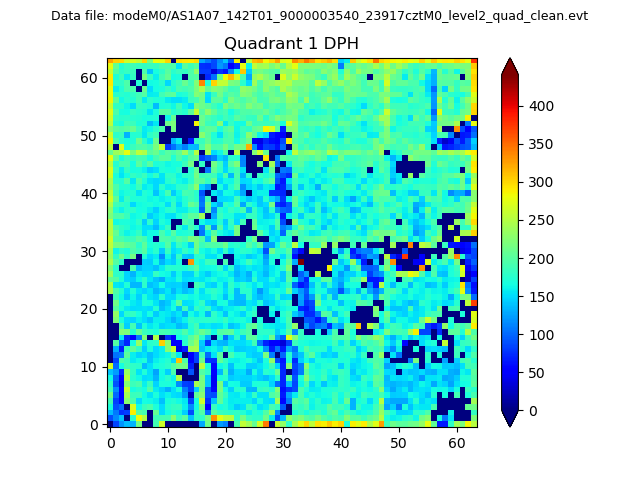 |
Quadrant B |
|---|---|---|---|
| Quadrant D | 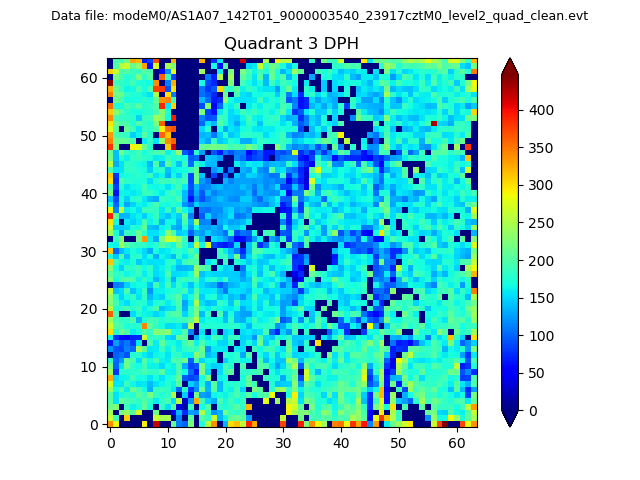 |
 |
Quadrant C |
| Plot type | Count rate plots | Images |
|---|---|---|
| Comparison with Poisson distribution Blue bars denote a histogram of data divided into 1 sec bins. Red curve is a Poisson curve with rate = median count rate of data. |
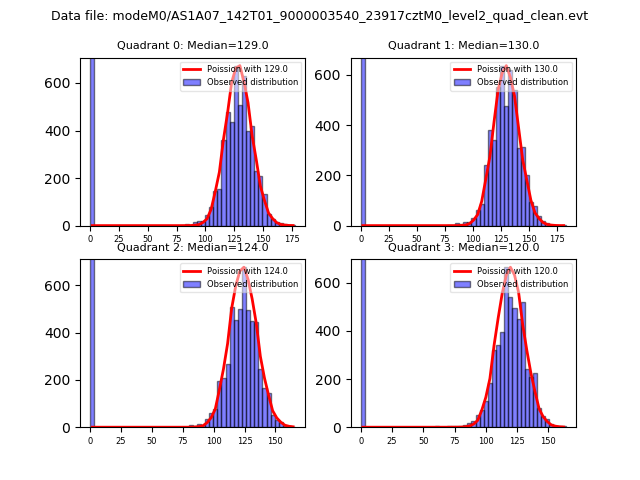 |
 |
| Quadrant-wise count rates Data is divided into 100 sec bins |
 |
|
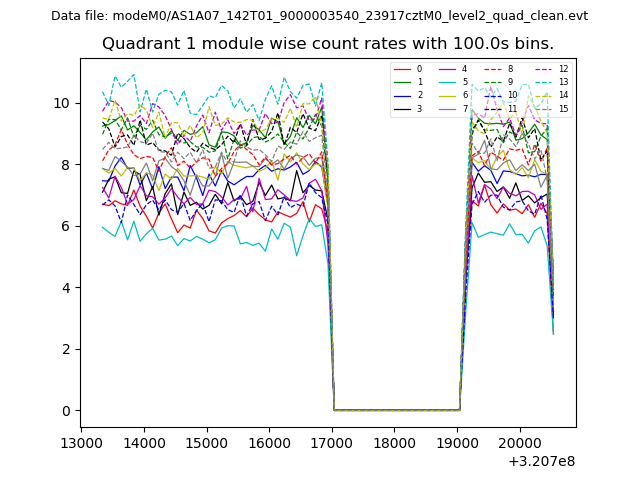
| Module-wise count rates for Quadrant A Data is divided into 100 sec bins |
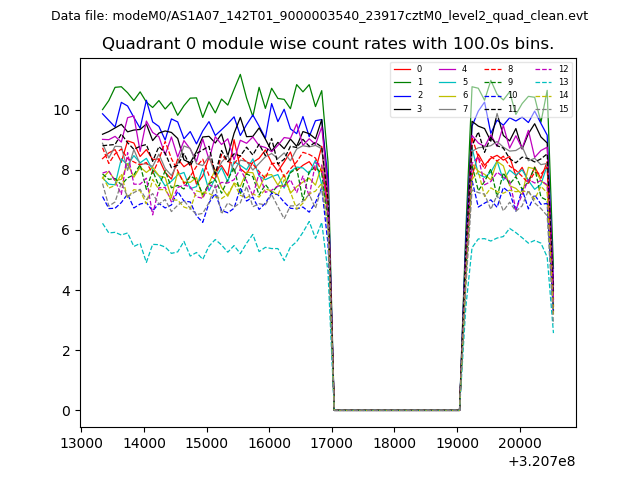 |
 |
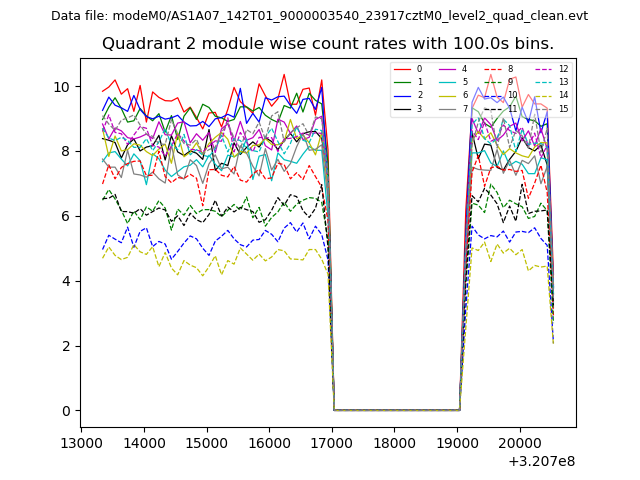
| Module-wise count rates for Quadrant B Data is divided into 100 sec bins |
 |
 |
| Module-wise count rates for Quadrant C Data is divided into 100 sec bins |
 |
 |
| Module-wise count rates for Quadrant D Data is divided into 100 sec bins |
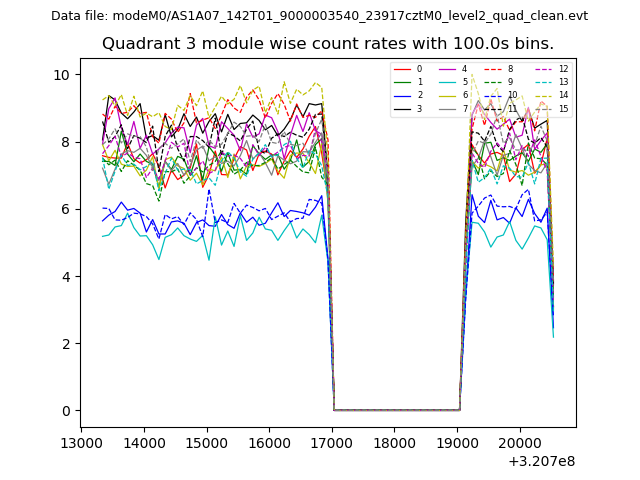 |
 |
| Parameter | Plot |
|---|---|
| CZT HV Monitor | 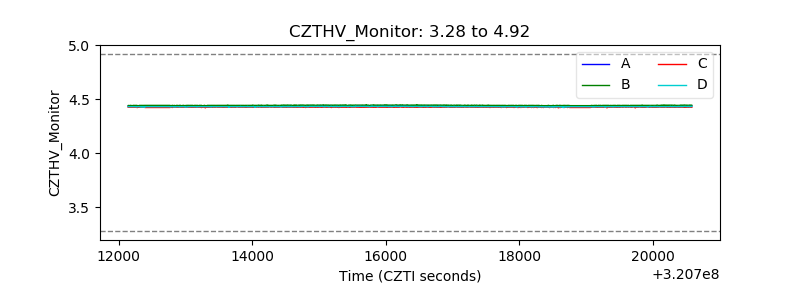 |
| D_VDD | 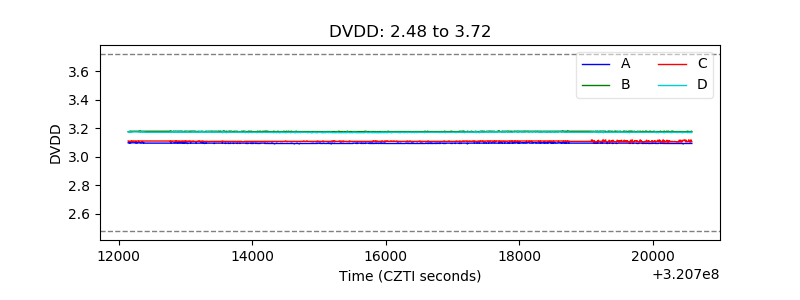 |
| Temperature 1 | 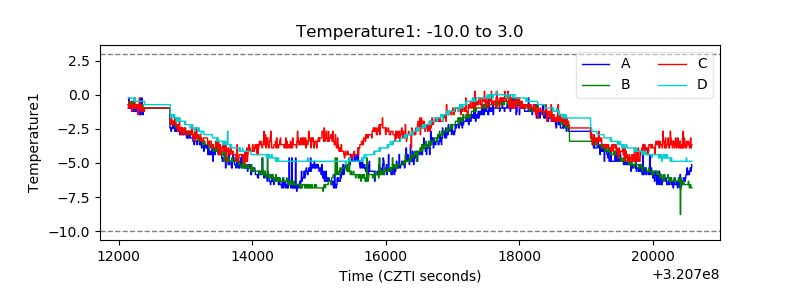 |
| Veto HV Monitor |  |
| Veto LLD | 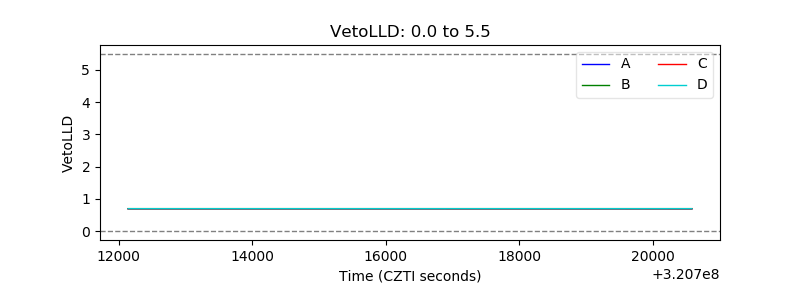 |
| Alpha Counter |  |
| _CPM_Rate |  |
| CZT Counter | 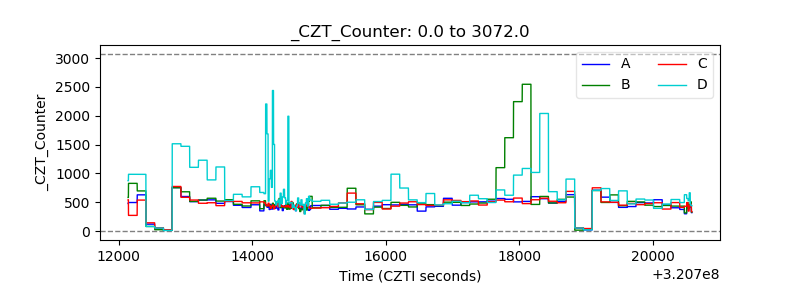 |
| +2.5 Volts monitor |  |
| +5 Volts monitor |  |
| _ROLL_ROT | 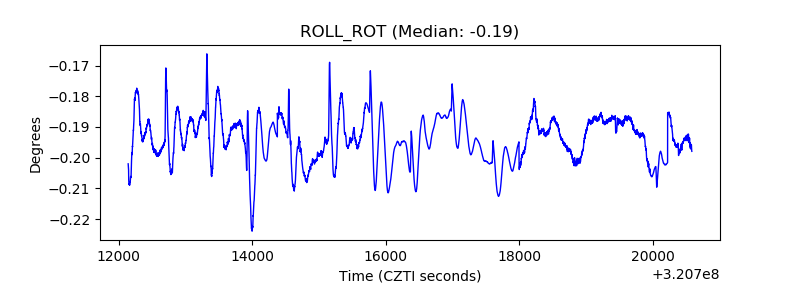 |
| _Roll_DEC | 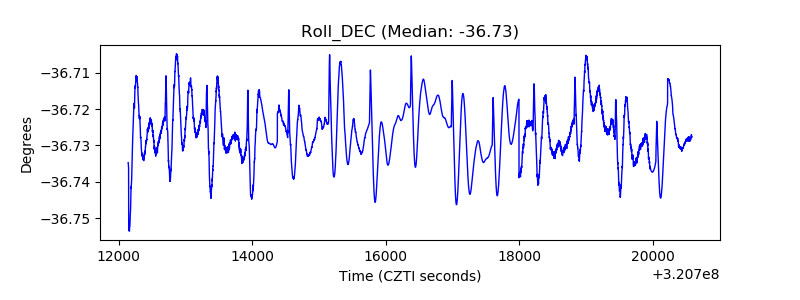 |
| _Roll_RA | 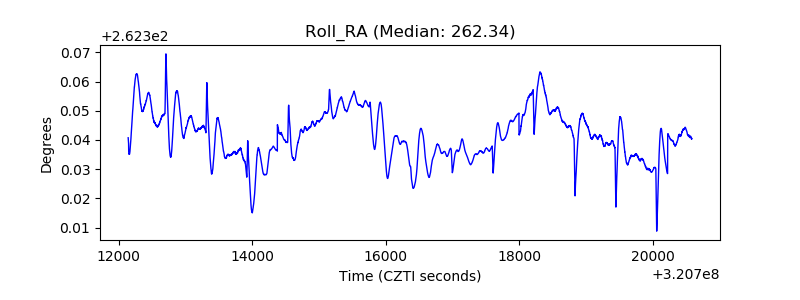 |
| Veto Counter | 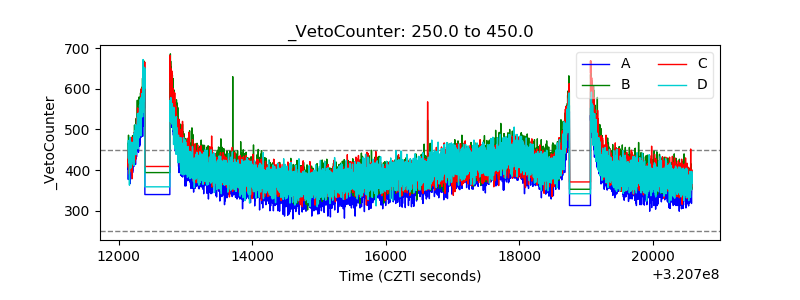 |