| Param | Original file | Final file |
|---|---|---|
| Filename | modeM0/AS1A07_142T01_9000003540_23922cztM0_level2.evt | modeM0/AS1A07_142T01_9000003540_23922cztM0_level2_quad_clean.evt |
| Size (bytes) | 1,128,859,200 | 198,008,640 |
| Size | 1.1 GB | 188.8 MB |
| Events in quadrant A | 7,019,430 | 1,266,508 |
| Events in quadrant B | 7,133,002 | 1,290,236 |
| Events in quadrant C | 7,283,095 | 1,225,408 |
| Events in quadrant D | 11,747,880 | 1,189,169 |
| Mode M9 | |||
|---|---|---|---|
| Quadrant | BADHDUFLAG | Total packets | Discarded packets |
| A | 0 | 13 | 0 |
| B | 0 | 13 | 0 |
| C | 0 | 13 | 0 |
| D | 0 | 13 | 0 |
| Mode M0 | |||
|---|---|---|---|
| Quadrant | BADHDUFLAG | Total packets | Discarded packets |
| A | 0 | 30658 | 3 |
| B | 0 | 30728 | 3 |
| C | 0 | 31014 | 3 |
| D | 0 | 45306 | 3 |
| Mode SS | |||
|---|---|---|---|
| Quadrant | BADHDUFLAG | Total packets | Discarded packets |
| A | 0 | 302 | 0 |
| B | 0 | 302 | 0 |
| C | 0 | 302 | 0 |
| D | 0 | 302 | 0 |
| Quadrant | Total seconds | Saturated seconds | Saturation percentage |
|---|---|---|---|
| A | 14868 | 58 | 0.390100% |
| B | 14869 | 70 | 0.470778% |
| C | 14869 | 160 | 1.076064% |
| D | 14869 | 624 | 4.196651% |
Noise dominated data is calculated using 1-second bins in cleaned event files. If a bin has >2000 counts, and if more than 50% of those come from <1% of pixels, then it is considered to be noise-dominated and hence unusable.
| Quadrant | # 1 sec bins | Bins with >0 counts | Bins with >2000 counts | High rate bins dominated by noise | Noise dominated (total time) | Noise dominated (detector-on time) | Marked lightcurve |
|---|---|---|---|---|---|---|---|
| A | 16138 | 14871 | 1 | 1 | 0.01% | 0.01% | 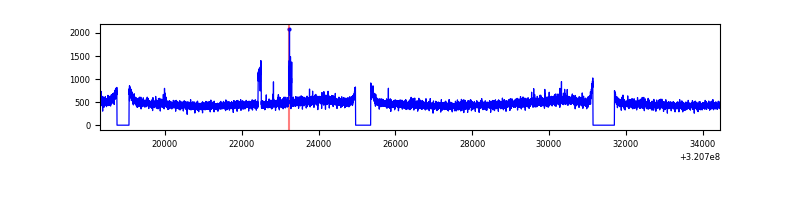 |
| B | 16139 | 14872 | 2 | 2 | 0.01% | 0.01% | 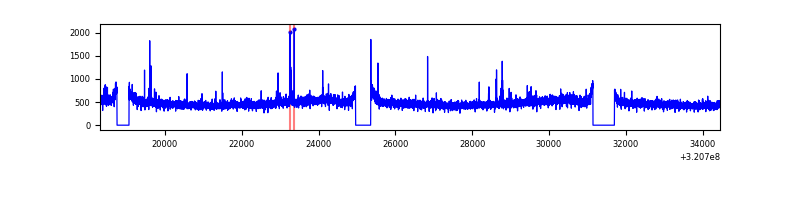 |
| C | 16139 | 14872 | 0 | 0 | 0.00% | 0.00% | 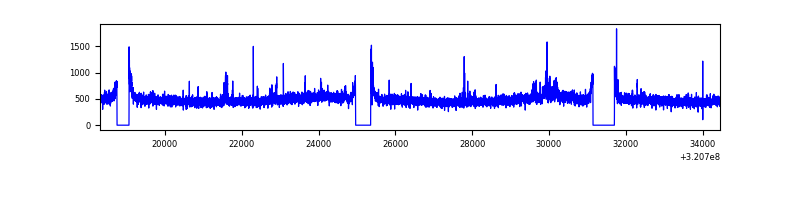 |
| D | 16139 | 14872 | 393 | 393 | 2.44% | 2.64% | 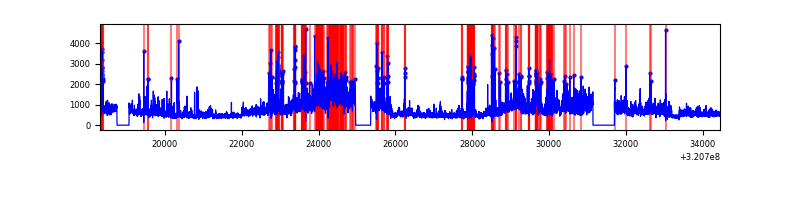 |
Top three noisy pixels from each quadrant. If the there are fewer than three noisy pixels in the level2.evt file, extra rows are filled as -1
| Pixel properties | Quadrant properties | ||||||
|---|---|---|---|---|---|---|---|
| Quadrant | DetID | PixID | Counts | Sigma | Mean | Median | Sigma |
| A | 11 | 29 | 90226 | 244.37 | 1796 | 1758 | 362.0 |
| A | 13 | 254 | 23893 | 61.14 | 1796 | 1758 | 362.0 |
| A | 0 | 226 | 15641 | 38.35 | 1796 | 1758 | 362.0 |
| B | 12 | 111 | 41116 | 116.23 | 1793 | 1747 | 338.7 |
| B | 0 | 189 | 36326 | 102.09 | 1793 | 1747 | 338.7 |
| B | 11 | 111 | 35650 | 100.09 | 1793 | 1747 | 338.7 |
| C | 14 | 238 | 273147 | 671.22 | 1729 | 1741 | 404.3 |
| C | 10 | 9 | 159341 | 389.77 | 1729 | 1741 | 404.3 |
| C | 7 | 247 | 58457 | 140.27 | 1729 | 1741 | 404.3 |
| D | 8 | 195 | 2684611 | 6336.66 | 1731 | 1679 | 423.4 |
| D | 1 | 52 | 1573664 | 3712.78 | 1731 | 1679 | 423.4 |
| D | 12 | 218 | 727844 | 1715.09 | 1731 | 1679 | 423.4 |
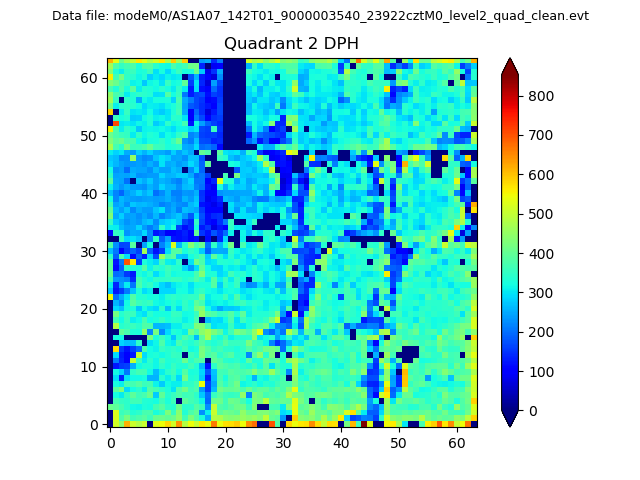
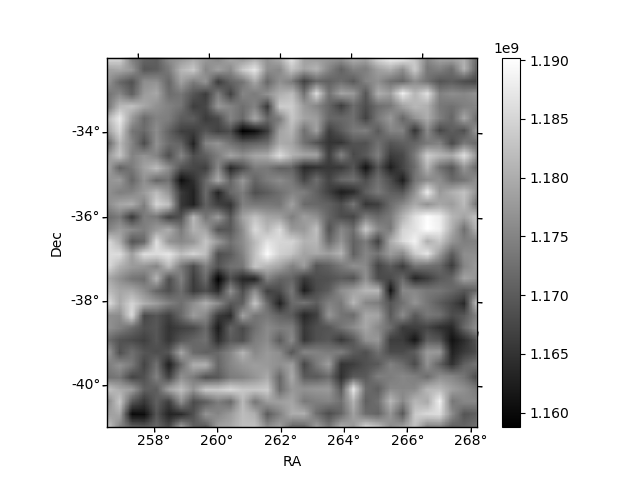
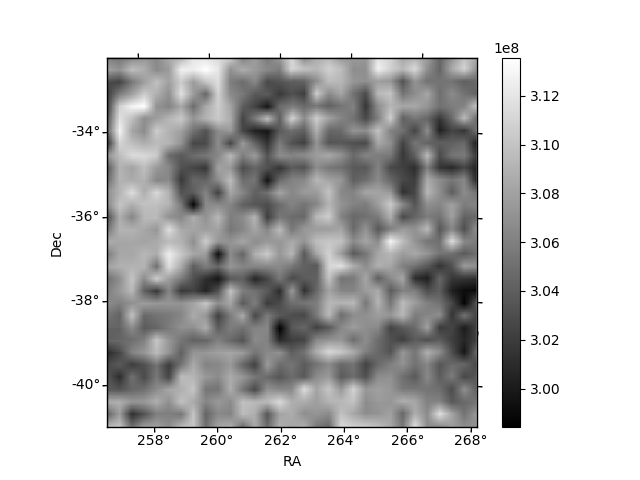
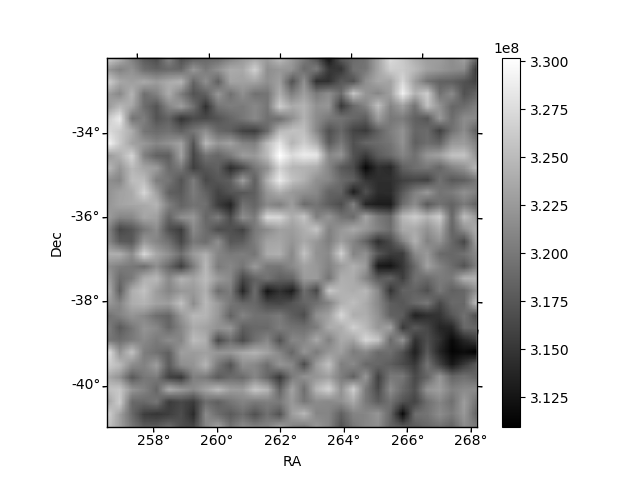
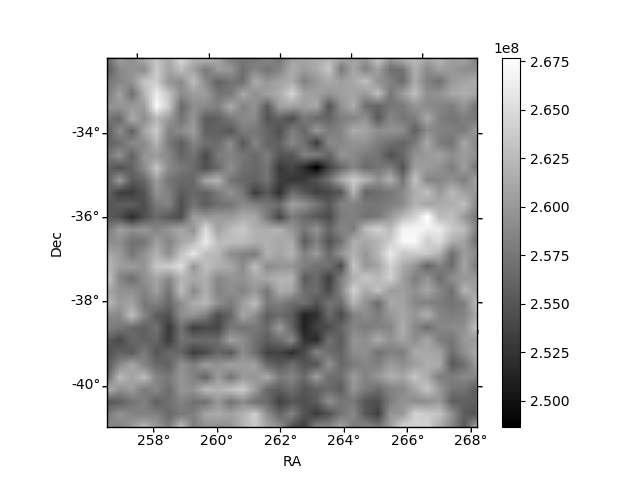
Histogram calculated using DETX and DETY for each event in the final _common_clean file
| Quadrant A | 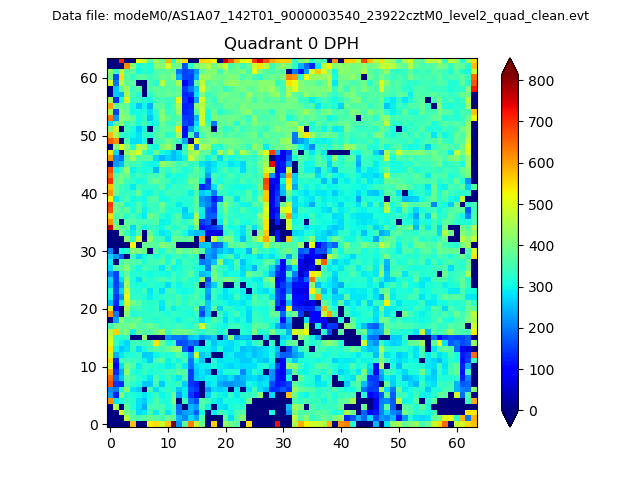 |
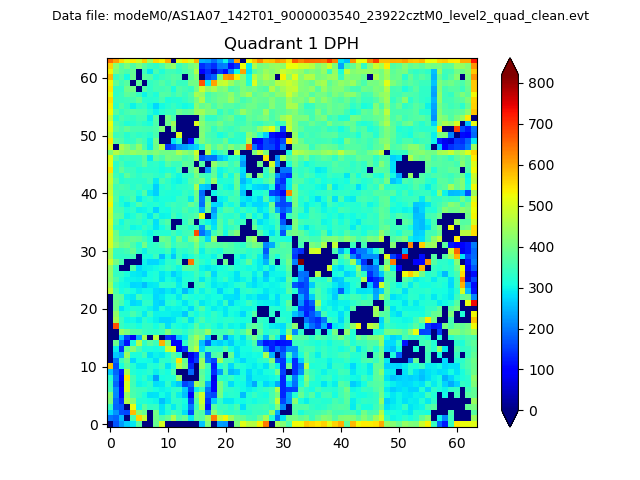 |
Quadrant B |
|---|---|---|---|
| Quadrant D | 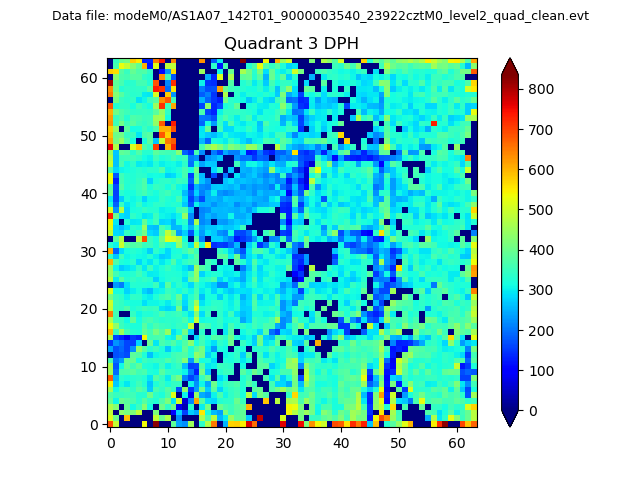 |
 |
Quadrant C |
| Plot type | Count rate plots | Images |
|---|---|---|
| Comparison with Poisson distribution Blue bars denote a histogram of data divided into 1 sec bins. Red curve is a Poisson curve with rate = median count rate of data. |
 |
 |
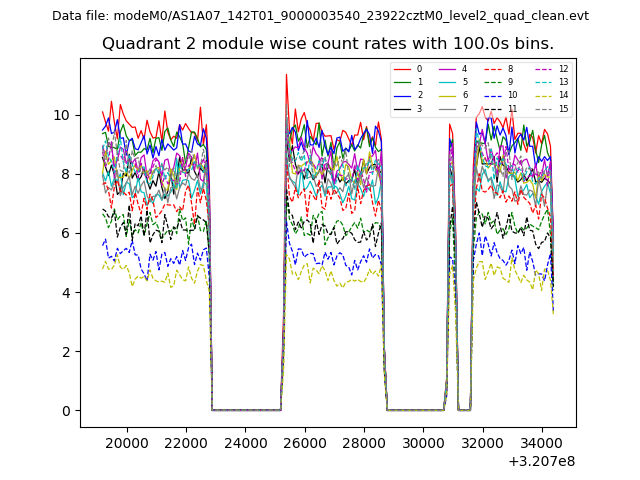
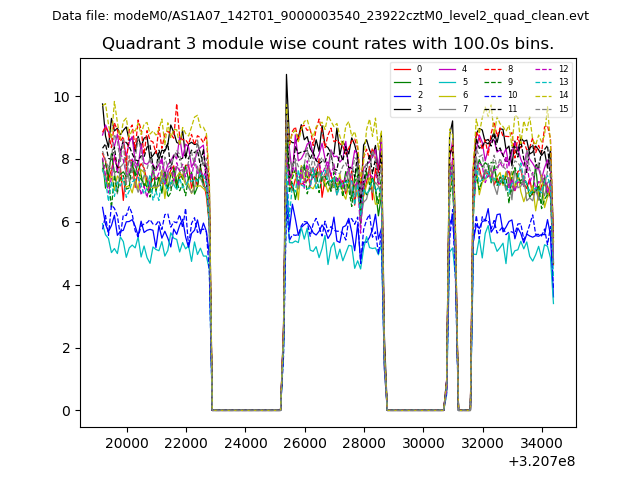
| Quadrant-wise count rates Data is divided into 100 sec bins |
 |
|
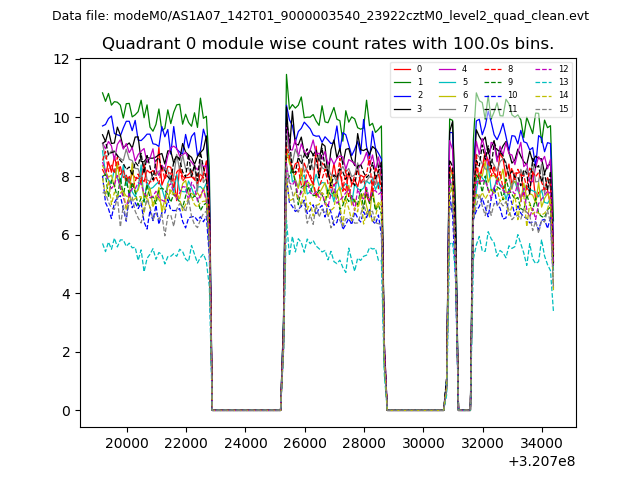
| Module-wise count rates for Quadrant A Data is divided into 100 sec bins |
 |
 |
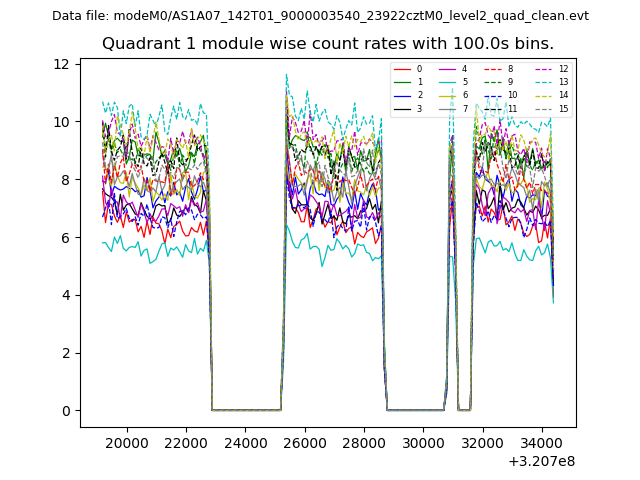
| Module-wise count rates for Quadrant B Data is divided into 100 sec bins |
 |
 |
| Module-wise count rates for Quadrant C Data is divided into 100 sec bins |
 |
 |
| Module-wise count rates for Quadrant D Data is divided into 100 sec bins |
 |
 |
| Parameter | Plot |
|---|---|
| CZT HV Monitor | 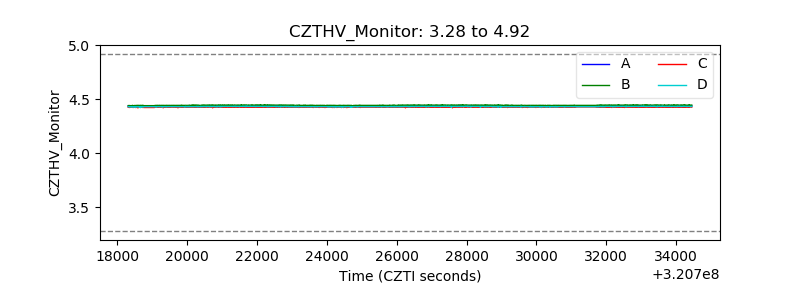 |
| D_VDD | 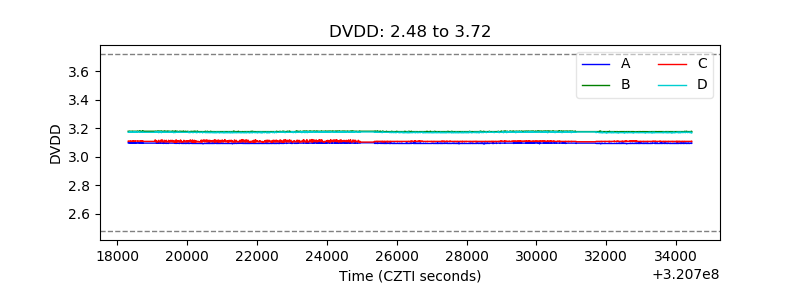 |
| Temperature 1 | 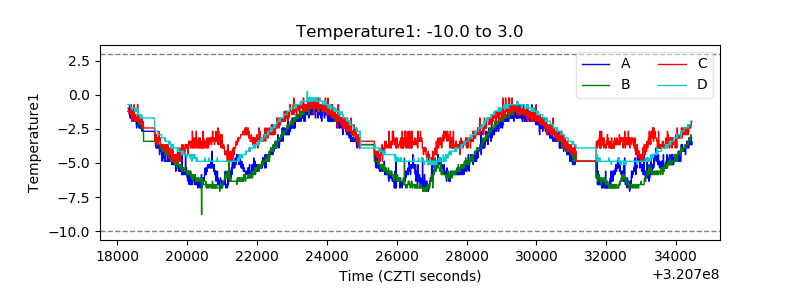 |
| Veto HV Monitor | 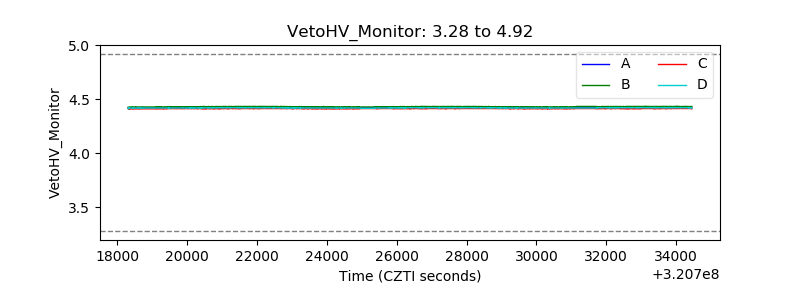 |
| Veto LLD | 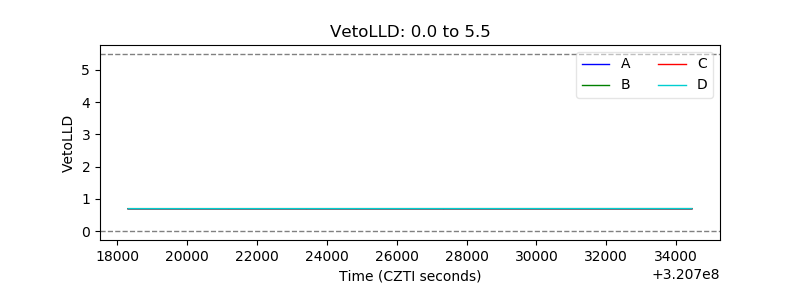 |
| Alpha Counter | 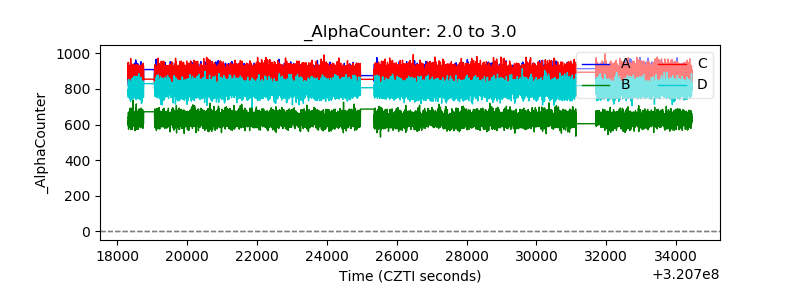 |
| _CPM_Rate |  |
| CZT Counter | 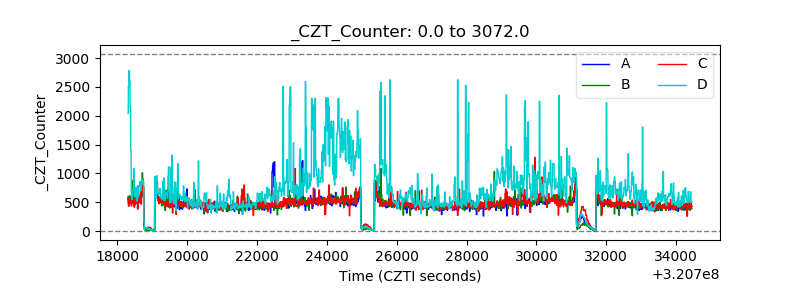 |
| +2.5 Volts monitor |  |
| +5 Volts monitor | 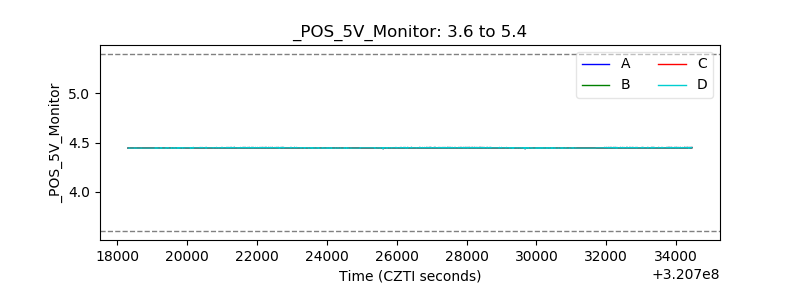 |
| _ROLL_ROT | 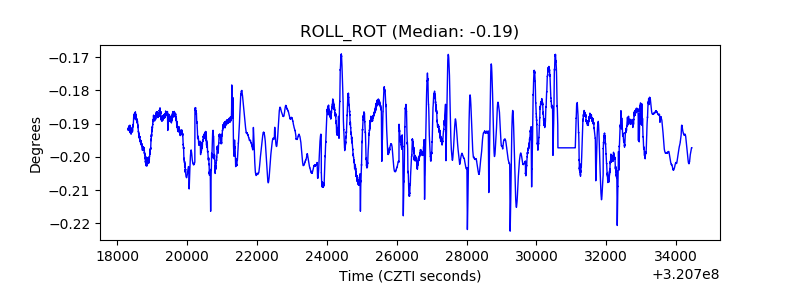 |
| _Roll_DEC | 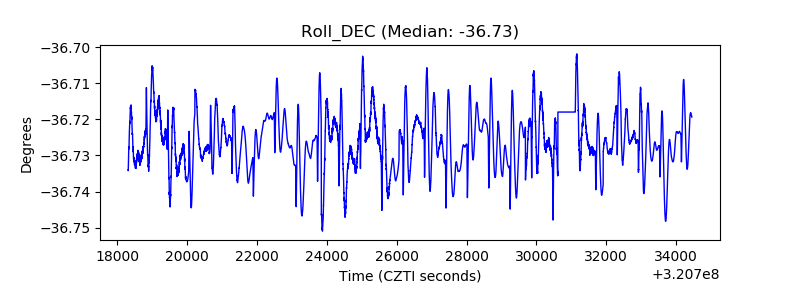 |
| _Roll_RA | 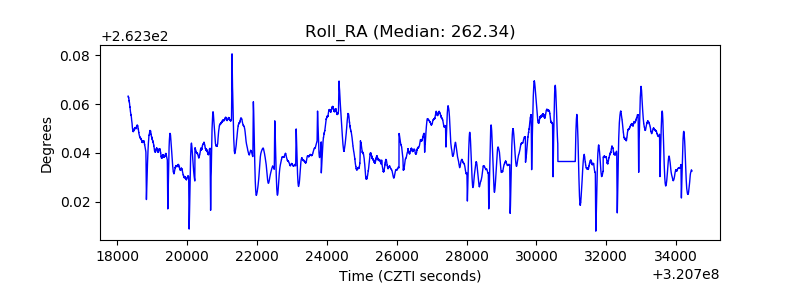 |
| Veto Counter | 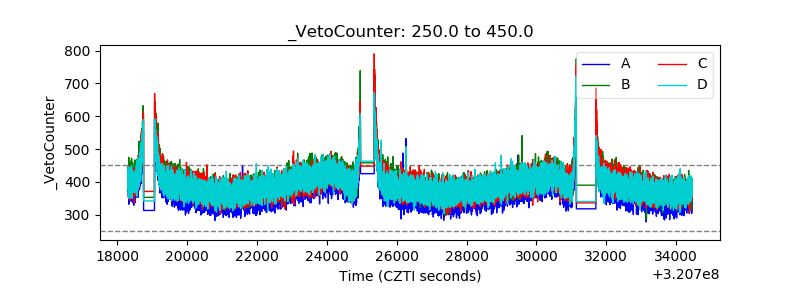 |