| Param | Original file | Final file |
|---|---|---|
| Filename | modeM0/AS1A07_142T01_9000003540_23924cztM0_level2.evt | modeM0/AS1A07_142T01_9000003540_23924cztM0_level2_quad_clean.evt |
| Size (bytes) | 1,673,043,840 | 255,939,840 |
| Size | 1.6 GB | 244.1 MB |
| Events in quadrant A | 10,089,952 | 1,624,081 |
| Events in quadrant B | 10,544,317 | 1,643,422 |
| Events in quadrant C | 11,124,949 | 1,554,842 |
| Events in quadrant D | 17,514,251 | 1,504,509 |
| Mode M9 | |||
|---|---|---|---|
| Quadrant | BADHDUFLAG | Total packets | Discarded packets |
| A | 0 | 36 | 0 |
| B | 0 | 36 | 0 |
| C | 0 | 36 | 0 |
| D | 0 | 36 | 0 |
| Mode M0 | |||
|---|---|---|---|
| Quadrant | BADHDUFLAG | Total packets | Discarded packets |
| A | 0 | 42793 | 3 |
| B | 0 | 43802 | 3 |
| C | 0 | 45597 | 3 |
| D | 0 | 66750 | 3 |
| Mode SS | |||
|---|---|---|---|
| Quadrant | BADHDUFLAG | Total packets | Discarded packets |
| A | 0 | 424 | 0 |
| B | 0 | 424 | 0 |
| C | 0 | 424 | 0 |
| D | 0 | 424 | 0 |
| Quadrant | Total seconds | Saturated seconds | Saturation percentage |
|---|---|---|---|
| A | 20682 | 210 | 1.015376% |
| B | 20683 | 256 | 1.237731% |
| C | 20682 | 528 | 2.552945% |
| D | 20682 | 845 | 4.085678% |
Noise dominated data is calculated using 1-second bins in cleaned event files. If a bin has >2000 counts, and if more than 50% of those come from <1% of pixels, then it is considered to be noise-dominated and hence unusable.
| Quadrant | # 1 sec bins | Bins with >0 counts | Bins with >2000 counts | High rate bins dominated by noise | Noise dominated (total time) | Noise dominated (detector-on time) | Marked lightcurve |
|---|---|---|---|---|---|---|---|
| A | 24327 | 20686 | 0 | 0 | 0.00% | 0.00% | 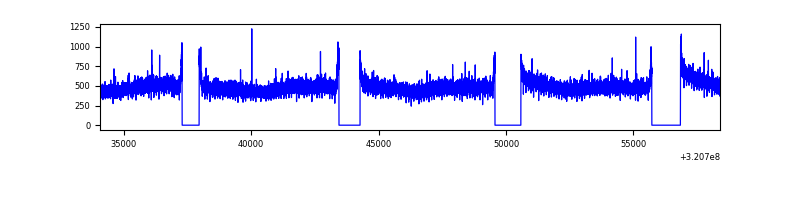 |
| B | 24328 | 20687 | 11 | 11 | 0.05% | 0.05% | 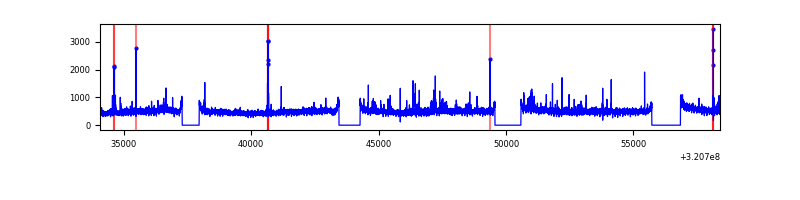 |
| C | 24327 | 20686 | 143 | 143 | 0.59% | 0.69% | 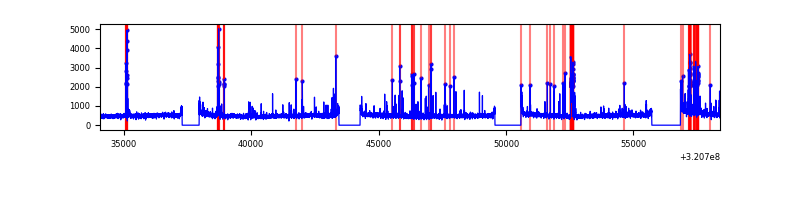 |
| D | 24327 | 20686 | 511 | 511 | 2.10% | 2.47% | 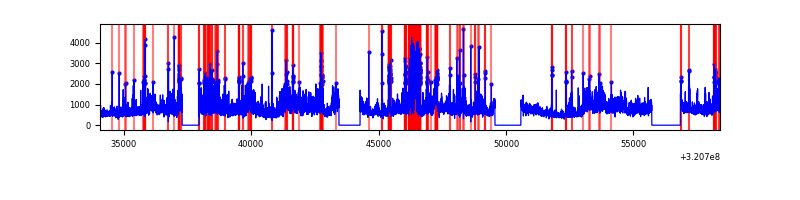 |
Top three noisy pixels from each quadrant. If the there are fewer than three noisy pixels in the level2.evt file, extra rows are filled as -1
| Pixel properties | Quadrant properties | ||||||
|---|---|---|---|---|---|---|---|
| Quadrant | DetID | PixID | Counts | Sigma | Mean | Median | Sigma |
| A | 13 | 254 | 31426 | 55.45 | 2618 | 2563 | 520.5 |
| A | 3 | 137 | 22544 | 38.39 | 2618 | 2563 | 520.5 |
| A | 0 | 226 | 22383 | 38.08 | 2618 | 2563 | 520.5 |
| B | 0 | 189 | 255601 | 521.83 | 2586 | 2522 | 485.0 |
| B | 12 | 111 | 59090 | 116.64 | 2586 | 2522 | 485.0 |
| B | 11 | 111 | 52425 | 102.9 | 2586 | 2522 | 485.0 |
| C | 10 | 9 | 834950 | 1447.46 | 2483 | 2498 | 575.1 |
| C | 14 | 238 | 397162 | 686.24 | 2483 | 2498 | 575.1 |
| C | 7 | 247 | 131135 | 223.67 | 2483 | 2498 | 575.1 |
| D | 8 | 195 | 4800898 | 7929.83 | 2518 | 2449 | 605.1 |
| D | 1 | 52 | 2310819 | 3814.77 | 2518 | 2449 | 605.1 |
| D | 12 | 218 | 750299 | 1235.88 | 2518 | 2449 | 605.1 |
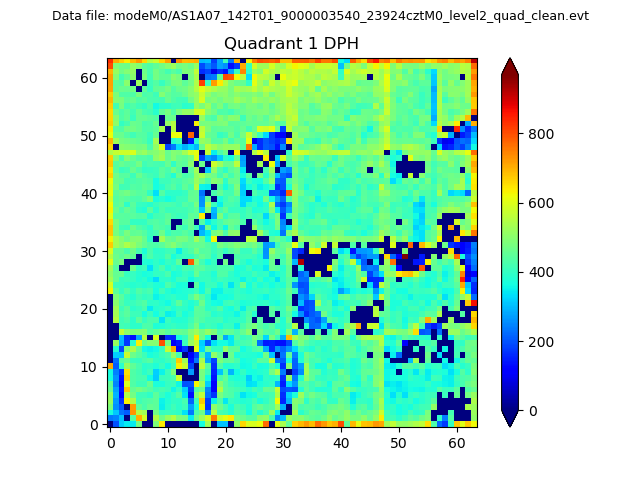
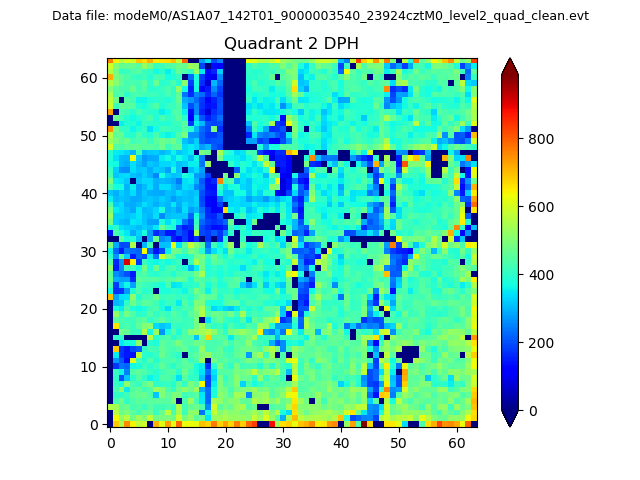
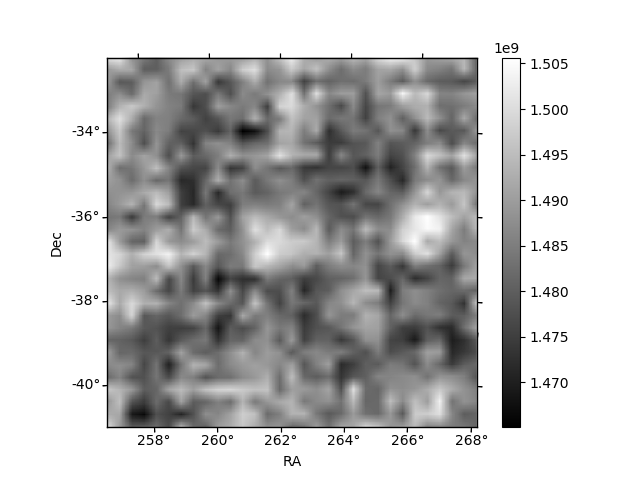
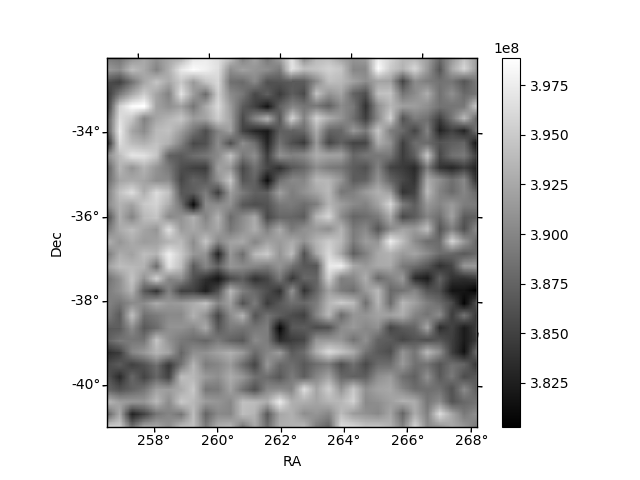
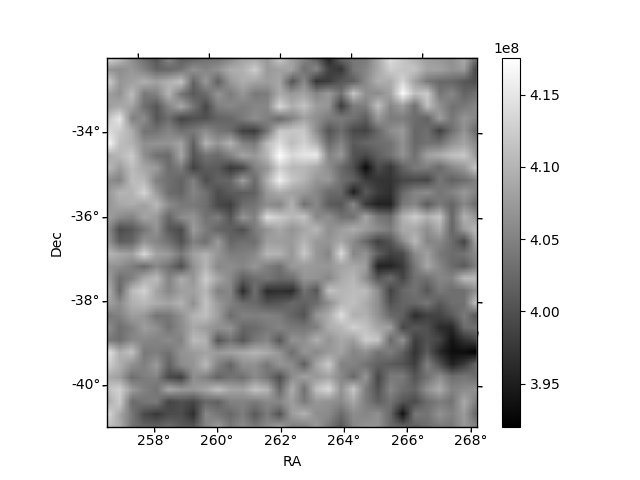
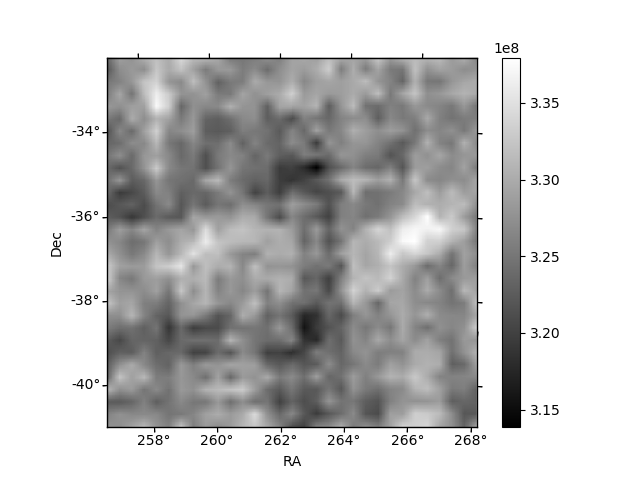
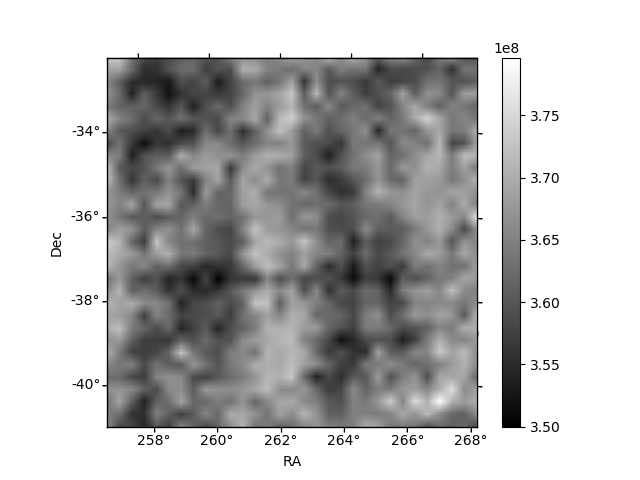
Histogram calculated using DETX and DETY for each event in the final _common_clean file
| Quadrant A |  |
 |
Quadrant B |
|---|---|---|---|
| Quadrant D | 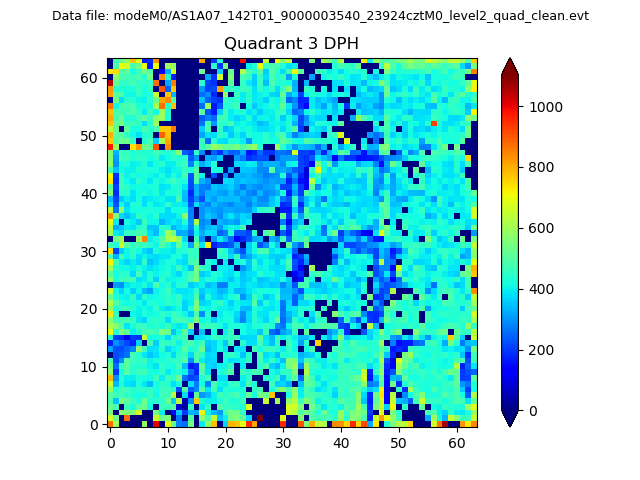 |
 |
Quadrant C |
| Plot type | Count rate plots | Images |
|---|---|---|
| Comparison with Poisson distribution Blue bars denote a histogram of data divided into 1 sec bins. Red curve is a Poisson curve with rate = median count rate of data. |
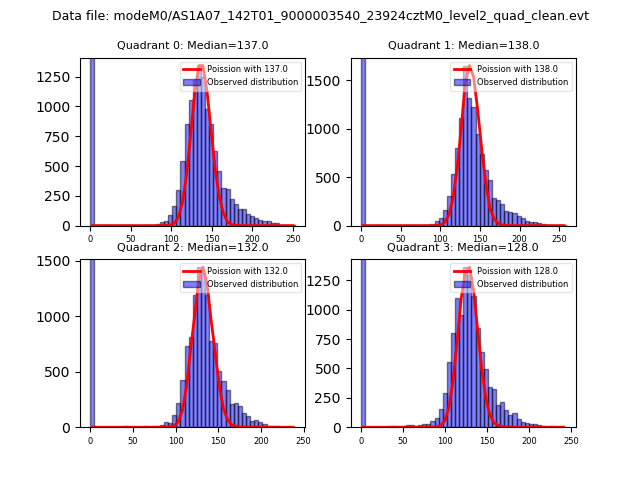 |
 |
| Quadrant-wise count rates Data is divided into 100 sec bins |
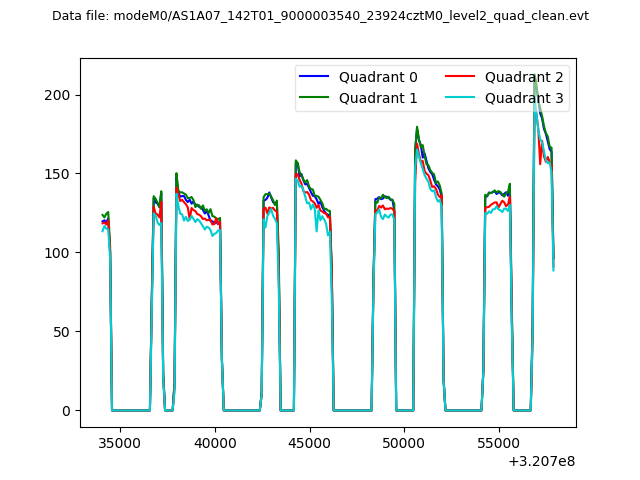 |
|
| Module-wise count rates for Quadrant A Data is divided into 100 sec bins |
 |
 |
| Module-wise count rates for Quadrant B Data is divided into 100 sec bins |
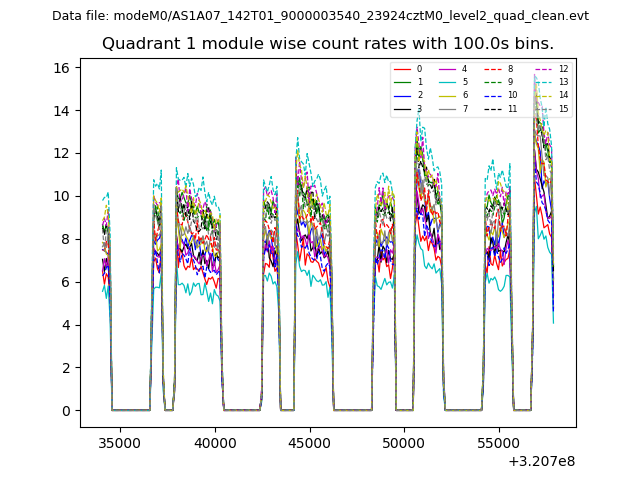 |
 |
| Module-wise count rates for Quadrant C Data is divided into 100 sec bins |
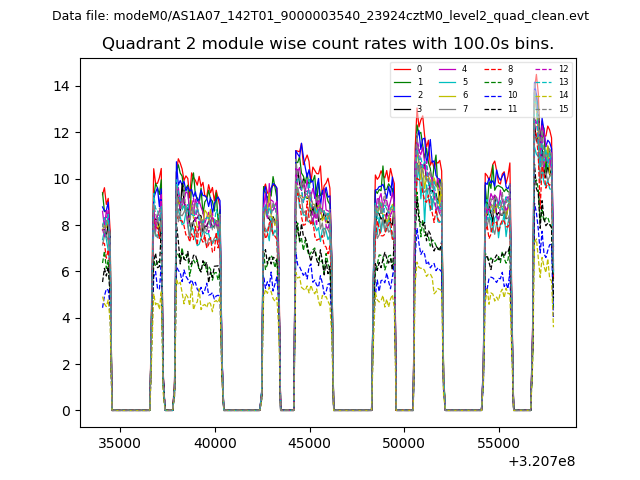 |
 |
| Module-wise count rates for Quadrant D Data is divided into 100 sec bins |
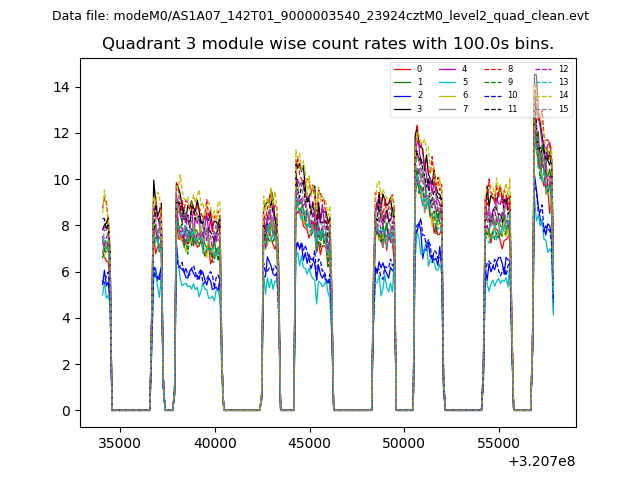 |
 |
| Parameter | Plot |
|---|---|
| CZT HV Monitor | 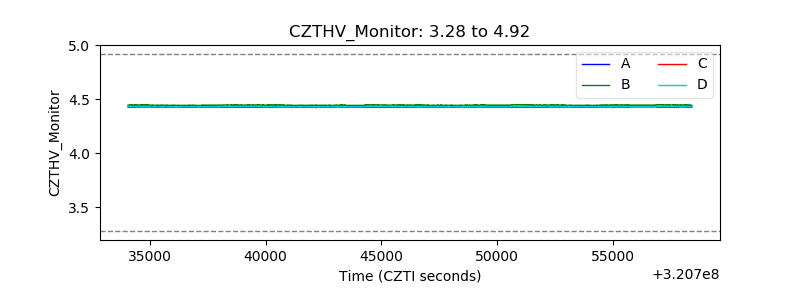 |
| D_VDD | 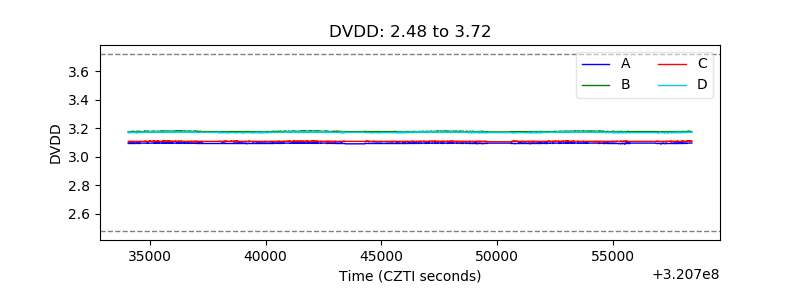 |
| Temperature 1 | 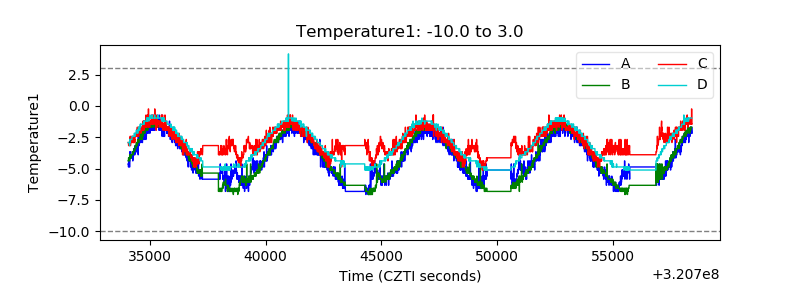 |
| Veto HV Monitor | 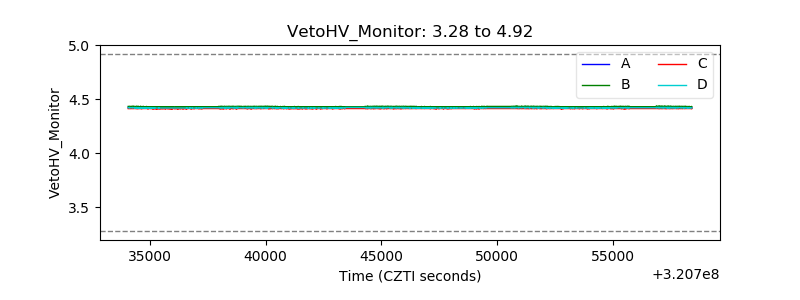 |
| Veto LLD | 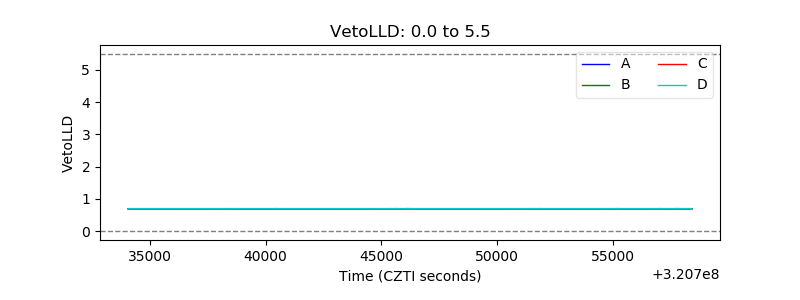 |
| Alpha Counter | 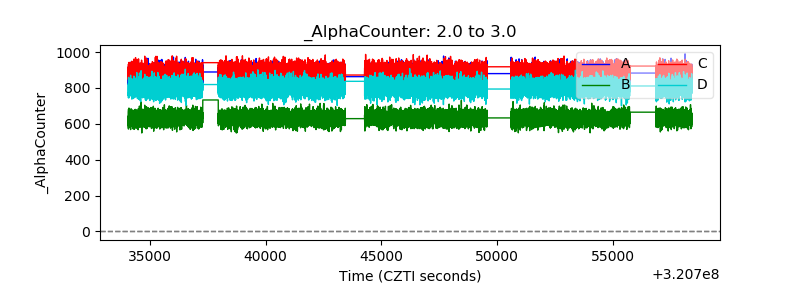 |
| _CPM_Rate | 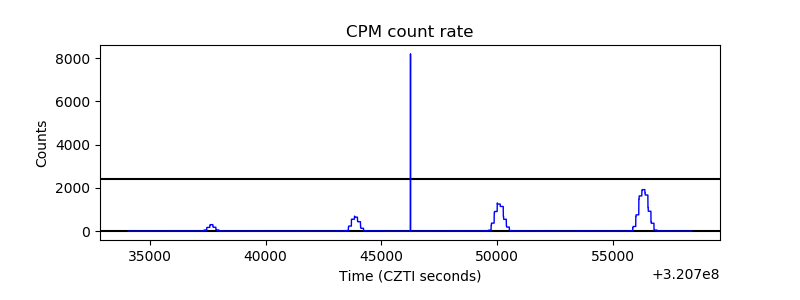 |
| CZT Counter | 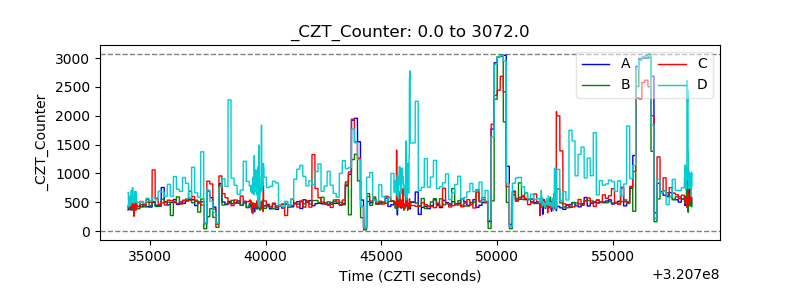 |
| +2.5 Volts monitor |  |
| +5 Volts monitor |  |
| _ROLL_ROT | 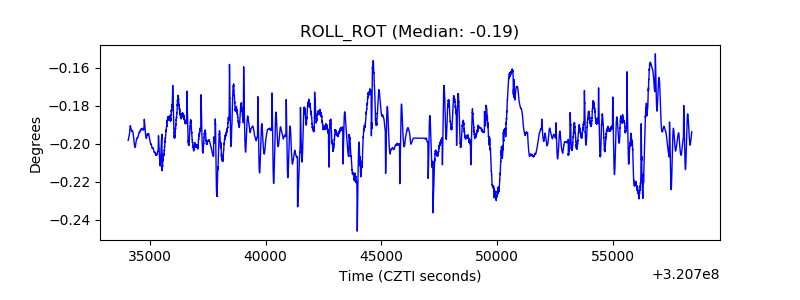 |
| _Roll_DEC | 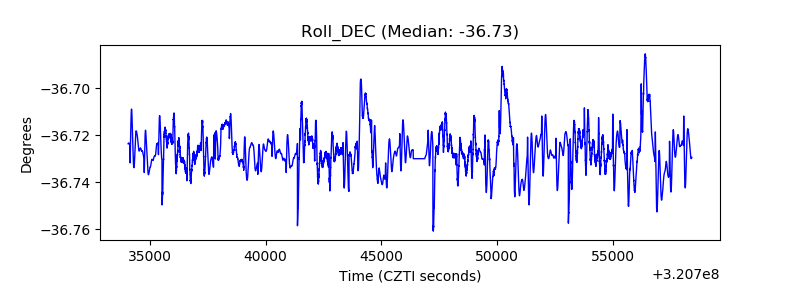 |
| _Roll_RA | 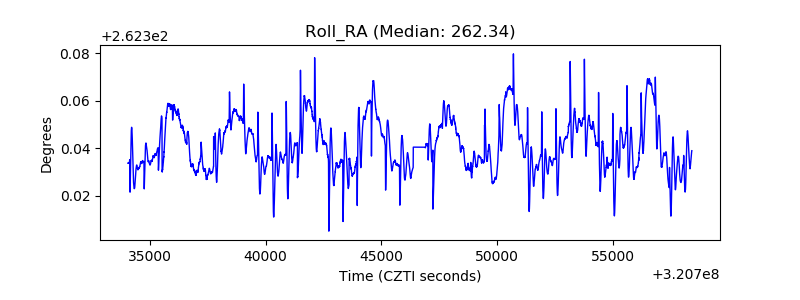 |
| Veto Counter | 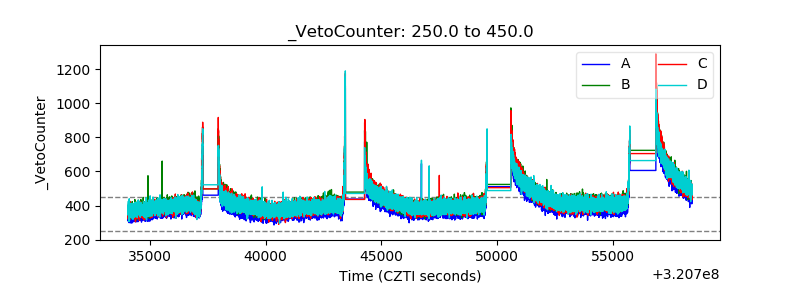 |