| Param | Original file | Final file |
|---|---|---|
| Filename | modeM0/AS1A07_142T01_9000003540_23926cztM0_level2.evt | modeM0/AS1A07_142T01_9000003540_23926cztM0_level2_quad_clean.evt |
| Size (bytes) | 574,459,200 | 78,851,520 |
| Size | 547.8 MB | 75.2 MB |
| Events in quadrant A | 3,647,185 | 503,371 |
| Events in quadrant B | 3,680,094 | 509,709 |
| Events in quadrant C | 4,510,182 | 461,213 |
| Events in quadrant D | 5,121,656 | 461,272 |
| Mode M9 | |||
|---|---|---|---|
| Quadrant | BADHDUFLAG | Total packets | Discarded packets |
| A | 0 | 15 | 0 |
| B | 0 | 16 | 0 |
| C | 0 | 16 | 0 |
| D | 0 | 16 | 0 |
| Mode M0 | |||
|---|---|---|---|
| Quadrant | BADHDUFLAG | Total packets | Discarded packets |
| A | 0 | 14934 | 1 |
| B | 0 | 15006 | 1 |
| C | 0 | 17888 | 1 |
| D | 0 | 20044 | 1 |
| Mode SS | |||
|---|---|---|---|
| Quadrant | BADHDUFLAG | Total packets | Discarded packets |
| A | 0 | 130 | 0 |
| B | 0 | 130 | 0 |
| C | 0 | 130 | 0 |
| D | 0 | 130 | 0 |
| Quadrant | Total seconds | Saturated seconds | Saturation percentage |
|---|---|---|---|
| A | 6486 | 90 | 1.387604% |
| B | 6486 | 113 | 1.742214% |
| C | 6486 | 295 | 4.548258% |
| D | 6486 | 171 | 2.636448% |
Noise dominated data is calculated using 1-second bins in cleaned event files. If a bin has >2000 counts, and if more than 50% of those come from <1% of pixels, then it is considered to be noise-dominated and hence unusable.
| Quadrant | # 1 sec bins | Bins with >0 counts | Bins with >2000 counts | High rate bins dominated by noise | Noise dominated (total time) | Noise dominated (detector-on time) | Marked lightcurve |
|---|---|---|---|---|---|---|---|
| A | 7806 | 6487 | 0 | 0 | 0.00% | 0.00% | 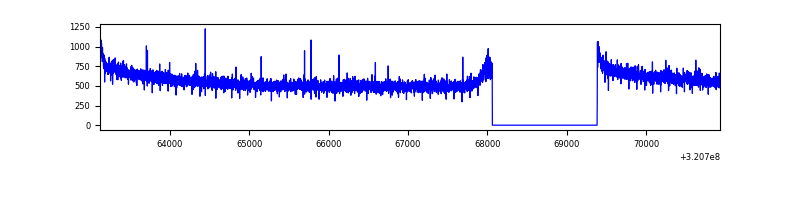 |
| B | 7806 | 6487 | 7 | 7 | 0.09% | 0.11% | 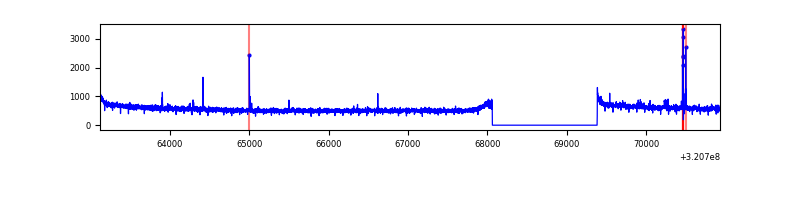 |
| C | 7806 | 6487 | 93 | 93 | 1.19% | 1.43% | 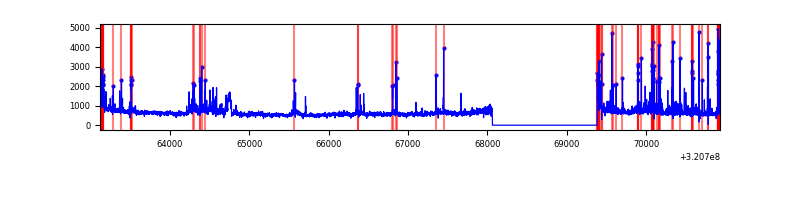 |
| D | 7806 | 6487 | 60 | 60 | 0.77% | 0.92% | 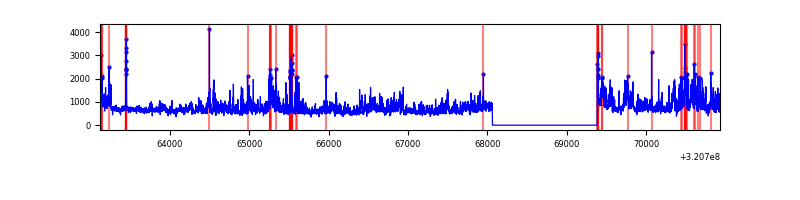 |
Top three noisy pixels from each quadrant. If the there are fewer than three noisy pixels in the level2.evt file, extra rows are filled as -1
| Pixel properties | Quadrant properties | ||||||
|---|---|---|---|---|---|---|---|
| Quadrant | DetID | PixID | Counts | Sigma | Mean | Median | Sigma |
| A | 13 | 254 | 11003 | 54.43 | 946 | 930 | 185.1 |
| A | 0 | 226 | 8432 | 40.54 | 946 | 930 | 185.1 |
| A | 3 | 137 | 7421 | 35.07 | 946 | 930 | 185.1 |
| B | 5 | 172 | 23063 | 130.89 | 925 | 906 | 169.3 |
| B | 12 | 111 | 19126 | 107.63 | 925 | 906 | 169.3 |
| B | 11 | 111 | 17013 | 95.15 | 925 | 906 | 169.3 |
| C | 10 | 9 | 923866 | 4703.87 | 863 | 873 | 196.2 |
| C | 14 | 238 | 140777 | 713.0 | 863 | 873 | 196.2 |
| C | 0 | 10 | 77011 | 388.02 | 863 | 873 | 196.2 |
| D | 8 | 195 | 882515 | 4086.51 | 900 | 875 | 215.7 |
| D | 1 | 52 | 615186 | 2847.41 | 900 | 875 | 215.7 |
| D | 12 | 218 | 141850 | 653.43 | 900 | 875 | 215.7 |
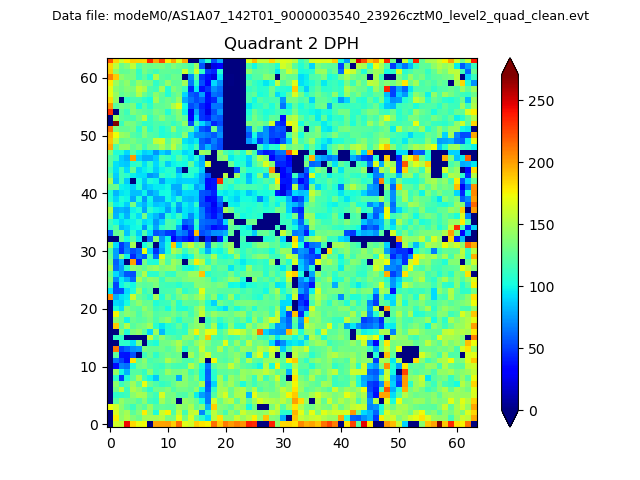
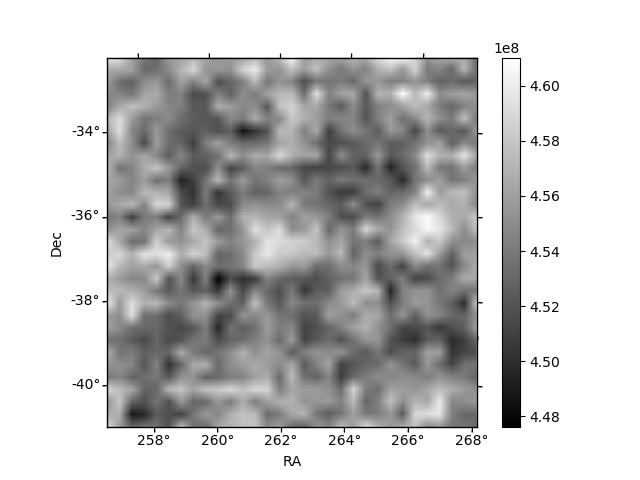
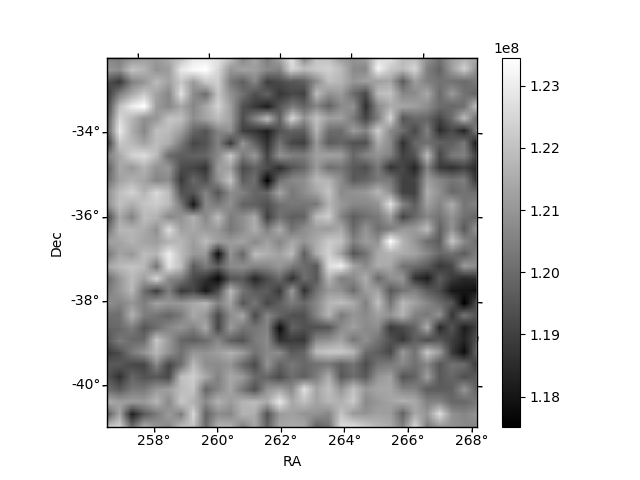
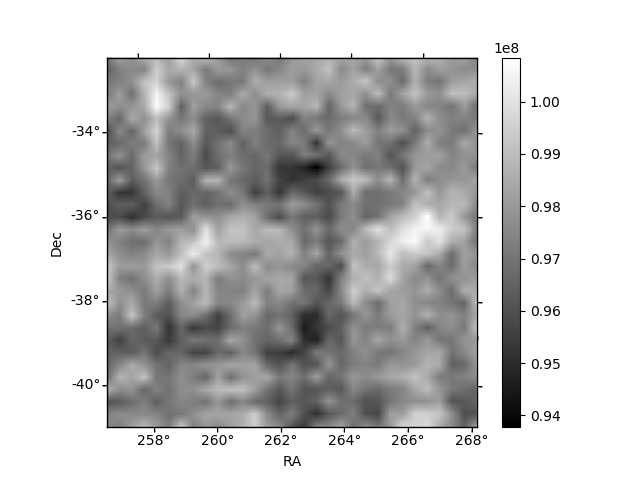
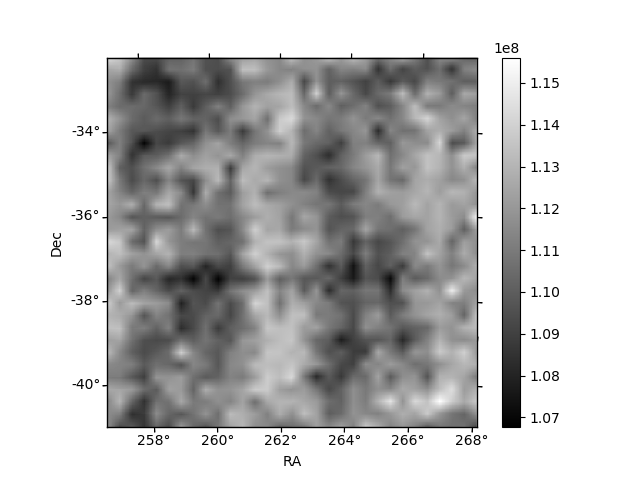
Histogram calculated using DETX and DETY for each event in the final _common_clean file
| Quadrant A | 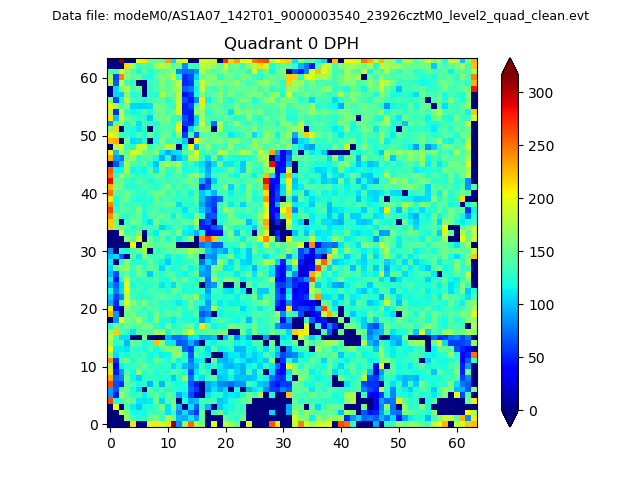 |
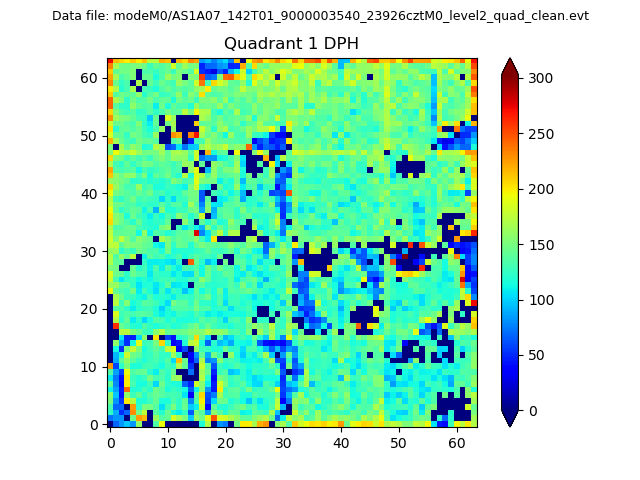 |
Quadrant B |
|---|---|---|---|
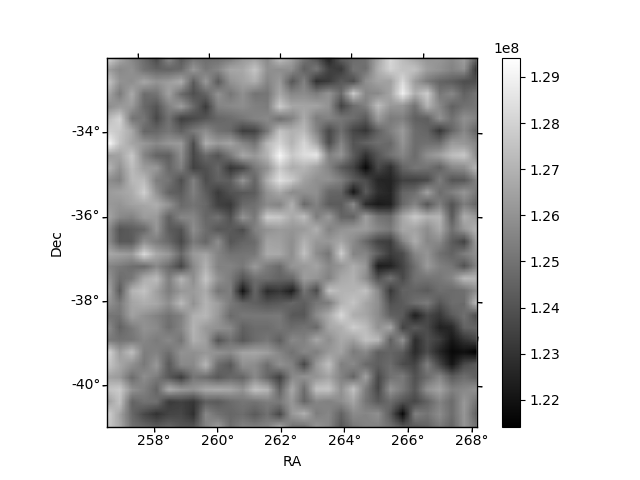
| Quadrant D | 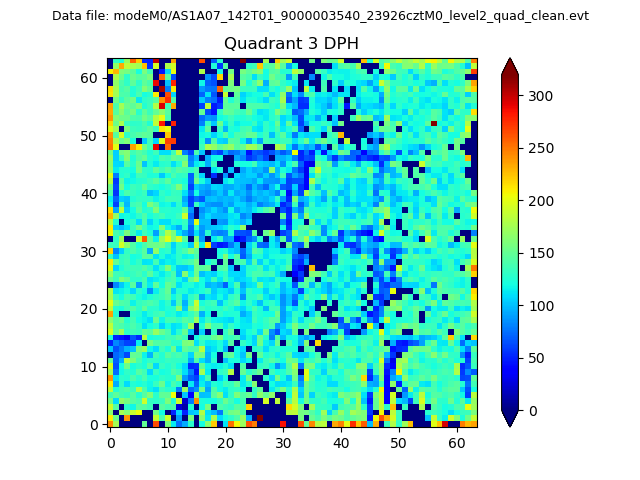 |
 |
Quadrant C |
| Plot type | Count rate plots | Images |
|---|---|---|
| Comparison with Poisson distribution Blue bars denote a histogram of data divided into 1 sec bins. Red curve is a Poisson curve with rate = median count rate of data. |
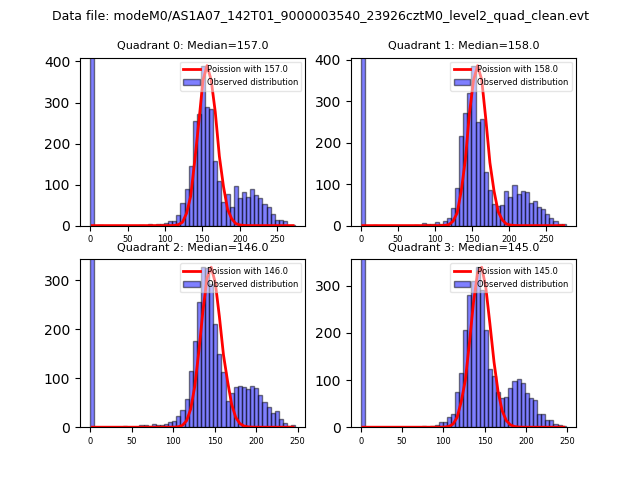 |
 |
| Quadrant-wise count rates Data is divided into 100 sec bins |
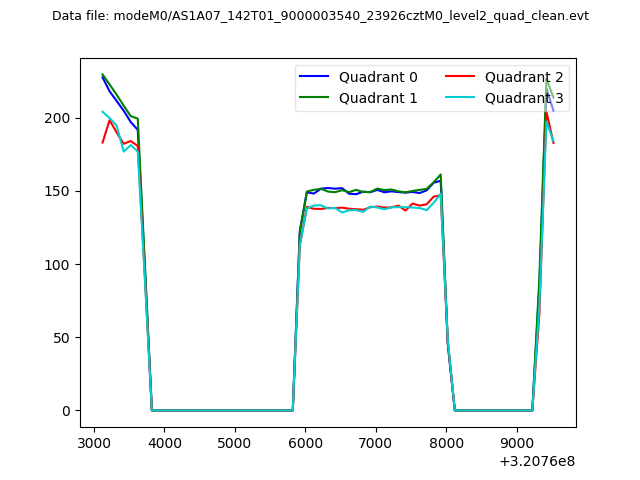 |
|
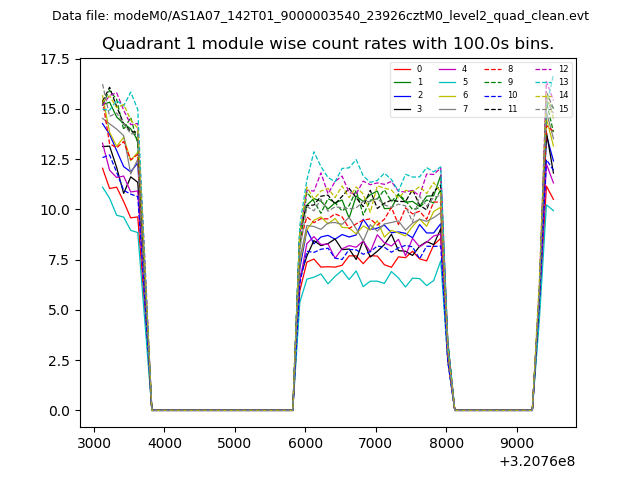
| Module-wise count rates for Quadrant A Data is divided into 100 sec bins |
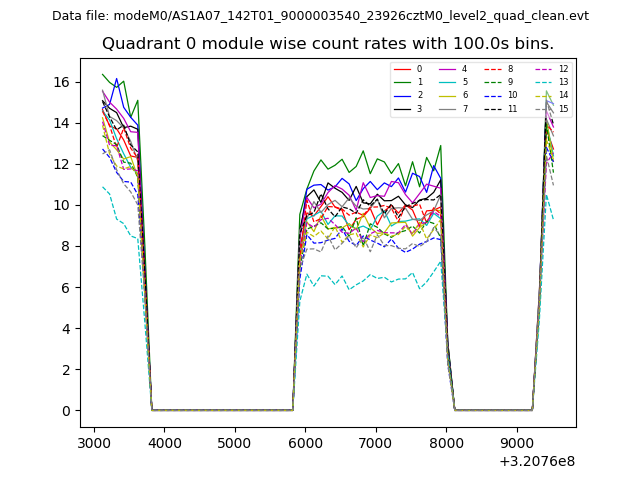 |
 |
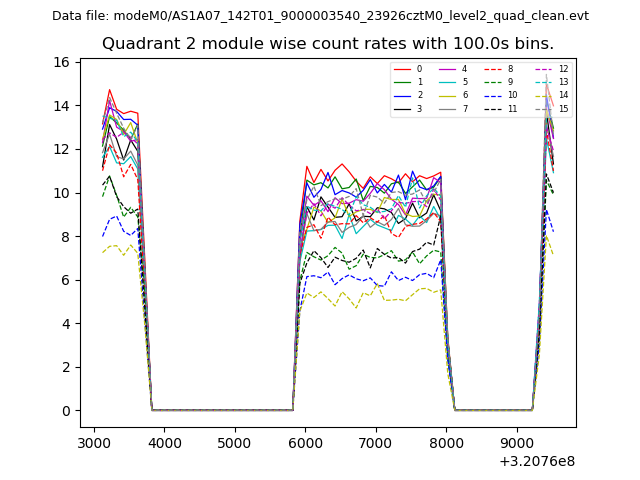
| Module-wise count rates for Quadrant B Data is divided into 100 sec bins |
 |
 |
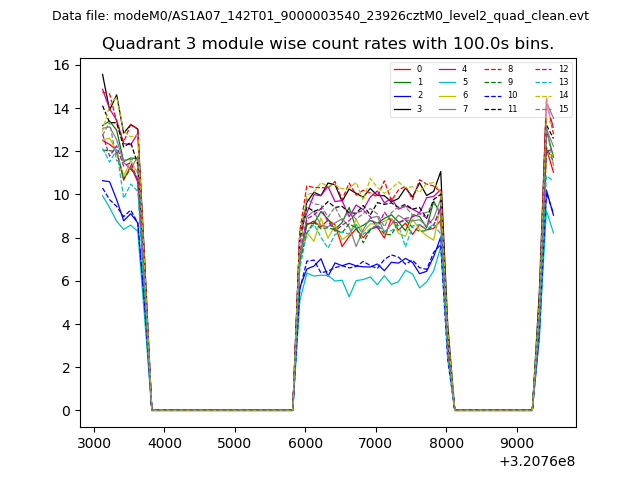
| Module-wise count rates for Quadrant C Data is divided into 100 sec bins |
 |
 |
| Module-wise count rates for Quadrant D Data is divided into 100 sec bins |
 |
 |
| Parameter | Plot |
|---|---|
| CZT HV Monitor | 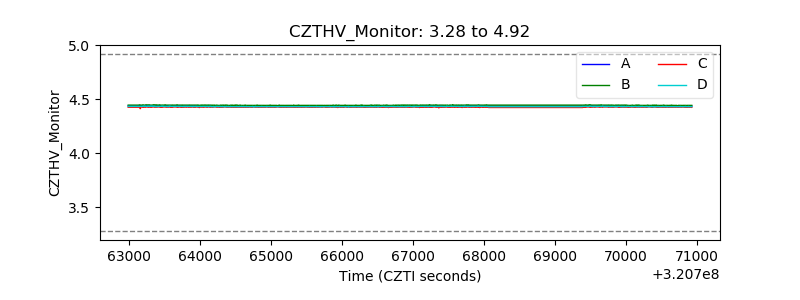 |
| D_VDD | 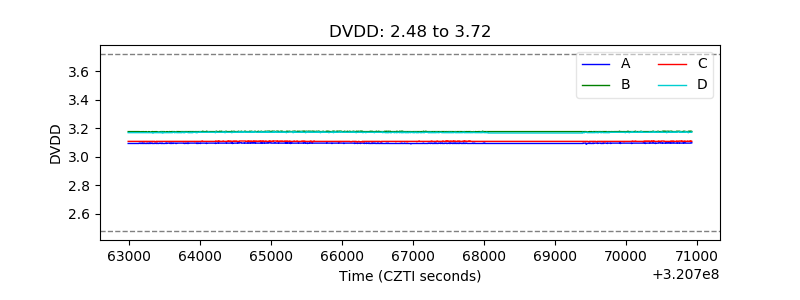 |
| Temperature 1 | 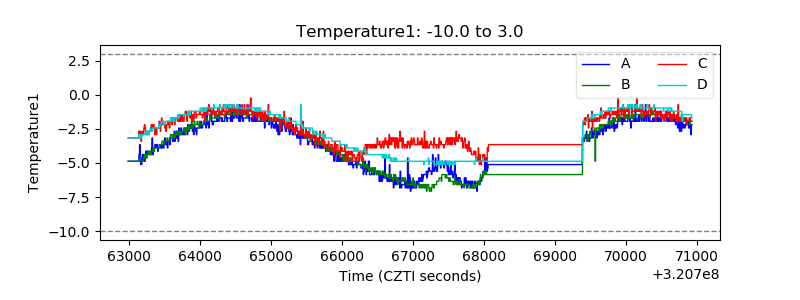 |
| Veto HV Monitor | 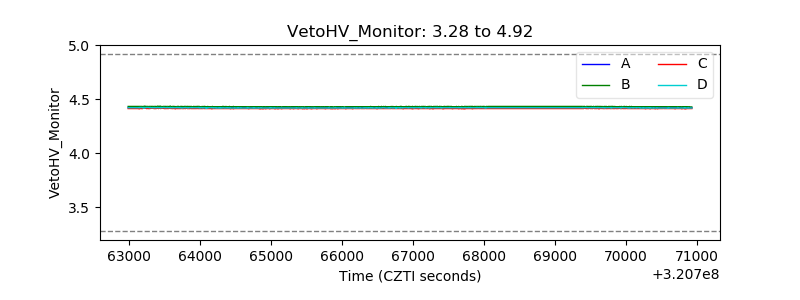 |
| Veto LLD | 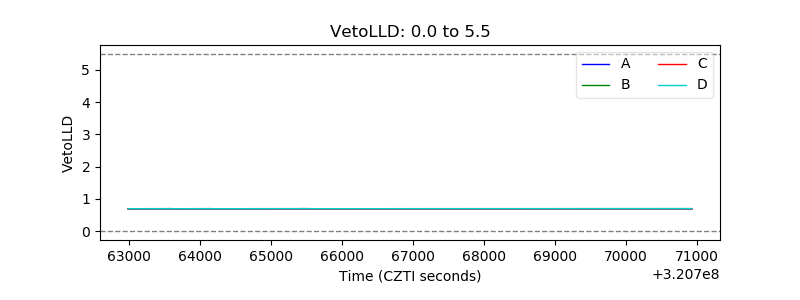 |
| Alpha Counter | 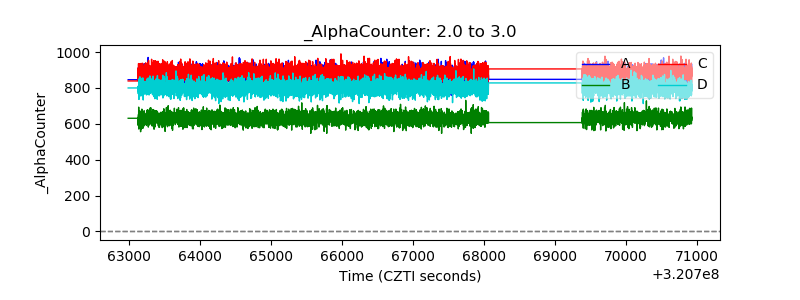 |
| _CPM_Rate | 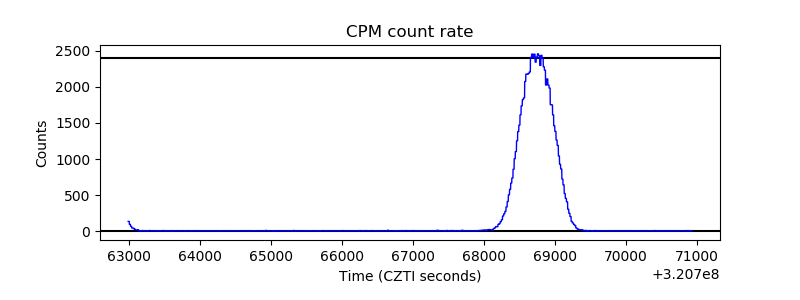 |
| CZT Counter | 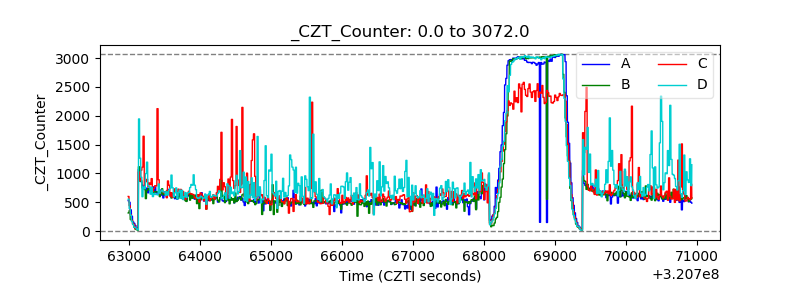 |
| +2.5 Volts monitor |  |
| +5 Volts monitor | 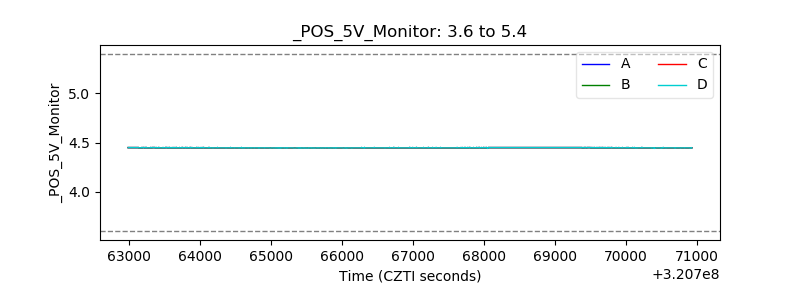 |
| _ROLL_ROT | 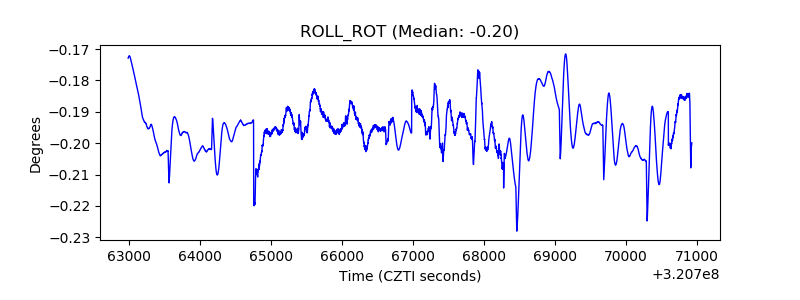 |
| _Roll_DEC | 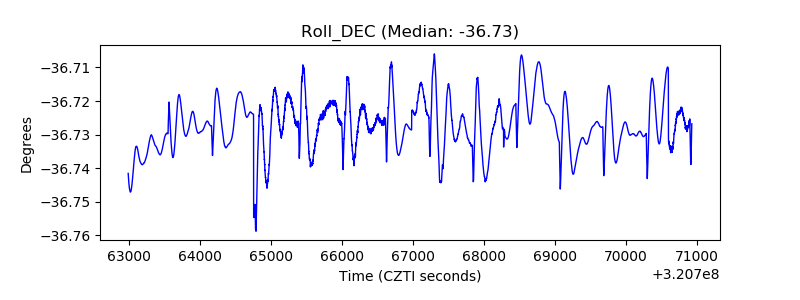 |
| _Roll_RA | 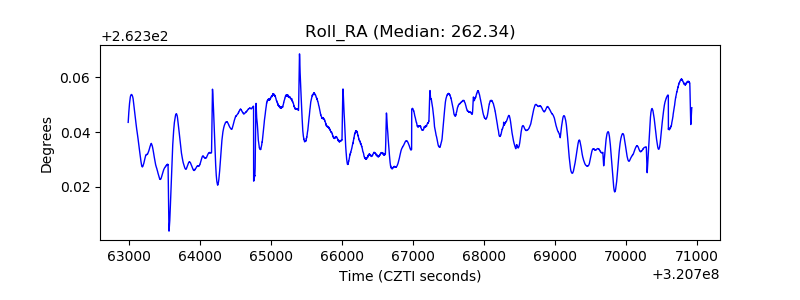 |
| Veto Counter | 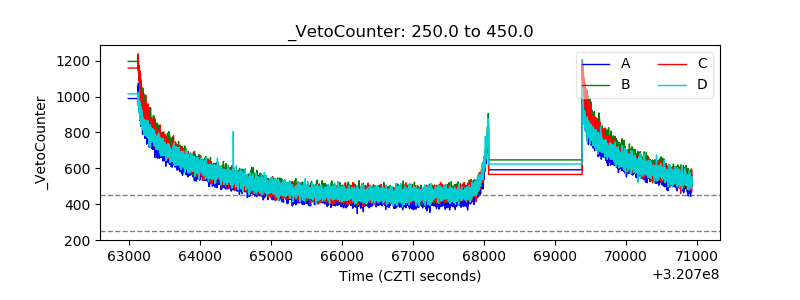 |