| Param | Original file | Final file |
|---|---|---|
| Filename | modeM0/AS1A07_142T01_9000003540_23927cztM0_level2.evt | modeM0/AS1A07_142T01_9000003540_23927cztM0_level2_quad_clean.evt |
| Size (bytes) | 613,863,360 | 68,875,200 |
| Size | 585.4 MB | 65.7 MB |
| Events in quadrant A | 3,545,323 | 431,055 |
| Events in quadrant B | 3,611,407 | 435,307 |
| Events in quadrant C | 4,999,506 | 384,274 |
| Events in quadrant D | 6,009,303 | 395,645 |
| Mode M9 | |||
|---|---|---|---|
| Quadrant | BADHDUFLAG | Total packets | Discarded packets |
| A | 0 | 14 | 0 |
| B | 0 | 15 | 0 |
| C | 0 | 15 | 0 |
| D | 0 | 15 | 0 |
| Mode M0 | |||
|---|---|---|---|
| Quadrant | BADHDUFLAG | Total packets | Discarded packets |
| A | 0 | 14502 | 1 |
| B | 0 | 14718 | 1 |
| C | 0 | 19121 | 1 |
| D | 0 | 22250 | 1 |
| Mode SS | |||
|---|---|---|---|
| Quadrant | BADHDUFLAG | Total packets | Discarded packets |
| A | 0 | 126 | 0 |
| B | 0 | 126 | 0 |
| C | 0 | 126 | 0 |
| D | 0 | 126 | 0 |
| Quadrant | Total seconds | Saturated seconds | Saturation percentage |
|---|---|---|---|
| A | 6297 | 98 | 1.556297% |
| B | 6297 | 117 | 1.858028% |
| C | 6297 | 616 | 9.782436% |
| D | 6296 | 625 | 9.926938% |
Noise dominated data is calculated using 1-second bins in cleaned event files. If a bin has >2000 counts, and if more than 50% of those come from <1% of pixels, then it is considered to be noise-dominated and hence unusable.
| Quadrant | # 1 sec bins | Bins with >0 counts | Bins with >2000 counts | High rate bins dominated by noise | Noise dominated (total time) | Noise dominated (detector-on time) | Marked lightcurve |
|---|---|---|---|---|---|---|---|
| A | 7637 | 6298 | 0 | 0 | 0.00% | 0.00% | 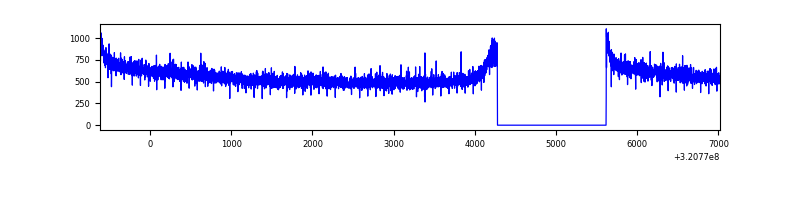 |
| B | 7637 | 6298 | 6 | 6 | 0.08% | 0.10% | 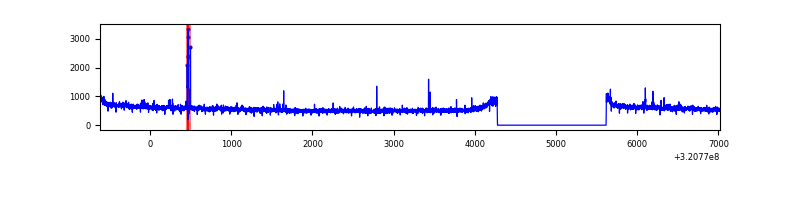 |
| C | 7637 | 6297 | 341 | 341 | 4.47% | 5.42% | 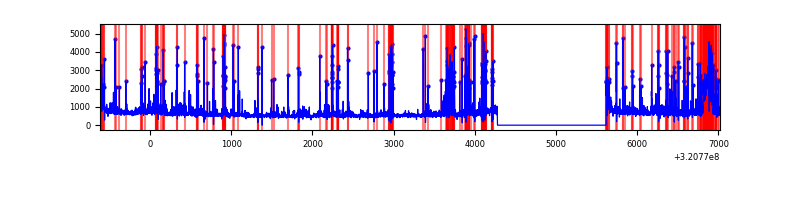 |
| D | 7636 | 6297 | 437 | 437 | 5.72% | 6.94% | 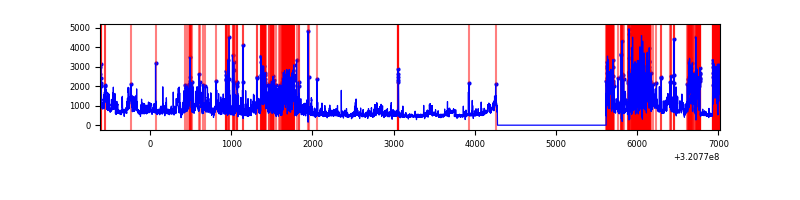 |
Top three noisy pixels from each quadrant. If the there are fewer than three noisy pixels in the level2.evt file, extra rows are filled as -1
| Pixel properties | Quadrant properties | ||||||
|---|---|---|---|---|---|---|---|
| Quadrant | DetID | PixID | Counts | Sigma | Mean | Median | Sigma |
| A | 2 | 250 | 20452 | 108.67 | 915 | 901 | 179.9 |
| A | 13 | 254 | 10381 | 52.69 | 915 | 901 | 179.9 |
| A | 0 | 226 | 7989 | 39.4 | 915 | 901 | 179.9 |
| B | 5 | 172 | 24045 | 138.18 | 901 | 885 | 167.6 |
| B | 0 | 189 | 23253 | 133.46 | 901 | 885 | 167.6 |
| B | 0 | 219 | 21748 | 124.48 | 901 | 885 | 167.6 |
| C | 10 | 9 | 1406473 | 7499.67 | 815 | 822 | 187.4 |
| C | 7 | 247 | 187724 | 997.19 | 815 | 822 | 187.4 |
| C | 14 | 238 | 132076 | 700.29 | 815 | 822 | 187.4 |
| D | 12 | 218 | 1500820 | 7476.61 | 843 | 818 | 200.6 |
| D | 8 | 195 | 626400 | 3118.15 | 843 | 818 | 200.6 |
| D | 1 | 52 | 558286 | 2778.65 | 843 | 818 | 200.6 |
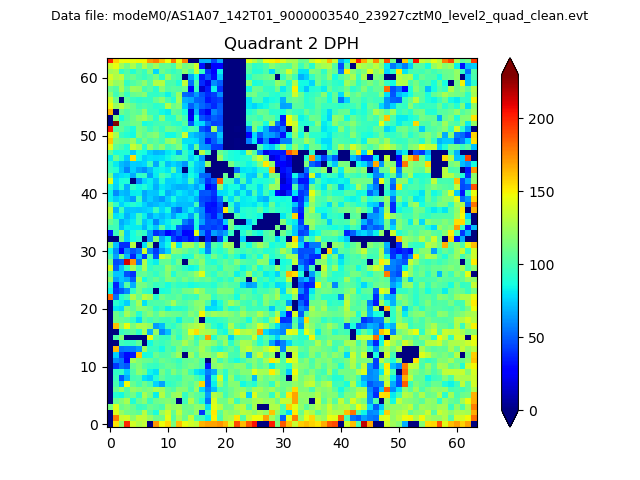
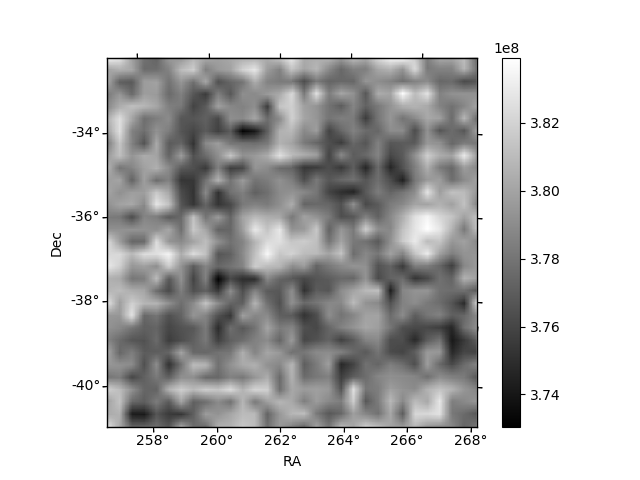
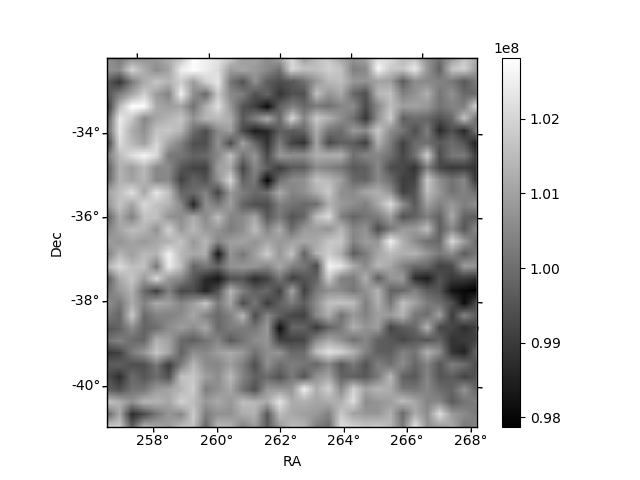
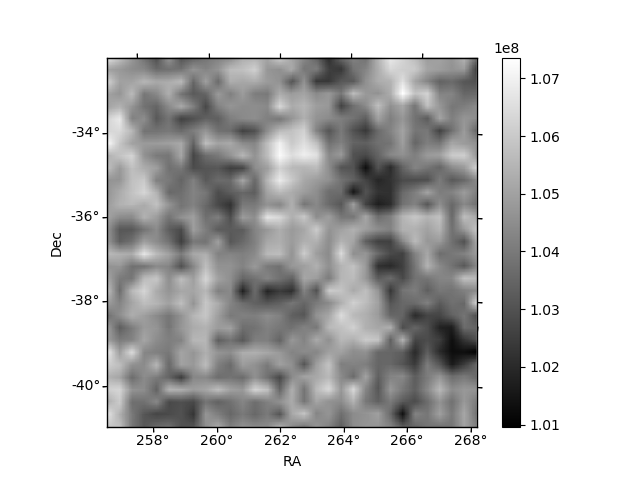
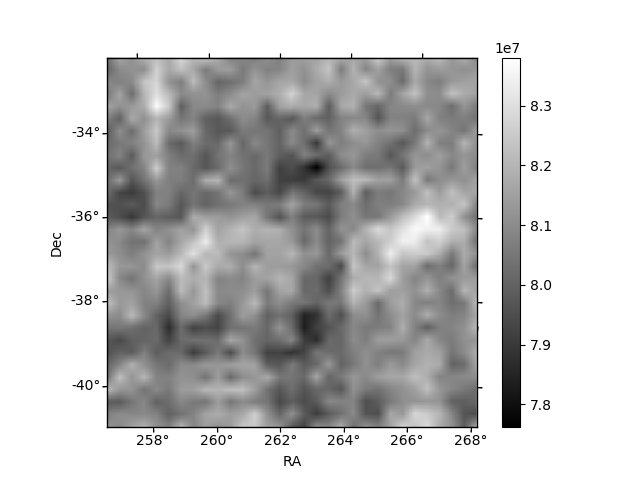
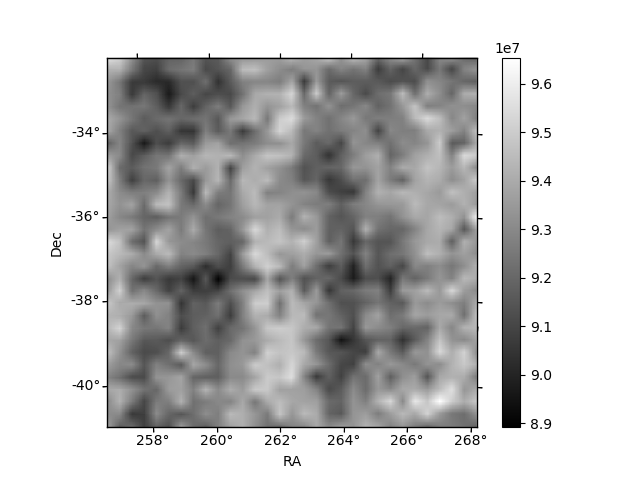
Histogram calculated using DETX and DETY for each event in the final _common_clean file
| Quadrant A | 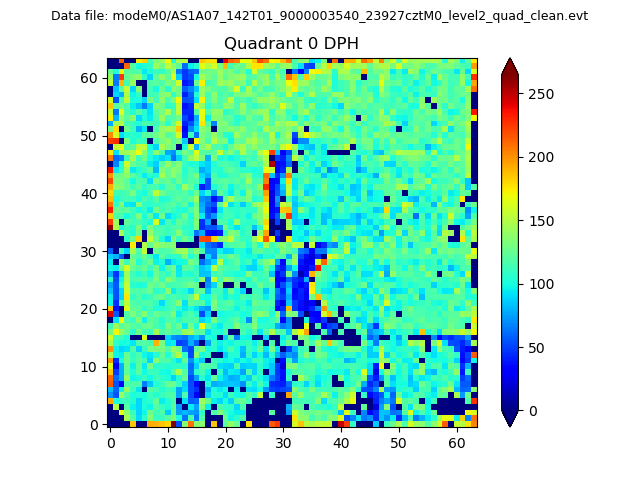 |
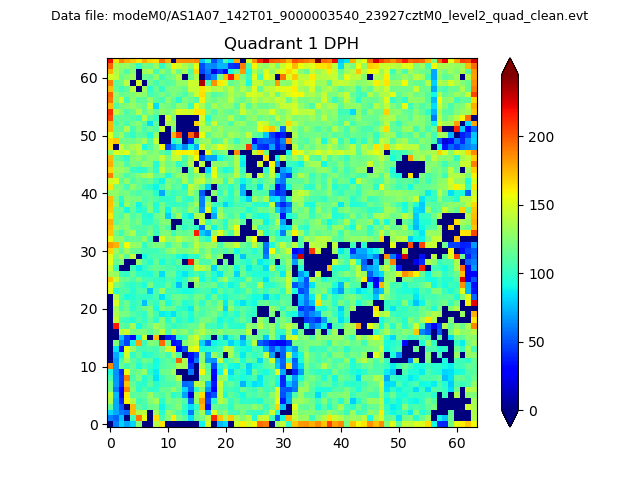 |
Quadrant B |
|---|---|---|---|
| Quadrant D | 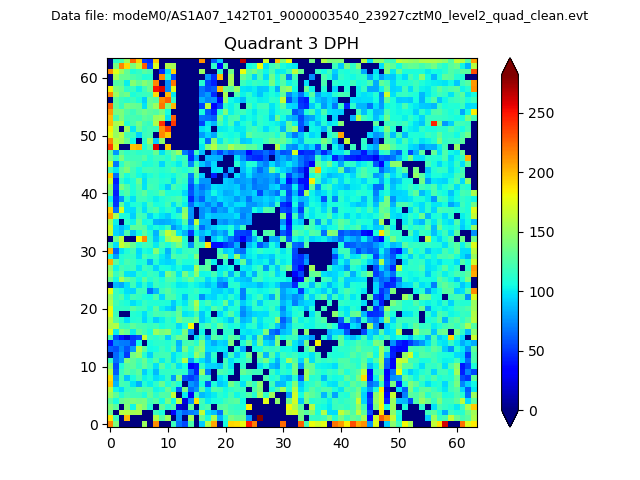 |
 |
Quadrant C |
| Plot type | Count rate plots | Images |
|---|---|---|
| Comparison with Poisson distribution Blue bars denote a histogram of data divided into 1 sec bins. Red curve is a Poisson curve with rate = median count rate of data. |
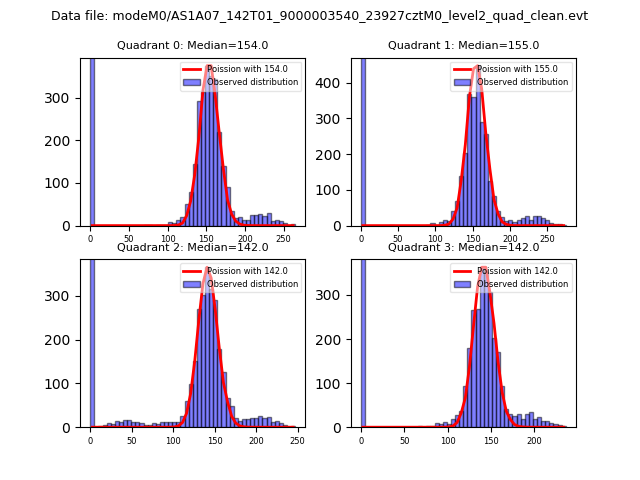 |
 |
| Quadrant-wise count rates Data is divided into 100 sec bins |
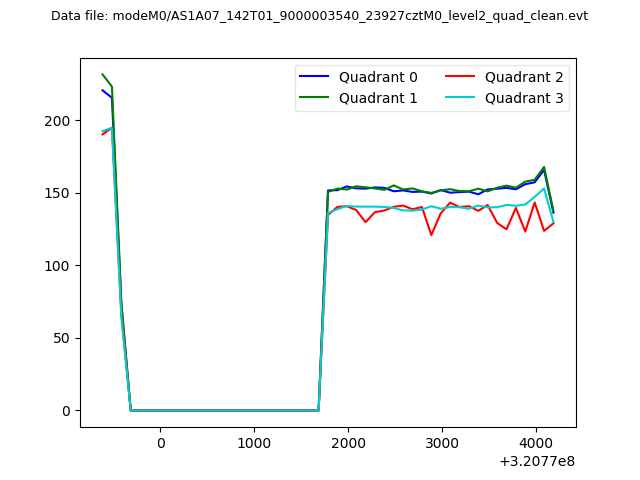 |
|
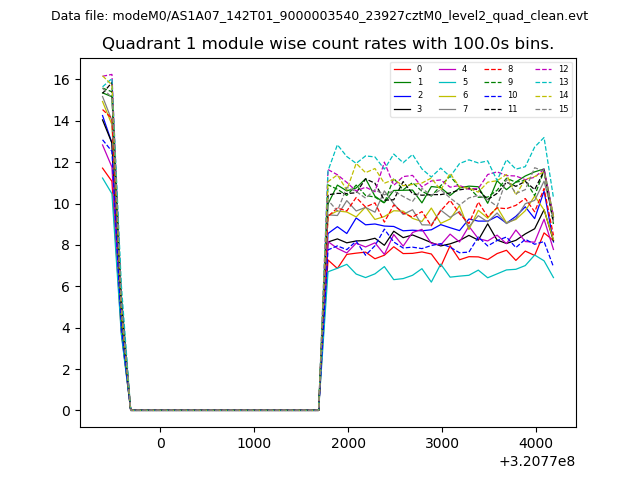
| Module-wise count rates for Quadrant A Data is divided into 100 sec bins |
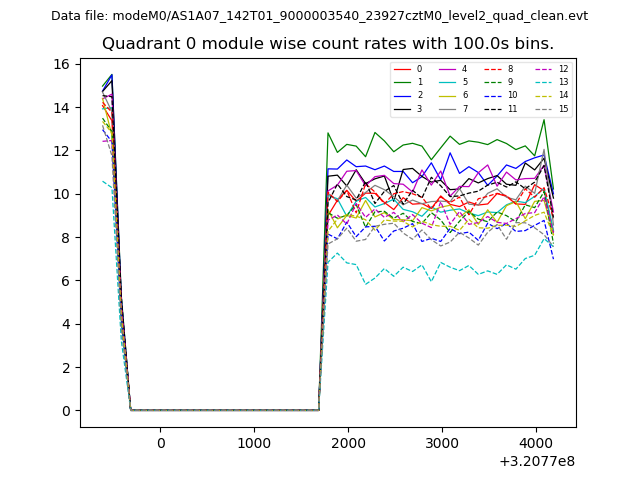 |
 |
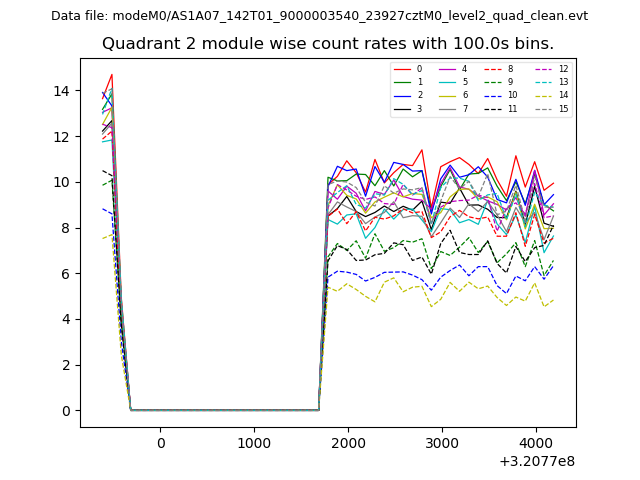
| Module-wise count rates for Quadrant B Data is divided into 100 sec bins |
 |
 |
| Module-wise count rates for Quadrant C Data is divided into 100 sec bins |
 |
 |
| Module-wise count rates for Quadrant D Data is divided into 100 sec bins |
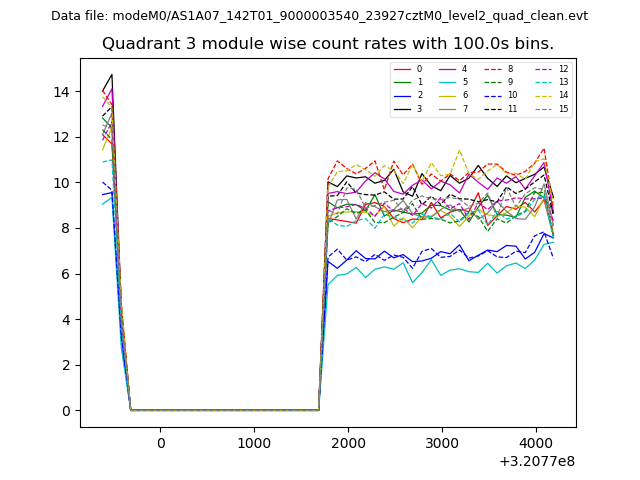 |
 |
| Parameter | Plot |
|---|---|
| CZT HV Monitor | 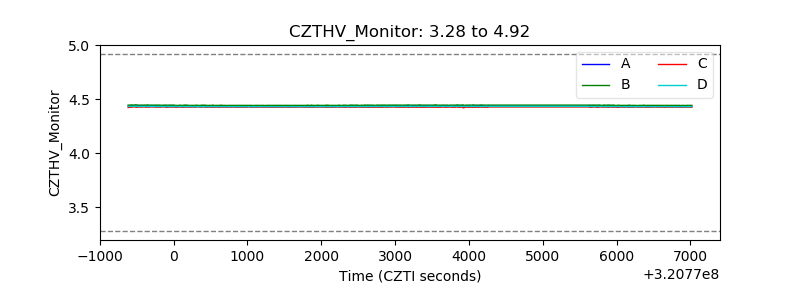 |
| D_VDD | 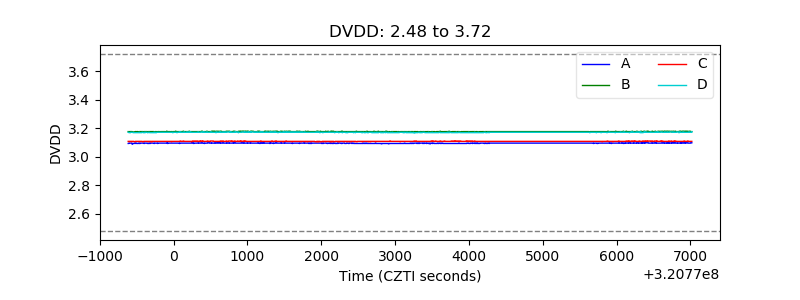 |
| Temperature 1 | 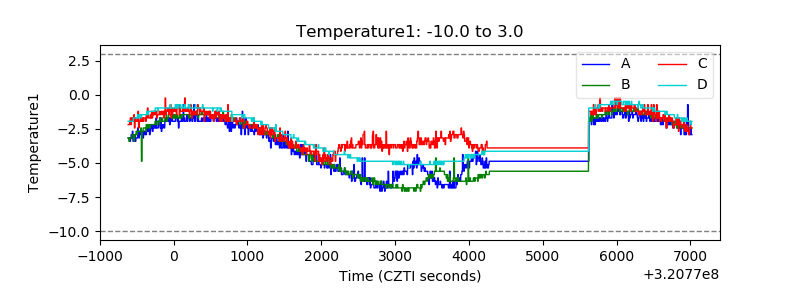 |
| Veto HV Monitor | 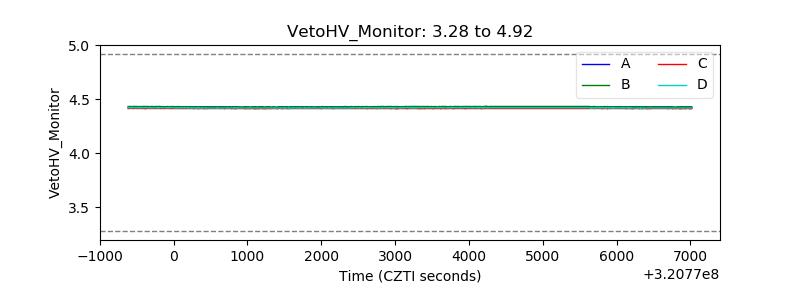 |
| Veto LLD | 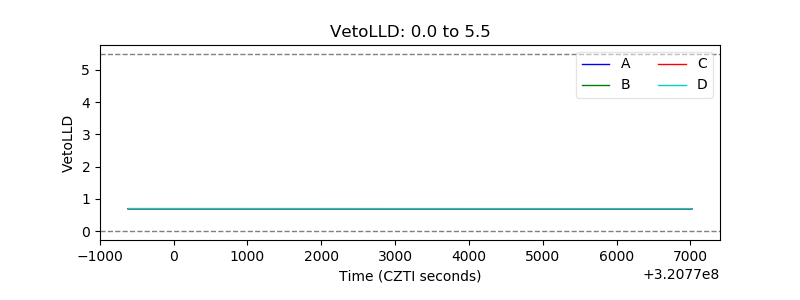 |
| Alpha Counter | 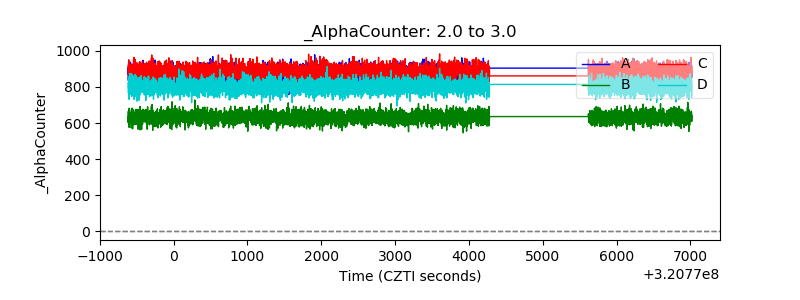 |
| _CPM_Rate | 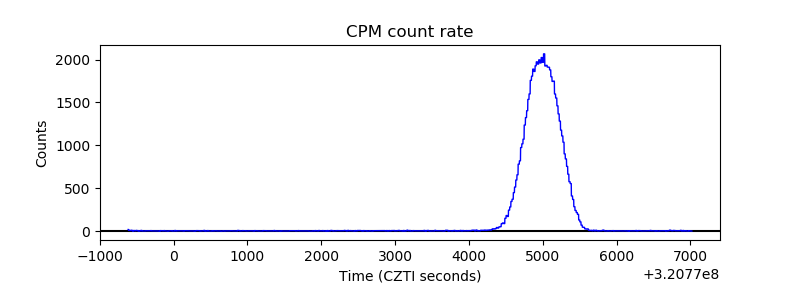 |
| CZT Counter | 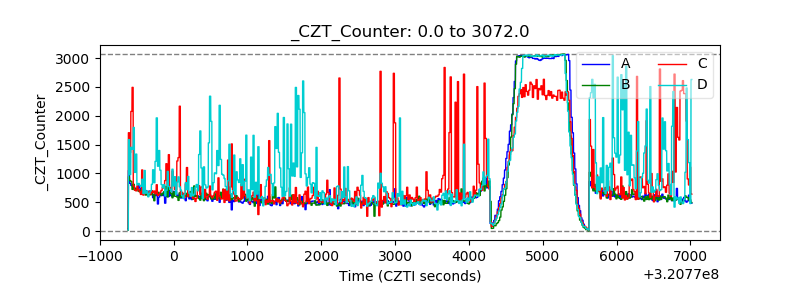 |
| +2.5 Volts monitor |  |
| +5 Volts monitor |  |
| _ROLL_ROT | 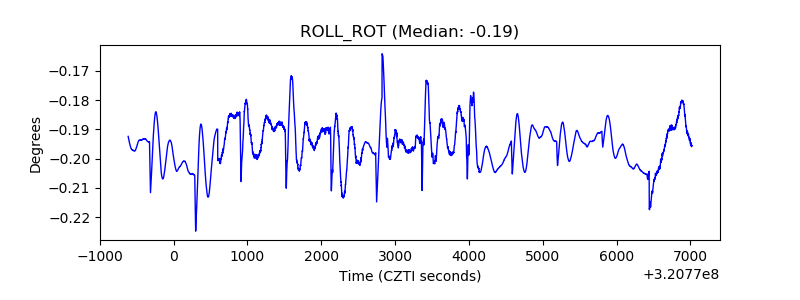 |
| _Roll_DEC | 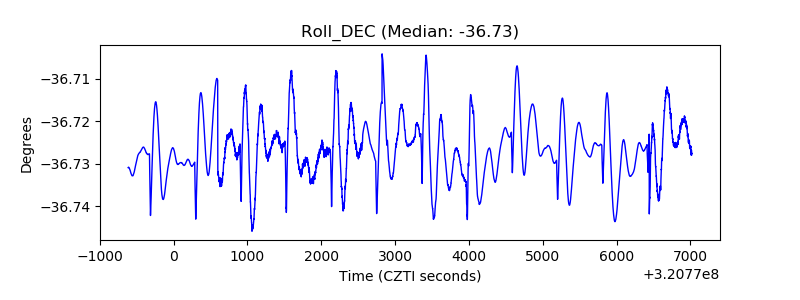 |
| _Roll_RA | 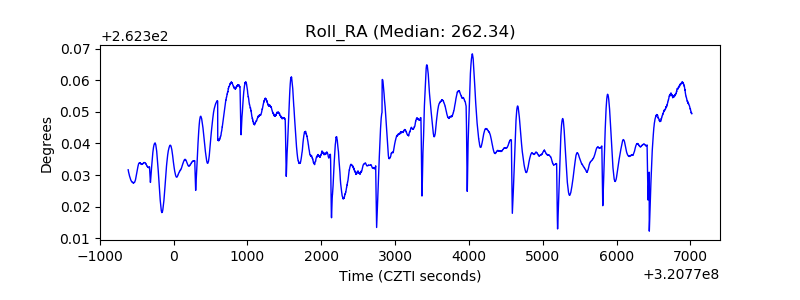 |
| Veto Counter | 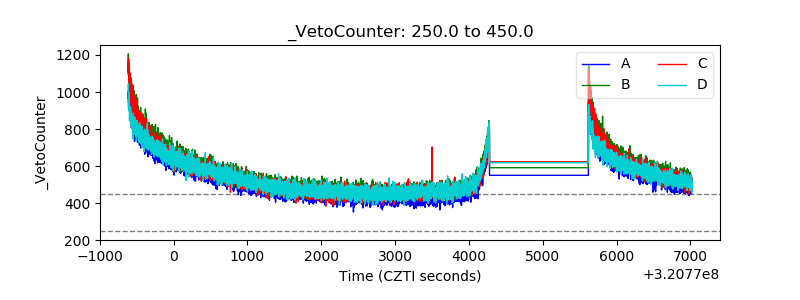 |