| Param | Original file | Final file |
|---|---|---|
| Filename | modeM0/AS1A07_142T01_9000003540_23928cztM0_level2.evt | modeM0/AS1A07_142T01_9000003540_23928cztM0_level2_quad_clean.evt |
| Size (bytes) | 719,389,440 | 68,621,760 |
| Size | 686.1 MB | 65.4 MB |
| Events in quadrant A | 3,296,740 | 447,099 |
| Events in quadrant B | 3,450,355 | 449,640 |
| Events in quadrant C | 4,473,828 | 409,478 |
| Events in quadrant D | 10,152,392 | 343,930 |
| Mode M9 | |||
|---|---|---|---|
| Quadrant | BADHDUFLAG | Total packets | Discarded packets |
| A | 0 | 12 | 0 |
| B | 0 | 12 | 0 |
| C | 0 | 12 | 0 |
| D | 0 | 12 | 0 |
| Mode M0 | |||
|---|---|---|---|
| Quadrant | BADHDUFLAG | Total packets | Discarded packets |
| A | 0 | 13375 | 1 |
| B | 0 | 13942 | 1 |
| C | 0 | 17240 | 1 |
| D | 0 | 34393 | 1 |
| Mode SS | |||
|---|---|---|---|
| Quadrant | BADHDUFLAG | Total packets | Discarded packets |
| A | 0 | 126 | 0 |
| B | 0 | 126 | 0 |
| C | 0 | 126 | 0 |
| D | 0 | 126 | 0 |
| Quadrant | Total seconds | Saturated seconds | Saturation percentage |
|---|---|---|---|
| A | 6110 | 111 | 1.816694% |
| B | 6111 | 153 | 2.503682% |
| C | 6111 | 496 | 8.116511% |
| D | 6111 | 2636 | 43.135330% |
Noise dominated data is calculated using 1-second bins in cleaned event files. If a bin has >2000 counts, and if more than 50% of those come from <1% of pixels, then it is considered to be noise-dominated and hence unusable.
| Quadrant | # 1 sec bins | Bins with >0 counts | Bins with >2000 counts | High rate bins dominated by noise | Noise dominated (total time) | Noise dominated (detector-on time) | Marked lightcurve |
|---|---|---|---|---|---|---|---|
| A | 7355 | 6111 | 0 | 0 | 0.00% | 0.00% | 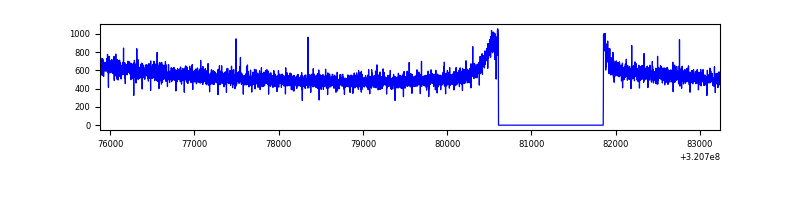 |
| B | 7356 | 6112 | 0 | 0 | 0.00% | 0.00% | 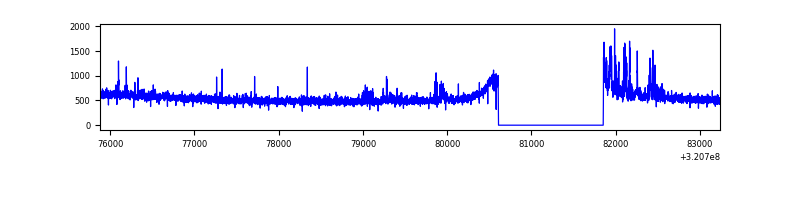 |
| C | 7356 | 6112 | 253 | 253 | 3.44% | 4.14% | 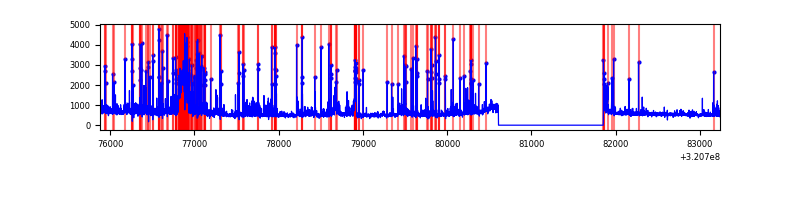 |
| D | 7356 | 6112 | 2193 | 2193 | 29.81% | 35.88% | 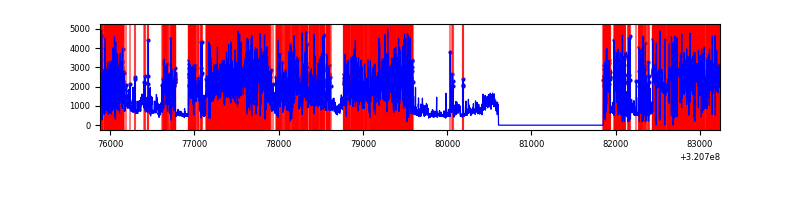 |
Top three noisy pixels from each quadrant. If the there are fewer than three noisy pixels in the level2.evt file, extra rows are filled as -1
| Pixel properties | Quadrant properties | ||||||
|---|---|---|---|---|---|---|---|
| Quadrant | DetID | PixID | Counts | Sigma | Mean | Median | Sigma |
| A | 2 | 250 | 40059 | 233.8 | 845 | 829 | 167.8 |
| A | 13 | 254 | 10298 | 56.43 | 845 | 829 | 167.8 |
| A | 0 | 226 | 7317 | 38.67 | 845 | 829 | 167.8 |
| B | 0 | 189 | 157342 | 1001.13 | 837 | 821 | 156.3 |
| B | 12 | 111 | 17695 | 107.93 | 837 | 821 | 156.3 |
| B | 11 | 111 | 15762 | 95.56 | 837 | 821 | 156.3 |
| C | 10 | 9 | 1111308 | 6261.07 | 770 | 776 | 177.4 |
| C | 7 | 247 | 199500 | 1120.39 | 770 | 776 | 177.4 |
| C | 14 | 238 | 124109 | 695.34 | 770 | 776 | 177.4 |
| D | 12 | 218 | 6444735 | 41524.2 | 643 | 625 | 155.2 |
| D | 1 | 52 | 781928 | 5034.52 | 643 | 625 | 155.2 |
| D | 8 | 195 | 429038 | 2760.58 | 643 | 625 | 155.2 |
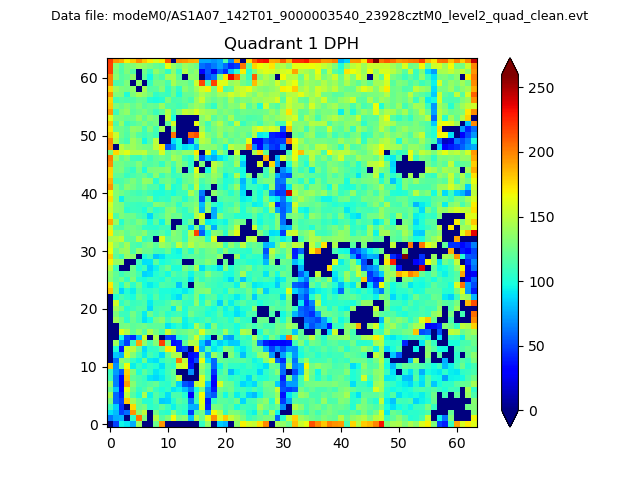
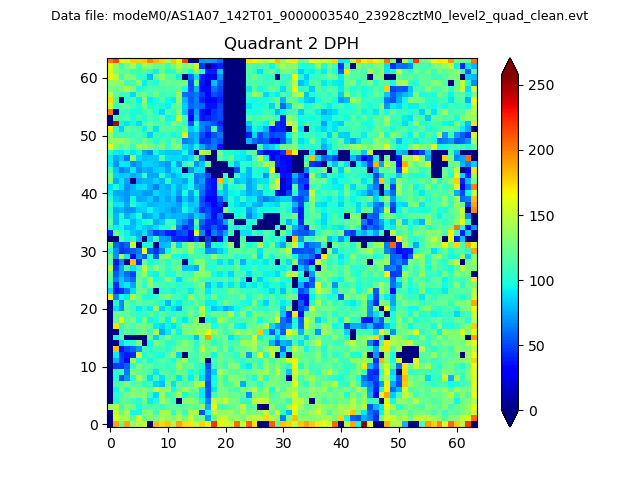
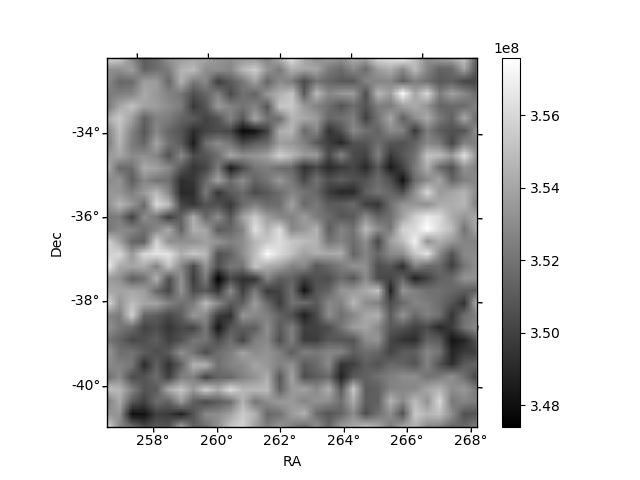
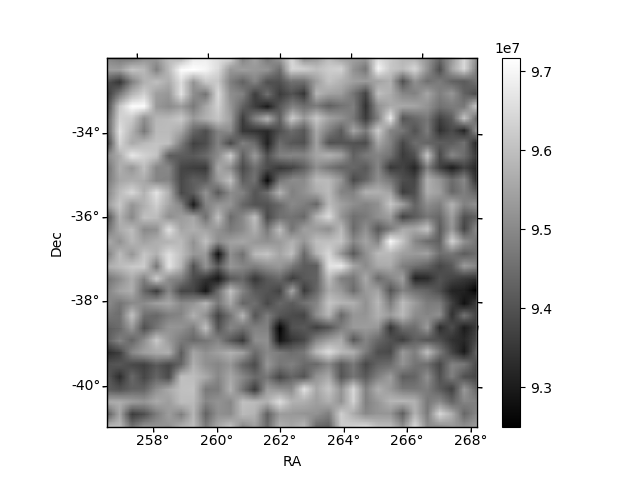
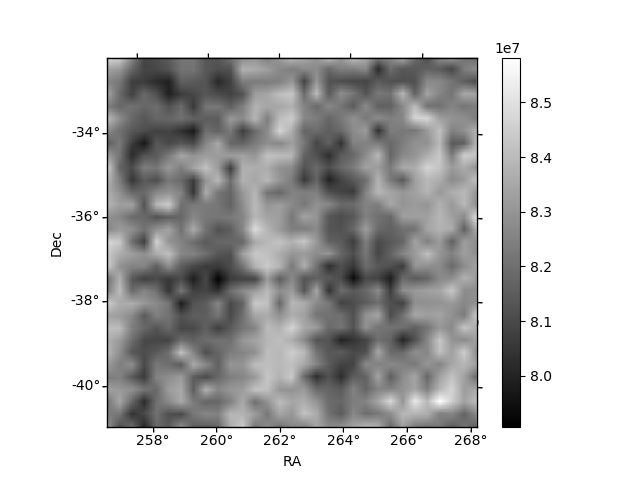
Histogram calculated using DETX and DETY for each event in the final _common_clean file
| Quadrant A |  |
 |
Quadrant B |
|---|---|---|---|
| Quadrant D | 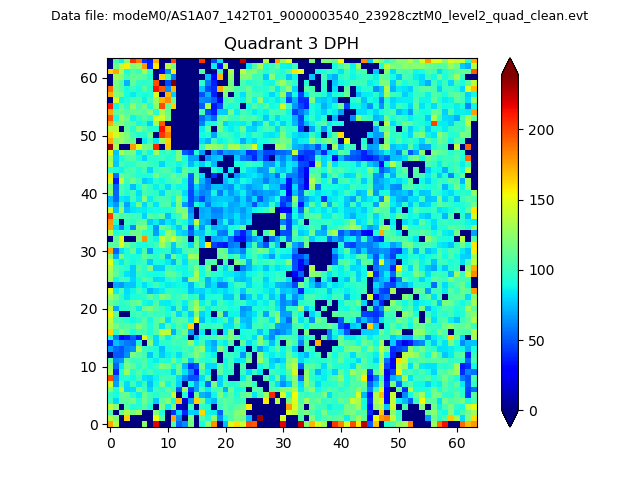 |
 |
Quadrant C |
| Plot type | Count rate plots | Images |
|---|---|---|
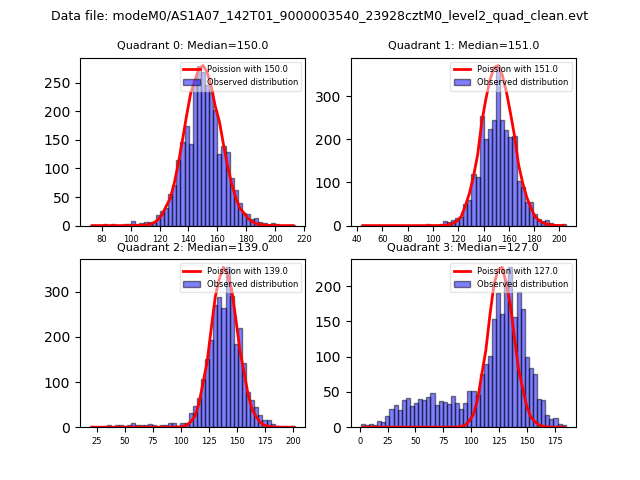
| Comparison with Poisson distribution Blue bars denote a histogram of data divided into 1 sec bins. Red curve is a Poisson curve with rate = median count rate of data. |
 |
 |
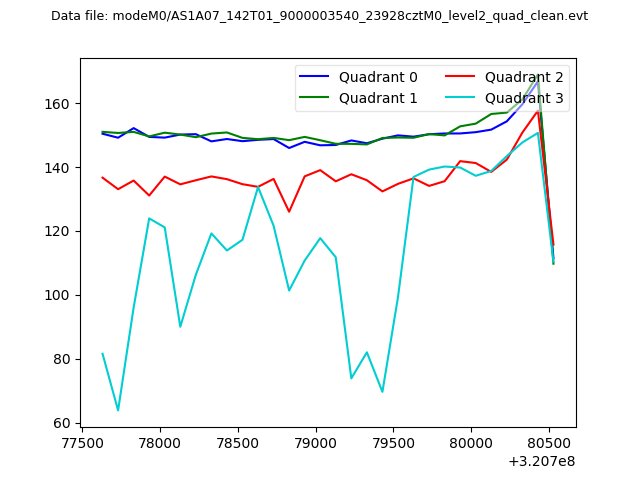
| Quadrant-wise count rates Data is divided into 100 sec bins |
 |
|
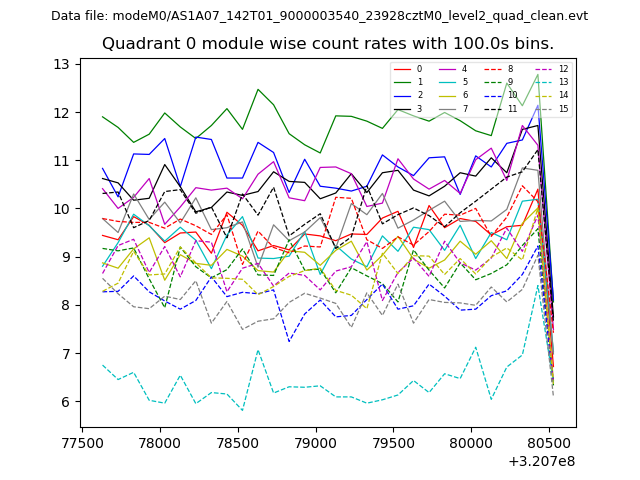
| Module-wise count rates for Quadrant A Data is divided into 100 sec bins |
 |
 |
| Module-wise count rates for Quadrant B Data is divided into 100 sec bins |
 |
 |
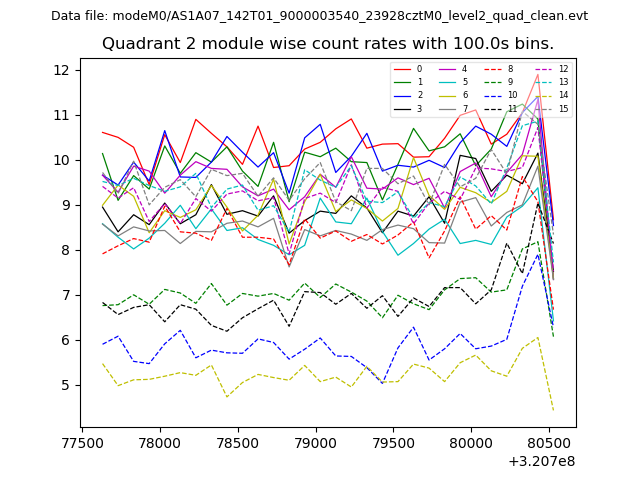
| Module-wise count rates for Quadrant C Data is divided into 100 sec bins |
 |
 |
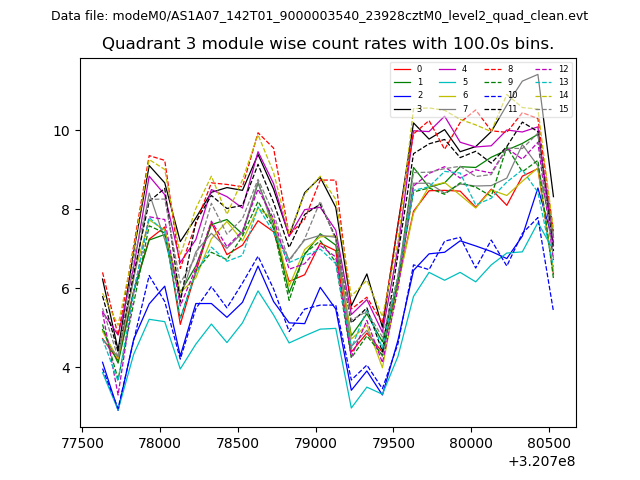
| Module-wise count rates for Quadrant D Data is divided into 100 sec bins |
 |
 |
| Parameter | Plot |
|---|---|
| CZT HV Monitor | 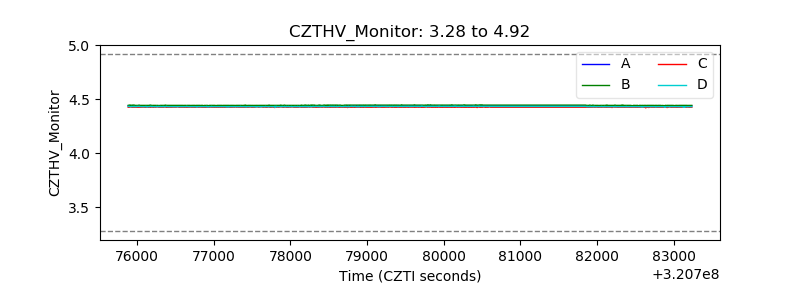 |
| D_VDD | 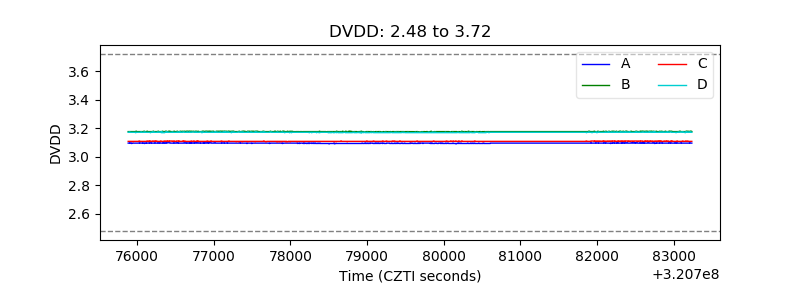 |
| Temperature 1 | 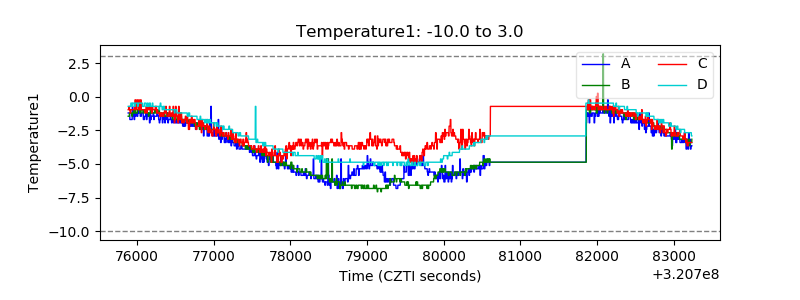 |
| Veto HV Monitor | 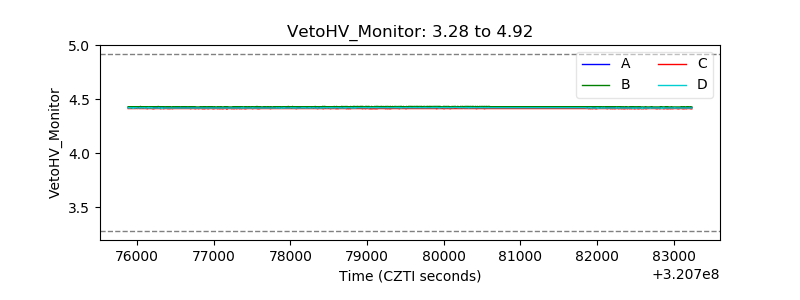 |
| Veto LLD | 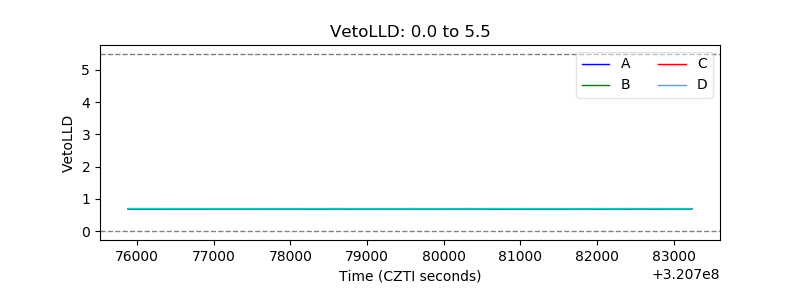 |
| Alpha Counter | 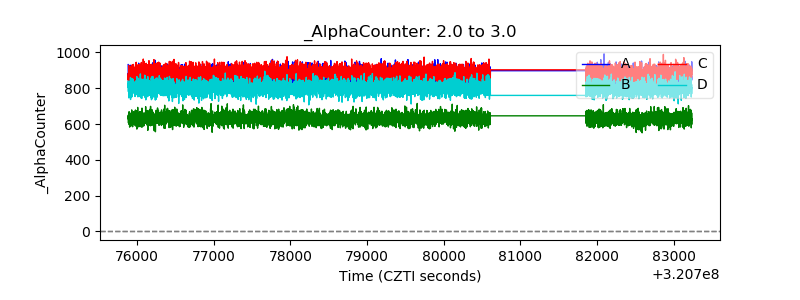 |
| _CPM_Rate | 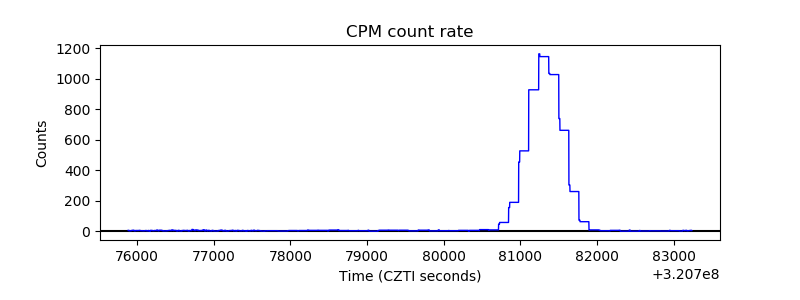 |
| CZT Counter | 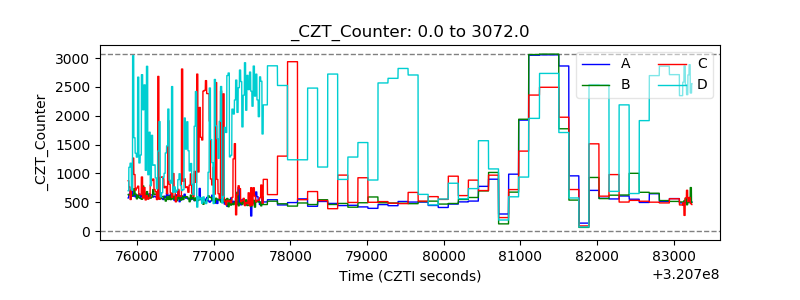 |
| +2.5 Volts monitor |  |
| +5 Volts monitor |  |
| _ROLL_ROT | 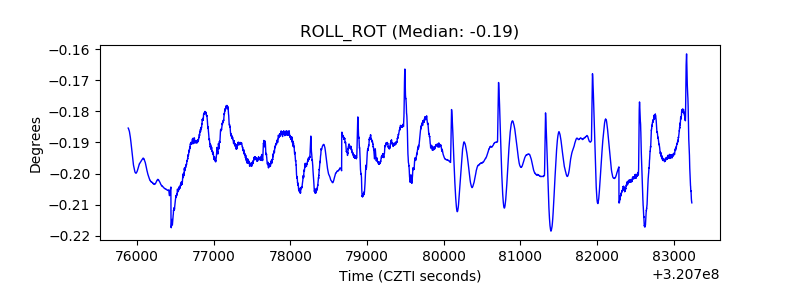 |
| _Roll_DEC |  |
| _Roll_RA | 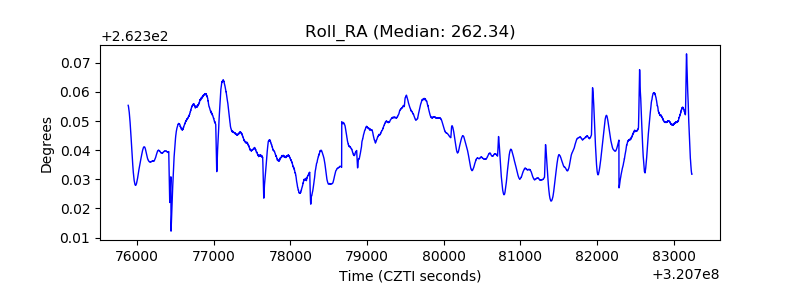 |
| Veto Counter | 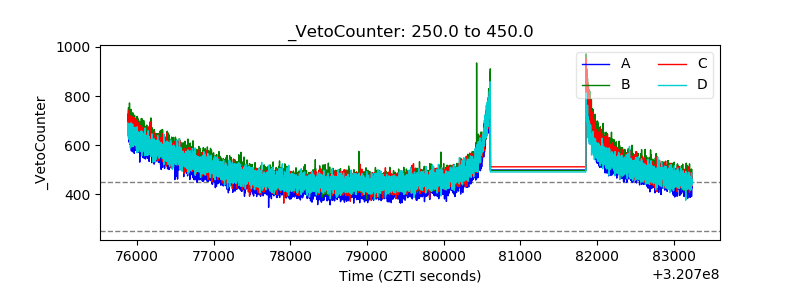 |