| Param | Original file | Final file |
|---|---|---|
| Filename | modeM0/AS1A07_142T01_9000003540_23930cztM0_level2.evt | modeM0/AS1A07_142T01_9000003540_23930cztM0_level2_quad_clean.evt |
| Size (bytes) | 580,962,240 | 93,288,960 |
| Size | 554.0 MB | 89.0 MB |
| Events in quadrant A | 3,621,050 | 602,059 |
| Events in quadrant B | 3,786,746 | 606,552 |
| Events in quadrant C | 4,213,322 | 570,707 |
| Events in quadrant D | 5,480,013 | 538,935 |
| Mode M9 | |||
|---|---|---|---|
| Quadrant | BADHDUFLAG | Total packets | Discarded packets |
| A | 0 | 16 | 0 |
| B | 0 | 16 | 0 |
| C | 0 | 16 | 0 |
| D | 0 | 16 | 0 |
| Mode M0 | |||
|---|---|---|---|
| Quadrant | BADHDUFLAG | Total packets | Discarded packets |
| A | 0 | 15322 | 3 |
| B | 0 | 15745 | 2 |
| C | 0 | 16980 | 2 |
| D | 0 | 21126 | 2 |
| Mode SS | |||
|---|---|---|---|
| Quadrant | BADHDUFLAG | Total packets | Discarded packets |
| A | 0 | 148 | 0 |
| B | 0 | 148 | 0 |
| C | 0 | 148 | 0 |
| D | 0 | 148 | 0 |
| Quadrant | Total seconds | Saturated seconds | Saturation percentage |
|---|---|---|---|
| A | 7283 | 102 | 1.400522% |
| B | 7284 | 155 | 2.127952% |
| C | 7284 | 219 | 3.006590% |
| D | 7284 | 441 | 6.054366% |
Noise dominated data is calculated using 1-second bins in cleaned event files. If a bin has >2000 counts, and if more than 50% of those come from <1% of pixels, then it is considered to be noise-dominated and hence unusable.
| Quadrant | # 1 sec bins | Bins with >0 counts | Bins with >2000 counts | High rate bins dominated by noise | Noise dominated (total time) | Noise dominated (detector-on time) | Marked lightcurve |
|---|---|---|---|---|---|---|---|
| A | 8853 | 7285 | 0 | 0 | 0.00% | 0.00% | 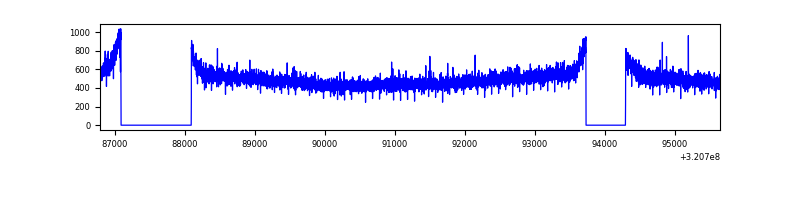 |
| B | 8854 | 7286 | 5 | 5 | 0.06% | 0.07% | 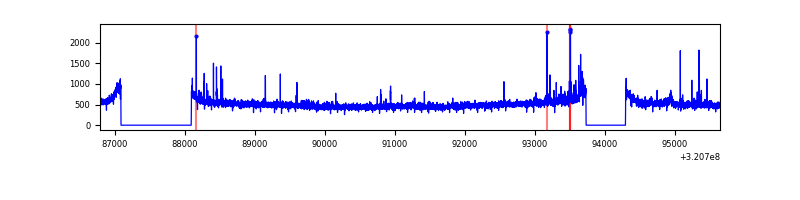 |
| C | 8854 | 7286 | 34 | 34 | 0.38% | 0.47% | 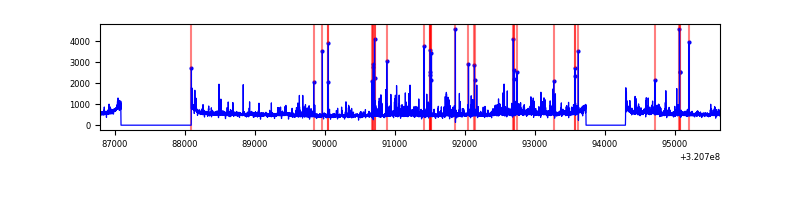 |
| D | 8854 | 7286 | 340 | 340 | 3.84% | 4.67% | 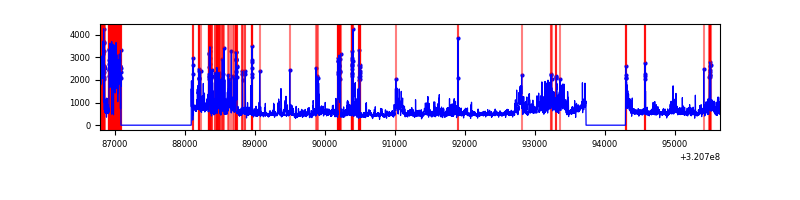 |
Top three noisy pixels from each quadrant. If the there are fewer than three noisy pixels in the level2.evt file, extra rows are filled as -1
| Pixel properties | Quadrant properties | ||||||
|---|---|---|---|---|---|---|---|
| Quadrant | DetID | PixID | Counts | Sigma | Mean | Median | Sigma |
| A | 2 | 250 | 16643 | 83.52 | 935 | 915 | 188.3 |
| A | 13 | 254 | 12584 | 61.97 | 935 | 915 | 188.3 |
| A | 3 | 137 | 8274 | 39.08 | 935 | 915 | 188.3 |
| B | 0 | 189 | 57656 | 317.46 | 931 | 910 | 178.8 |
| B | 15 | 33 | 44283 | 242.64 | 931 | 910 | 178.8 |
| B | 12 | 111 | 20783 | 111.18 | 931 | 910 | 178.8 |
| C | 10 | 9 | 436847 | 2120.36 | 881 | 886 | 205.6 |
| C | 7 | 247 | 170522 | 825.05 | 881 | 886 | 205.6 |
| C | 14 | 238 | 139519 | 674.26 | 881 | 886 | 205.6 |
| D | 12 | 218 | 710488 | 3333.95 | 871 | 845 | 212.9 |
| D | 8 | 195 | 684010 | 3209.55 | 871 | 845 | 212.9 |
| D | 1 | 52 | 619963 | 2908.65 | 871 | 845 | 212.9 |
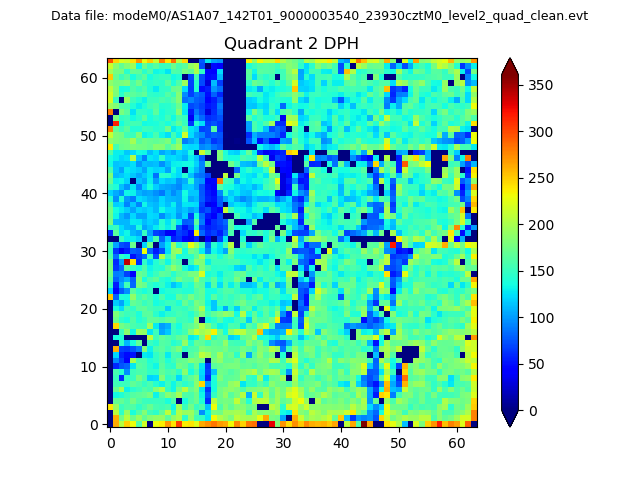
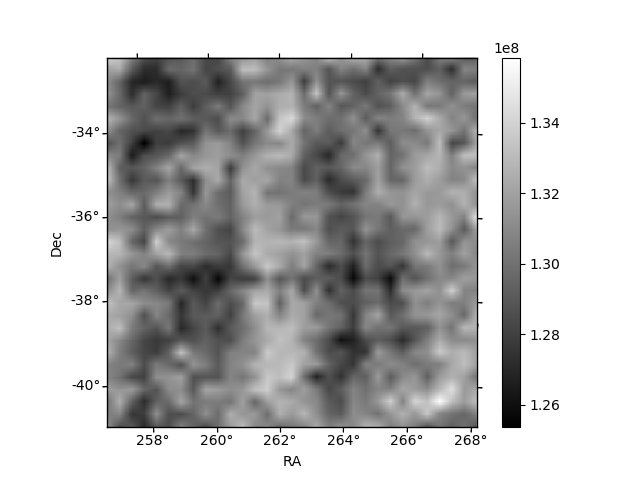
Histogram calculated using DETX and DETY for each event in the final _common_clean file
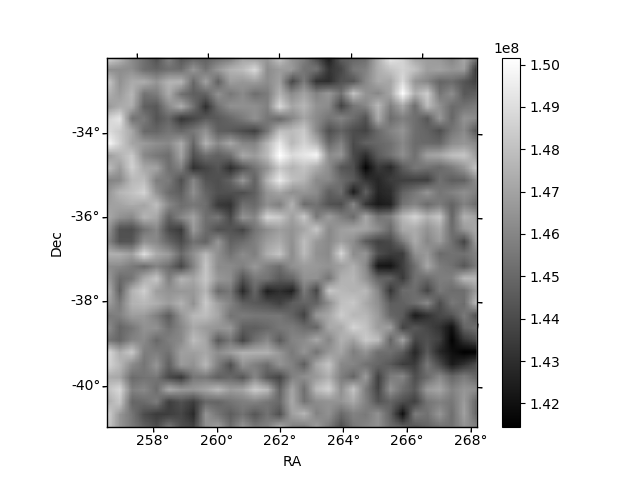
| Quadrant A | 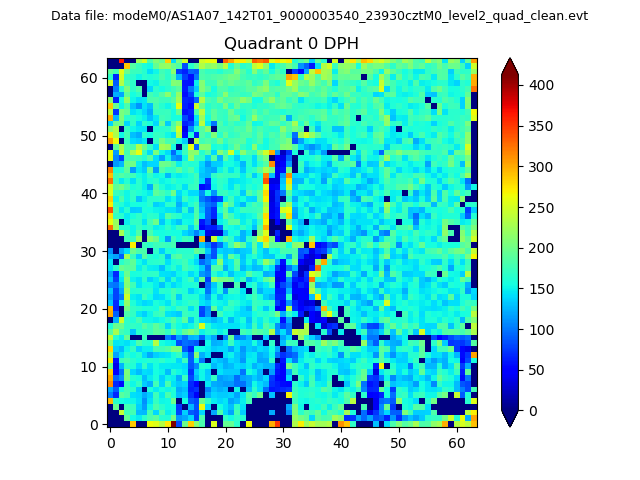 |
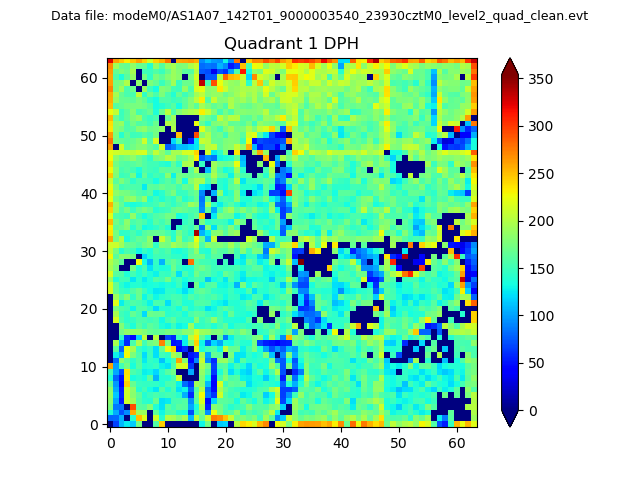 |
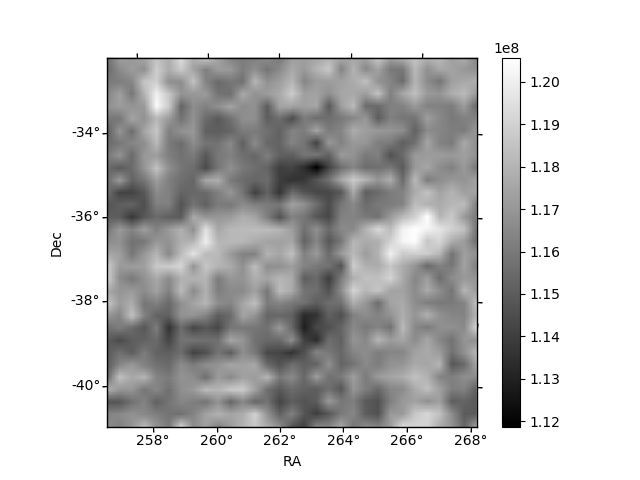
Quadrant B |
|---|---|---|---|
| Quadrant D | 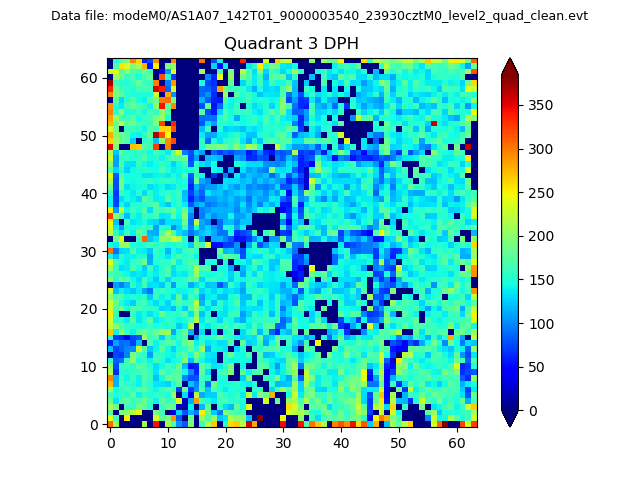 |
 |
Quadrant C |
| Plot type | Count rate plots | Images |
|---|---|---|
| Comparison with Poisson distribution Blue bars denote a histogram of data divided into 1 sec bins. Red curve is a Poisson curve with rate = median count rate of data. |
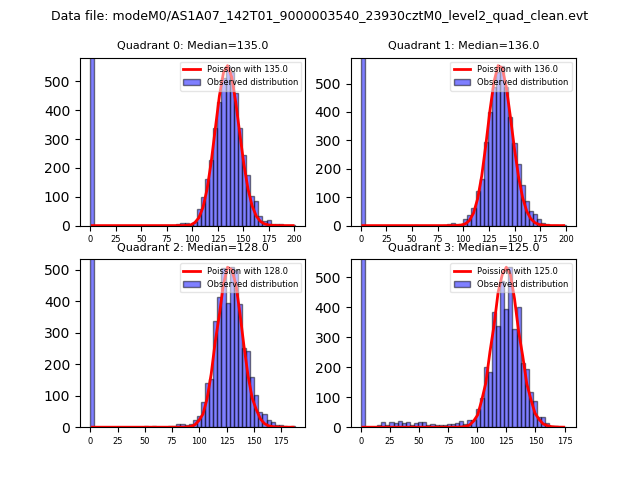 |
 |
| Quadrant-wise count rates Data is divided into 100 sec bins |
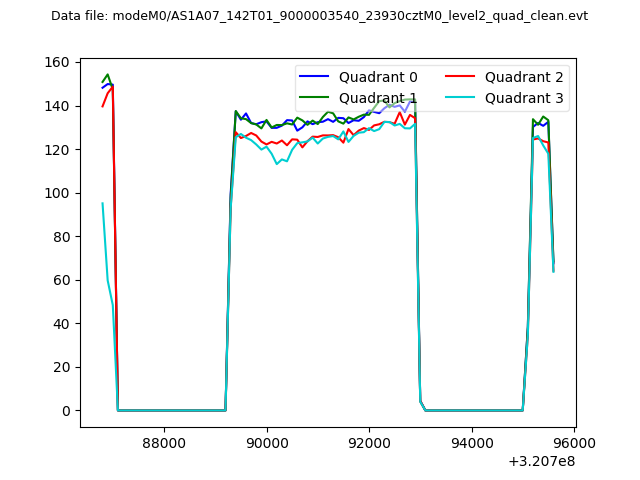 |
|
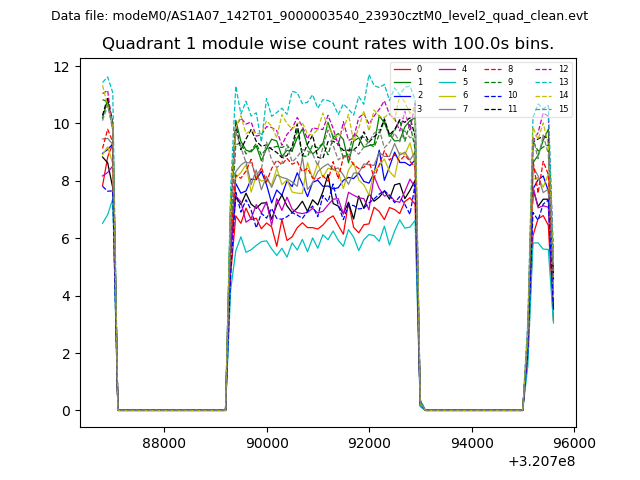
| Module-wise count rates for Quadrant A Data is divided into 100 sec bins |
 |
 |
| Module-wise count rates for Quadrant B Data is divided into 100 sec bins |
 |
 |
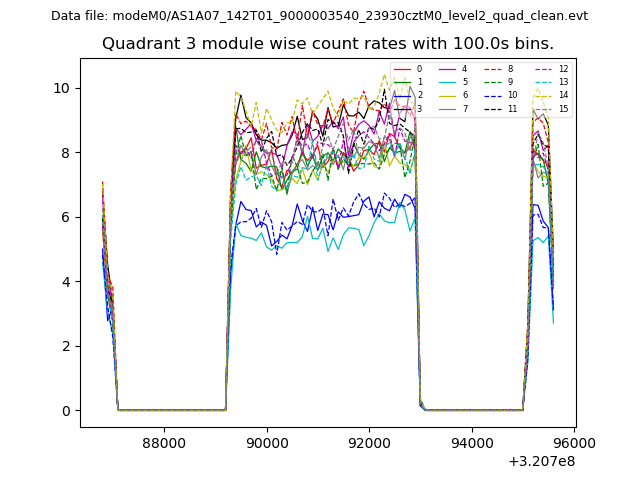
| Module-wise count rates for Quadrant C Data is divided into 100 sec bins |
 |
 |
| Module-wise count rates for Quadrant D Data is divided into 100 sec bins |
 |
 |
| Parameter | Plot |
|---|---|
| CZT HV Monitor |  |
| D_VDD | 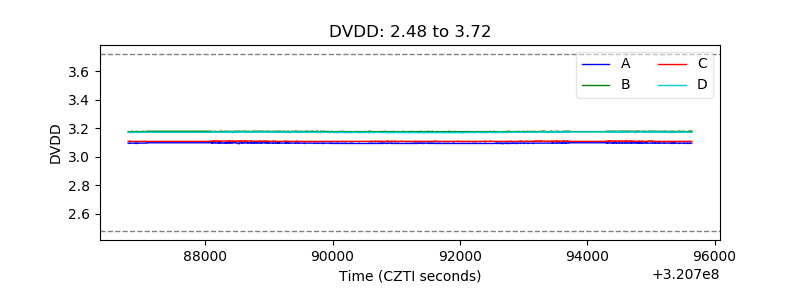 |
| Temperature 1 | 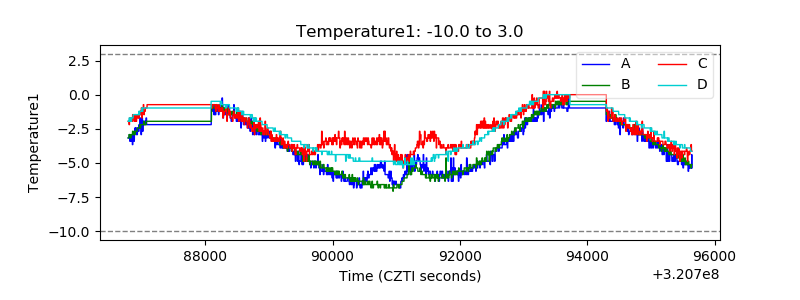 |
| Veto HV Monitor | 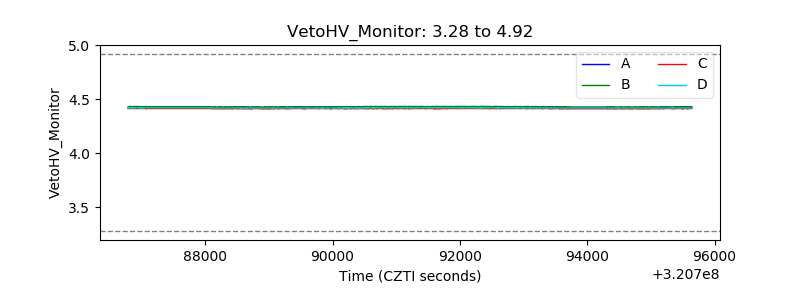 |
| Veto LLD |  |
| Alpha Counter | 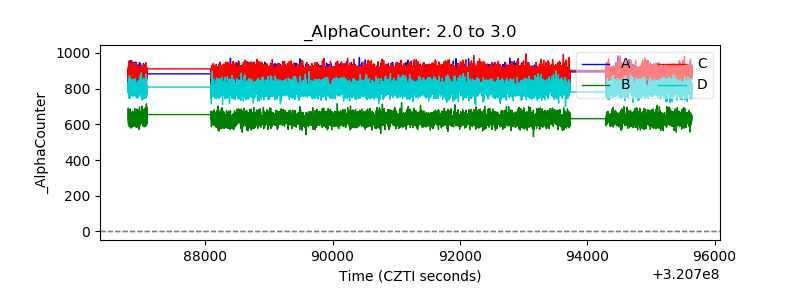 |
| _CPM_Rate | 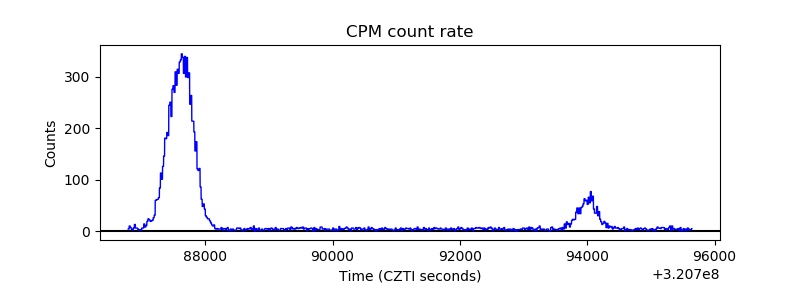 |
| CZT Counter | 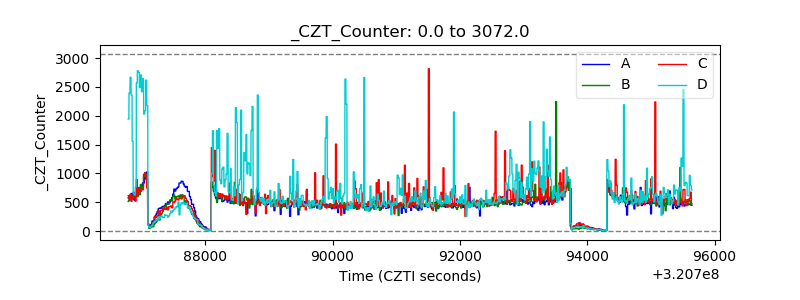 |
| +2.5 Volts monitor |  |
| +5 Volts monitor |  |
| _ROLL_ROT | 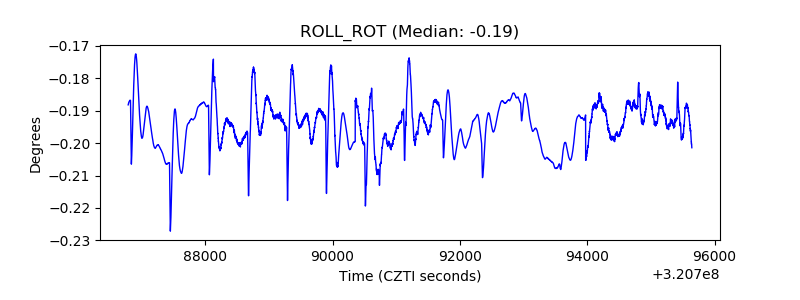 |
| _Roll_DEC | 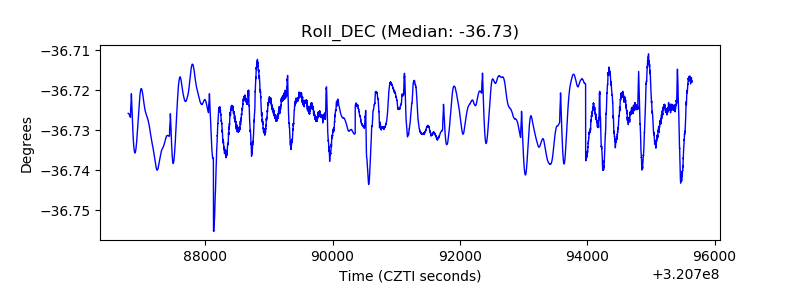 |
| _Roll_RA | 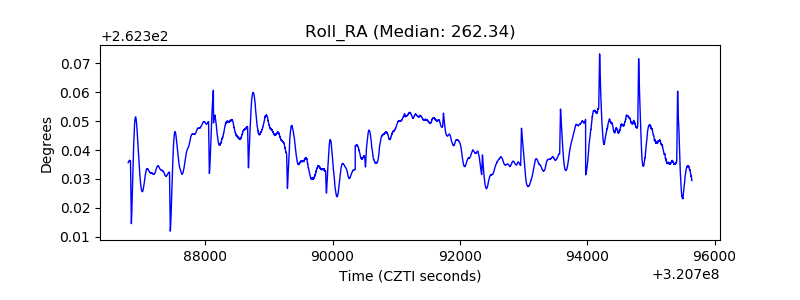 |
| Veto Counter |  |