| Param | Original file | Final file |
|---|---|---|
| Filename | modeM0/AS1A07_142T01_9000003540_23931cztM0_level2.evt | modeM0/AS1A07_142T01_9000003540_23931cztM0_level2_quad_clean.evt |
| Size (bytes) | 605,643,840 | 98,614,080 |
| Size | 577.6 MB | 94.0 MB |
| Events in quadrant A | 3,929,037 | 621,580 |
| Events in quadrant B | 4,335,293 | 628,640 |
| Events in quadrant C | 4,395,021 | 592,586 |
| Events in quadrant D | 5,135,737 | 582,788 |
| Mode M9 | |||
|---|---|---|---|
| Quadrant | BADHDUFLAG | Total packets | Discarded packets |
| A | 0 | 9 | 0 |
| B | 0 | 9 | 0 |
| C | 0 | 9 | 0 |
| D | 0 | 9 | 0 |
| Mode M0 | |||
|---|---|---|---|
| Quadrant | BADHDUFLAG | Total packets | Discarded packets |
| A | 0 | 16825 | 2 |
| B | 0 | 18059 | 2 |
| C | 0 | 17955 | 2 |
| D | 0 | 20702 | 2 |
| Mode SS | |||
|---|---|---|---|
| Quadrant | BADHDUFLAG | Total packets | Discarded packets |
| A | 0 | 164 | 0 |
| B | 0 | 164 | 0 |
| C | 0 | 164 | 0 |
| D | 0 | 164 | 0 |
| Quadrant | Total seconds | Saturated seconds | Saturation percentage |
|---|---|---|---|
| A | 8073 | 86 | 1.065279% |
| B | 8073 | 196 | 2.427846% |
| C | 8073 | 238 | 2.948099% |
| D | 8073 | 173 | 2.142946% |
Noise dominated data is calculated using 1-second bins in cleaned event files. If a bin has >2000 counts, and if more than 50% of those come from <1% of pixels, then it is considered to be noise-dominated and hence unusable.
| Quadrant | # 1 sec bins | Bins with >0 counts | Bins with >2000 counts | High rate bins dominated by noise | Noise dominated (total time) | Noise dominated (detector-on time) | Marked lightcurve |
|---|---|---|---|---|---|---|---|
| A | 8913 | 8075 | 0 | 0 | 0.00% | 0.00% | 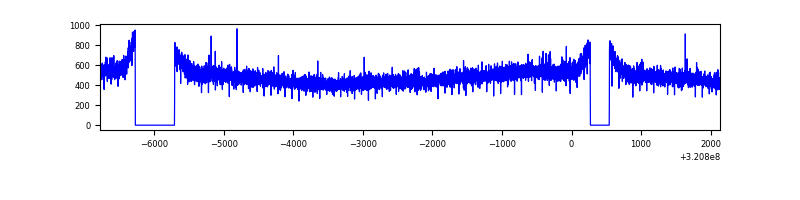 |
| B | 8913 | 8075 | 10 | 10 | 0.11% | 0.12% | 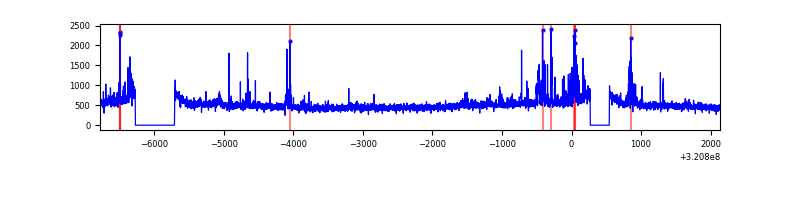 |
| C | 8913 | 8075 | 33 | 33 | 0.37% | 0.41% | 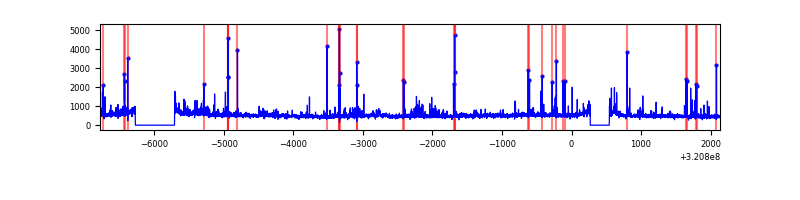 |
| D | 8913 | 8075 | 73 | 73 | 0.82% | 0.90% | 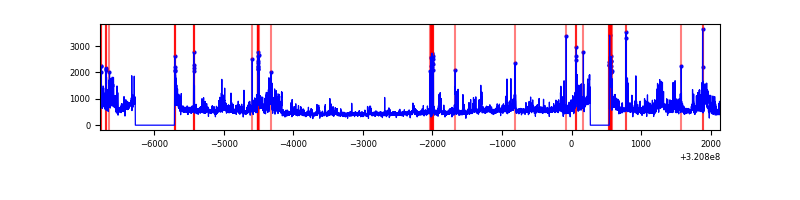 |
Top three noisy pixels from each quadrant. If the there are fewer than three noisy pixels in the level2.evt file, extra rows are filled as -1
| Pixel properties | Quadrant properties | ||||||
|---|---|---|---|---|---|---|---|
| Quadrant | DetID | PixID | Counts | Sigma | Mean | Median | Sigma |
| A | 13 | 254 | 14476 | 65.97 | 1016 | 994 | 204.4 |
| A | 2 | 250 | 11457 | 51.2 | 1016 | 994 | 204.4 |
| A | 3 | 137 | 9129 | 39.81 | 1016 | 994 | 204.4 |
| B | 15 | 33 | 212720 | 1096.24 | 1012 | 988 | 193.1 |
| B | 0 | 189 | 95107 | 487.3 | 1012 | 988 | 193.1 |
| B | 12 | 111 | 22785 | 112.85 | 1012 | 988 | 193.1 |
| C | 10 | 9 | 315042 | 1388.79 | 963 | 967 | 226.1 |
| C | 14 | 238 | 152317 | 669.25 | 963 | 967 | 226.1 |
| C | 7 | 247 | 148859 | 653.96 | 963 | 967 | 226.1 |
| D | 8 | 195 | 848401 | 3509.68 | 979 | 948 | 241.5 |
| D | 12 | 218 | 276808 | 1142.46 | 979 | 948 | 241.5 |
| D | 1 | 52 | 193001 | 795.38 | 979 | 948 | 241.5 |
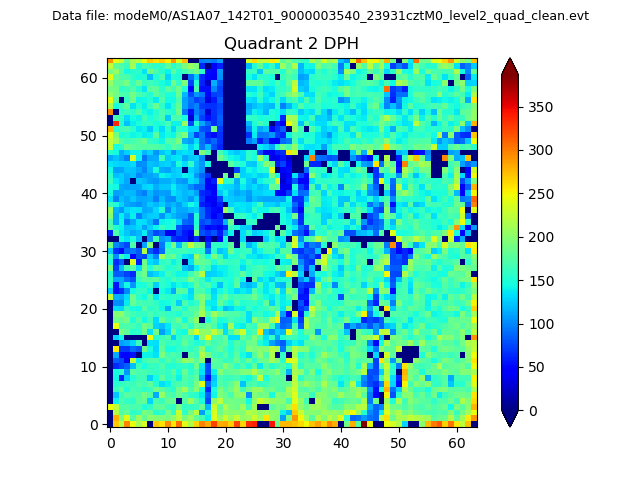
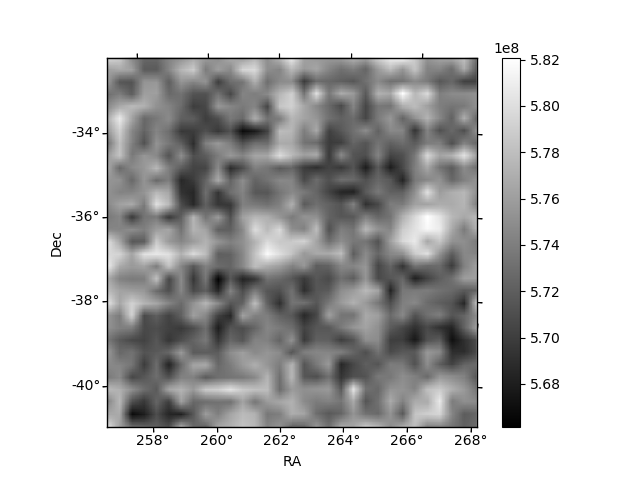
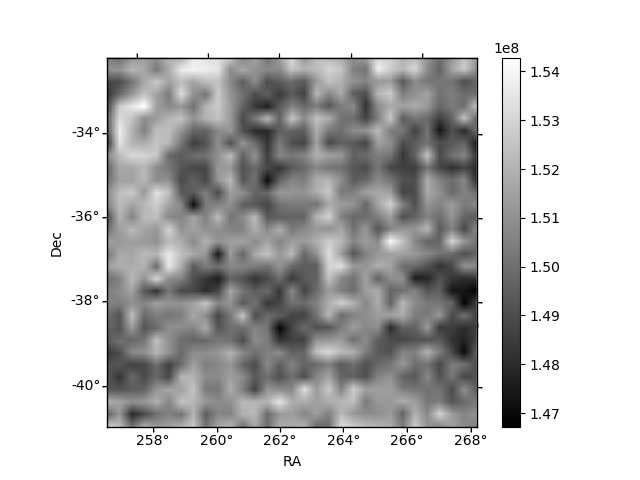
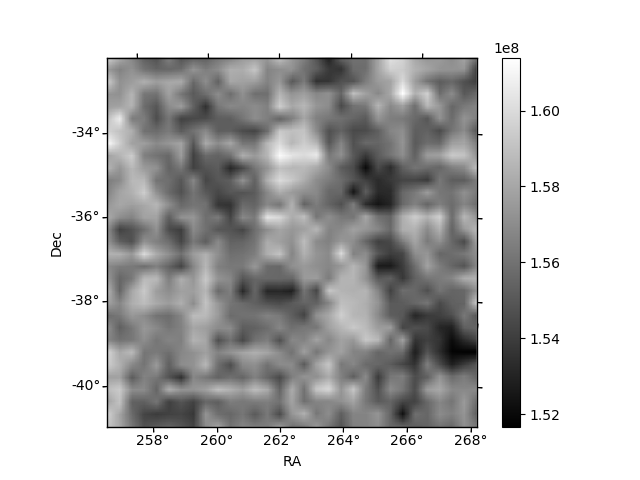
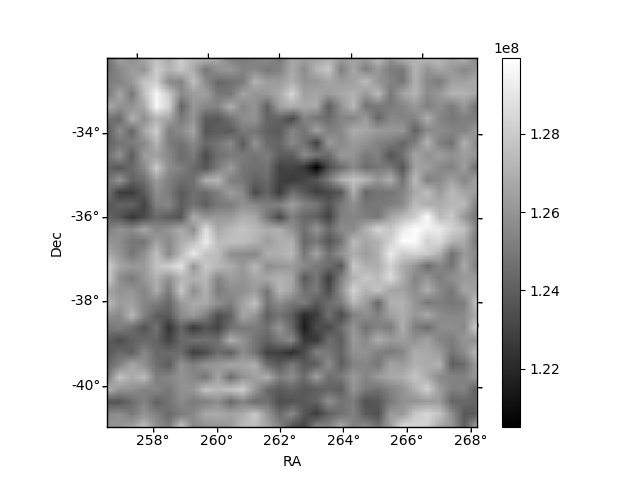
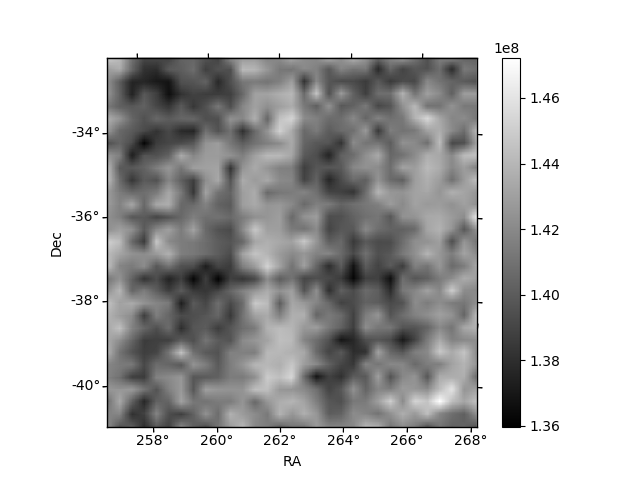
Histogram calculated using DETX and DETY for each event in the final _common_clean file
| Quadrant A | 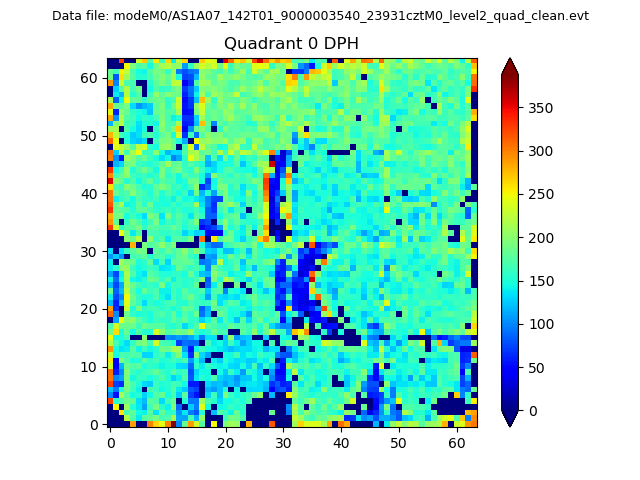 |
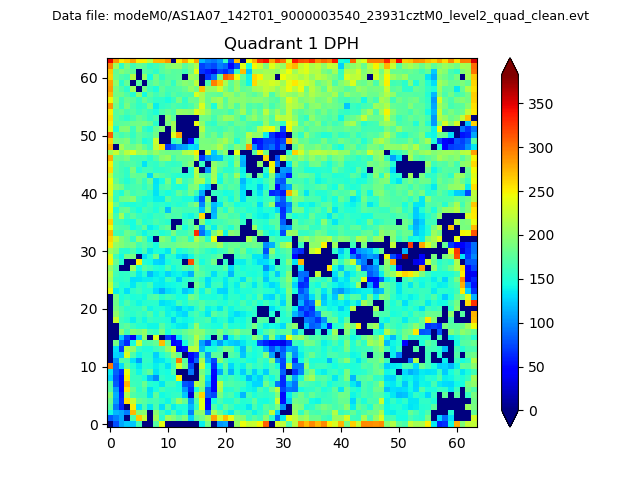 |
Quadrant B |
|---|---|---|---|
| Quadrant D | 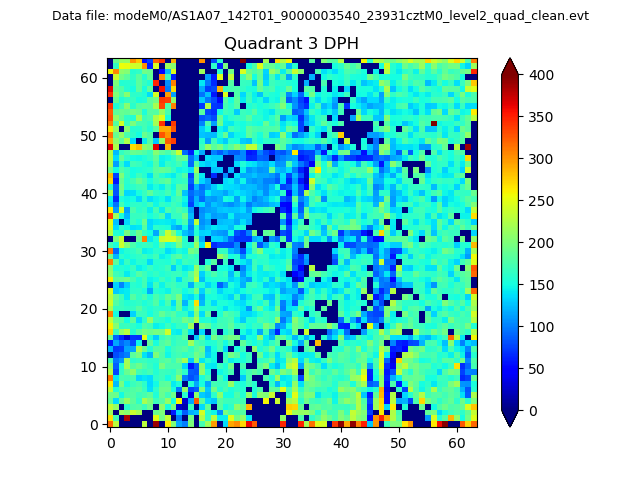 |
 |
Quadrant C |
| Plot type | Count rate plots | Images |
|---|---|---|
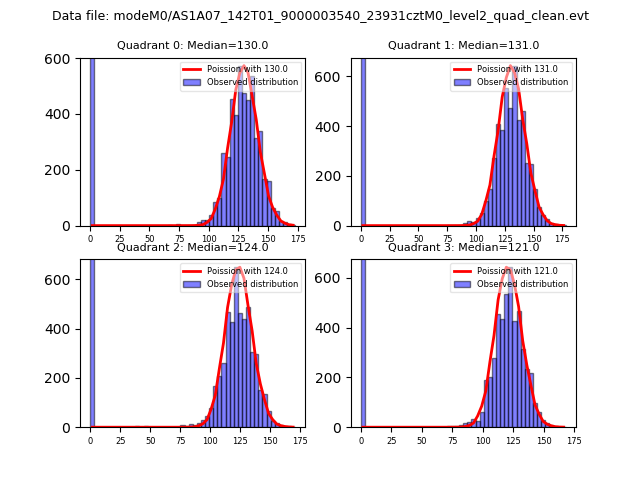
| Comparison with Poisson distribution Blue bars denote a histogram of data divided into 1 sec bins. Red curve is a Poisson curve with rate = median count rate of data. |
 |
 |
| Quadrant-wise count rates Data is divided into 100 sec bins |
 |
|
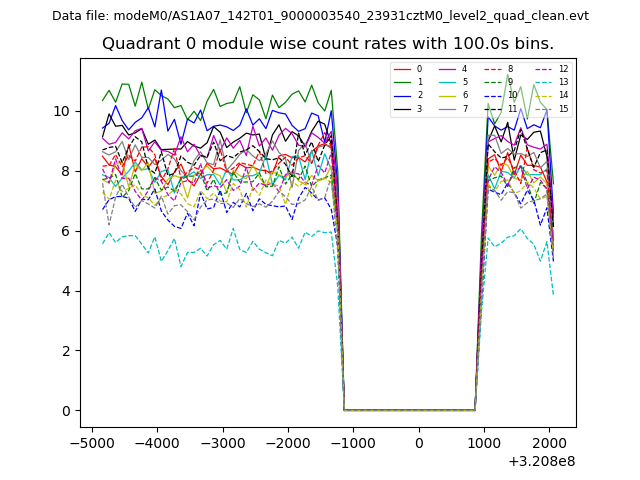
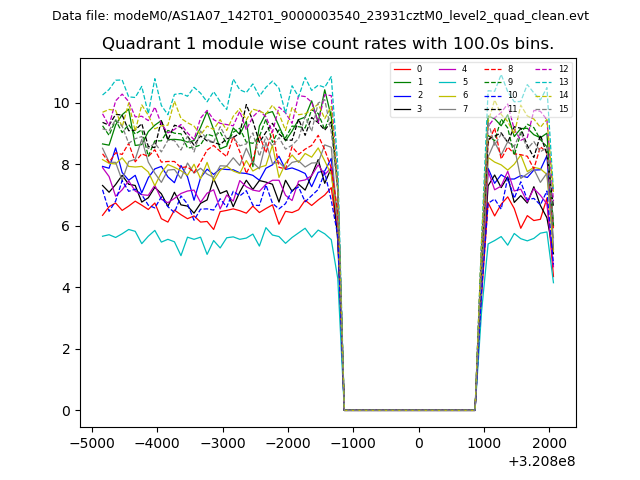
| Module-wise count rates for Quadrant A Data is divided into 100 sec bins |
 |
 |
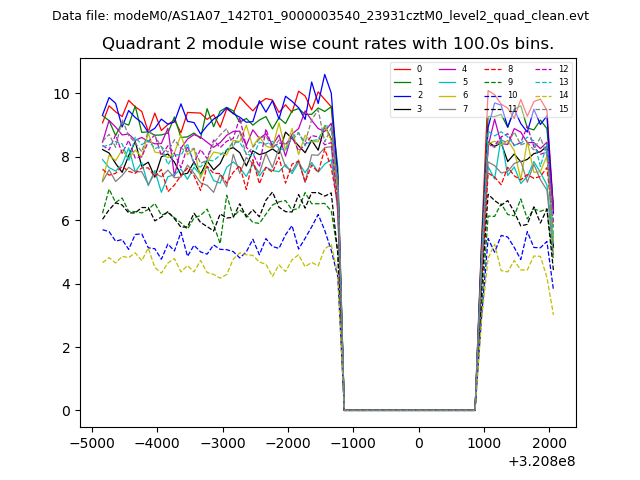
| Module-wise count rates for Quadrant B Data is divided into 100 sec bins |
 |
 |
| Module-wise count rates for Quadrant C Data is divided into 100 sec bins |
 |
 |
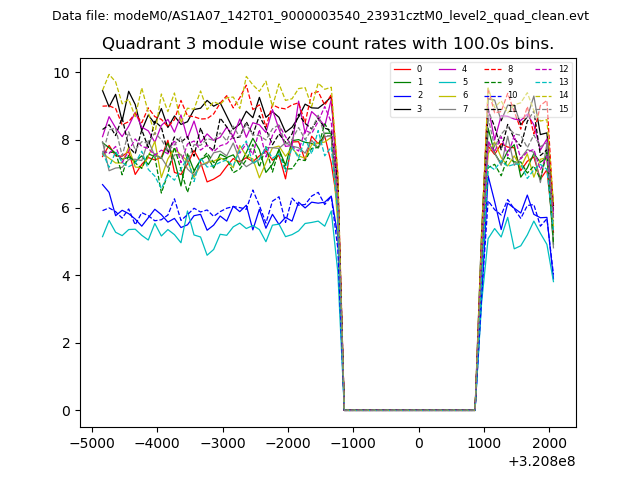
| Module-wise count rates for Quadrant D Data is divided into 100 sec bins |
 |
 |
| Parameter | Plot |
|---|---|
| CZT HV Monitor | 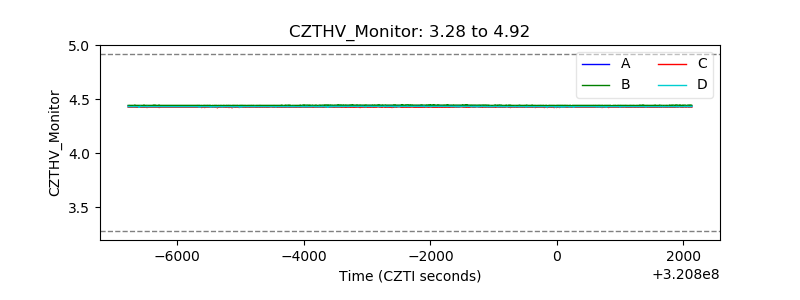 |
| D_VDD | 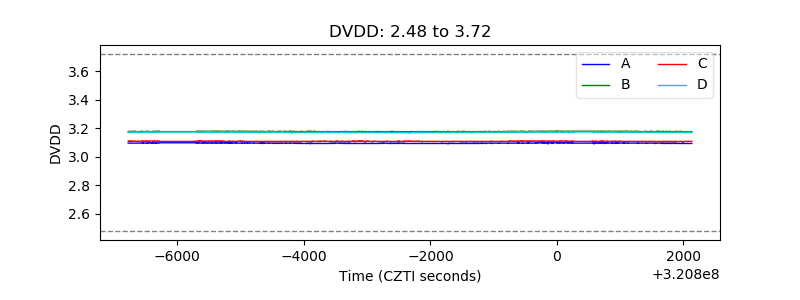 |
| Temperature 1 | 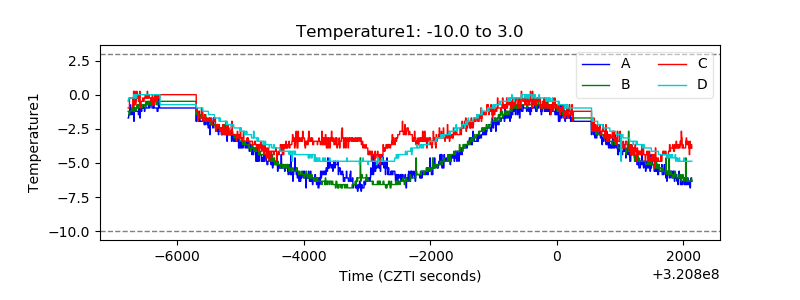 |
| Veto HV Monitor |  |
| Veto LLD | 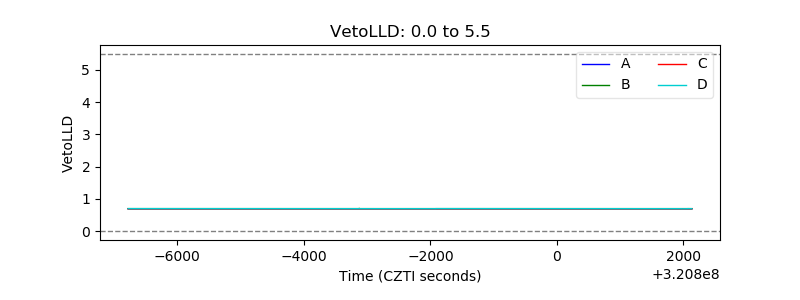 |
| Alpha Counter | 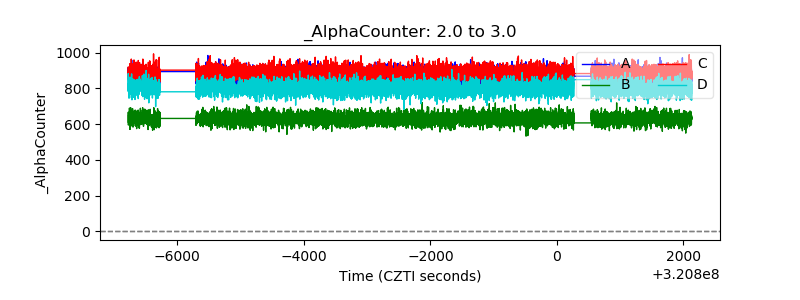 |
| _CPM_Rate |  |
| CZT Counter | 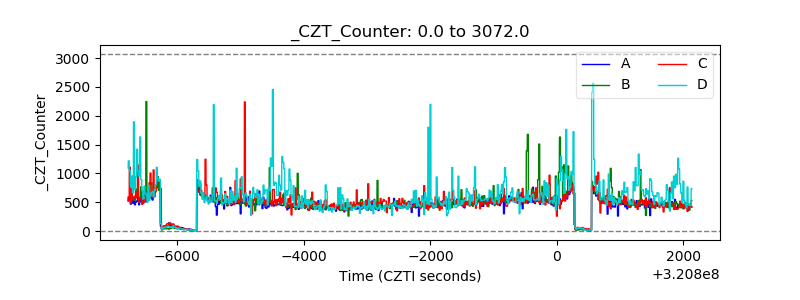 |
| +2.5 Volts monitor |  |
| +5 Volts monitor | 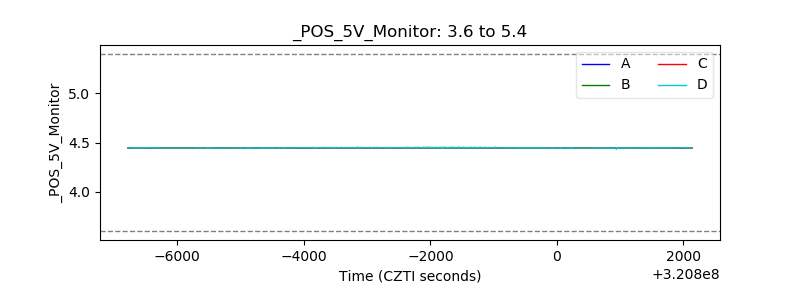 |
| _ROLL_ROT | 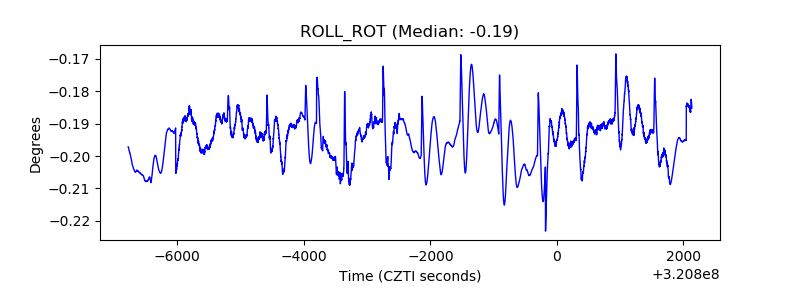 |
| _Roll_DEC | 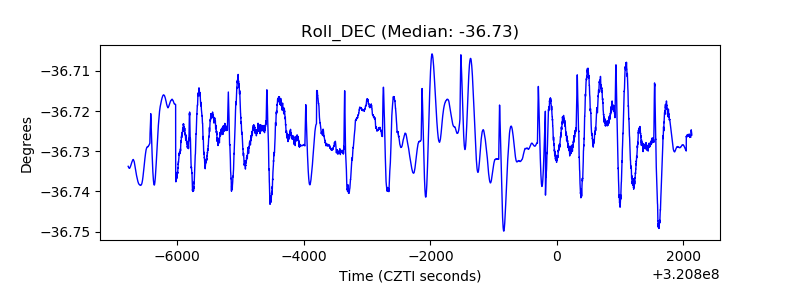 |
| _Roll_RA | 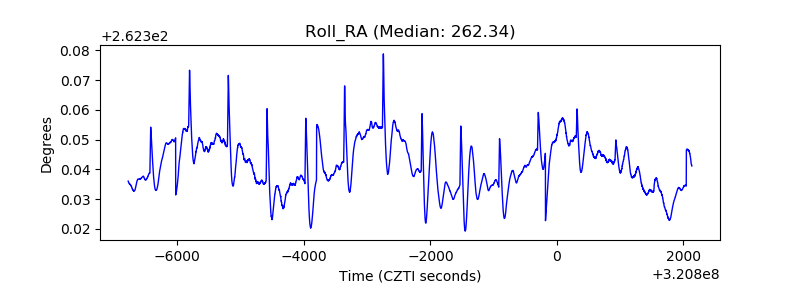 |
| Veto Counter | 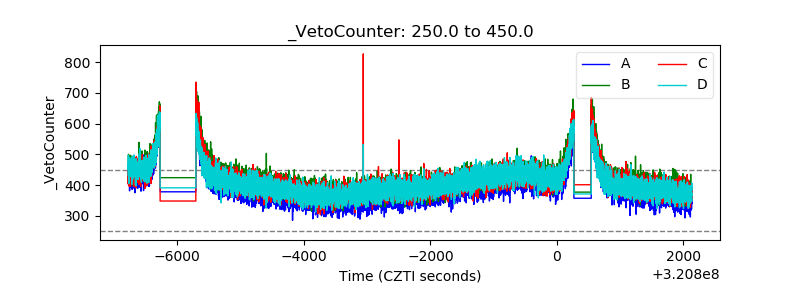 |