| Param | Original file | Final file |
|---|---|---|
| Filename | modeM0/AS1A07_142T01_9000003540_23935cztM0_level2.evt | modeM0/AS1A07_142T01_9000003540_23935cztM0_level2_quad_clean.evt |
| Size (bytes) | 561,202,560 | 85,400,640 |
| Size | 535.2 MB | 81.4 MB |
| Events in quadrant A | 3,206,210 | 544,149 |
| Events in quadrant B | 3,388,313 | 552,158 |
| Events in quadrant C | 3,279,183 | 525,050 |
| Events in quadrant D | 6,667,501 | 496,423 |
| Mode M9 | |||
|---|---|---|---|
| Quadrant | BADHDUFLAG | Total packets | Discarded packets |
| A | 0 | 7 | 0 |
| B | 0 | 7 | 0 |
| C | 0 | 7 | 0 |
| D | 0 | 7 | 0 |
| Mode M0 | |||
|---|---|---|---|
| Quadrant | BADHDUFLAG | Total packets | Discarded packets |
| A | 0 | 13871 | 2 |
| B | 0 | 14313 | 2 |
| C | 0 | 13946 | 2 |
| D | 0 | 24529 | 2 |
| Mode SS | |||
|---|---|---|---|
| Quadrant | BADHDUFLAG | Total packets | Discarded packets |
| A | 0 | 140 | 0 |
| B | 0 | 140 | 0 |
| C | 0 | 140 | 0 |
| D | 0 | 140 | 0 |
| Quadrant | Total seconds | Saturated seconds | Saturation percentage |
|---|---|---|---|
| A | 6710 | 37 | 0.551416% |
| B | 6711 | 88 | 1.311280% |
| C | 6711 | 104 | 1.549695% |
| D | 6711 | 387 | 5.766652% |
Noise dominated data is calculated using 1-second bins in cleaned event files. If a bin has >2000 counts, and if more than 50% of those come from <1% of pixels, then it is considered to be noise-dominated and hence unusable.
| Quadrant | # 1 sec bins | Bins with >0 counts | Bins with >2000 counts | High rate bins dominated by noise | Noise dominated (total time) | Noise dominated (detector-on time) | Marked lightcurve |
|---|---|---|---|---|---|---|---|
| A | 7500 | 6712 | 0 | 0 | 0.00% | 0.00% | 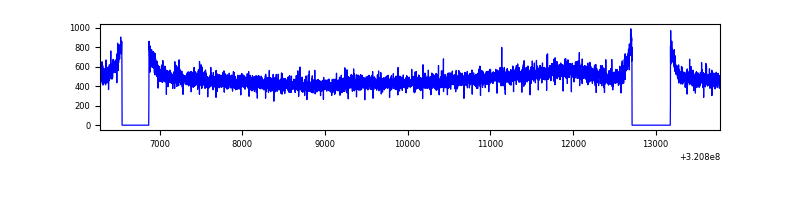 |
| B | 7501 | 6713 | 1 | 1 | 0.01% | 0.01% | 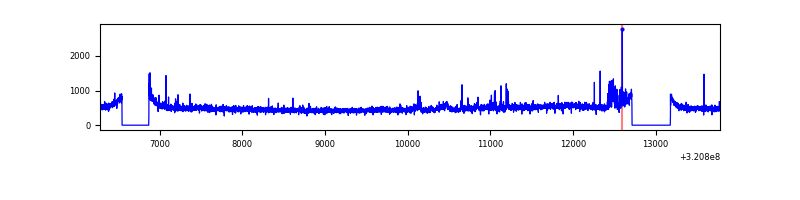 |
| C | 7501 | 6713 | 4 | 4 | 0.05% | 0.06% | 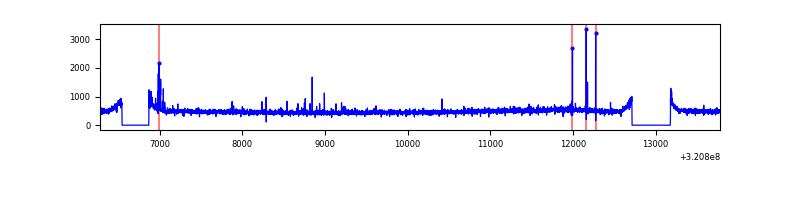 |
| D | 7501 | 6713 | 289 | 289 | 3.85% | 4.31% | 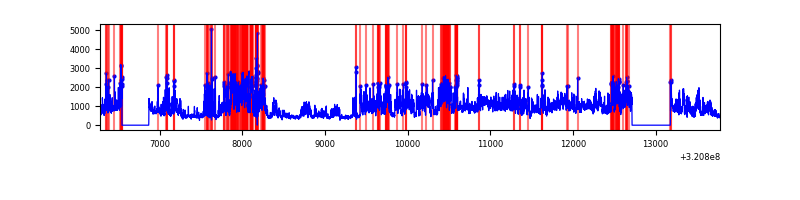 |
Top three noisy pixels from each quadrant. If the there are fewer than three noisy pixels in the level2.evt file, extra rows are filled as -1
| Pixel properties | Quadrant properties | ||||||
|---|---|---|---|---|---|---|---|
| Quadrant | DetID | PixID | Counts | Sigma | Mean | Median | Sigma |
| A | 13 | 254 | 12094 | 66.35 | 830 | 811 | 170.1 |
| A | 3 | 137 | 7496 | 39.31 | 830 | 811 | 170.1 |
| A | 0 | 226 | 7314 | 38.24 | 830 | 811 | 170.1 |
| B | 15 | 33 | 74539 | 459.3 | 831 | 809 | 160.5 |
| B | 0 | 189 | 32188 | 195.47 | 831 | 809 | 160.5 |
| B | 12 | 111 | 19168 | 114.36 | 831 | 809 | 160.5 |
| C | 14 | 238 | 123920 | 653.99 | 798 | 803 | 188.3 |
| C | 10 | 9 | 31436 | 162.72 | 798 | 803 | 188.3 |
| C | 0 | 10 | 9343 | 45.36 | 798 | 803 | 188.3 |
| D | 8 | 195 | 3201099 | 16353.05 | 794 | 767 | 195.7 |
| D | 12 | 218 | 317530 | 1618.6 | 794 | 767 | 195.7 |
| D | 7 | 38 | 65294 | 329.72 | 794 | 767 | 195.7 |
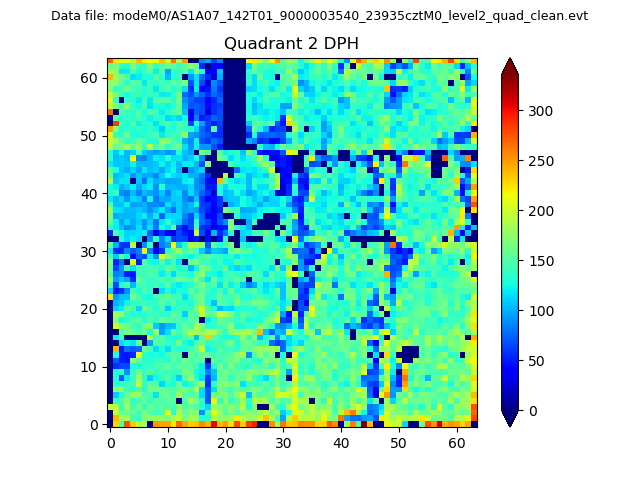
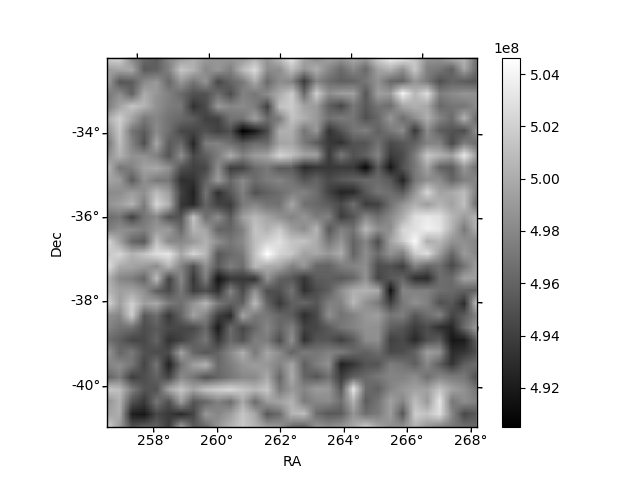
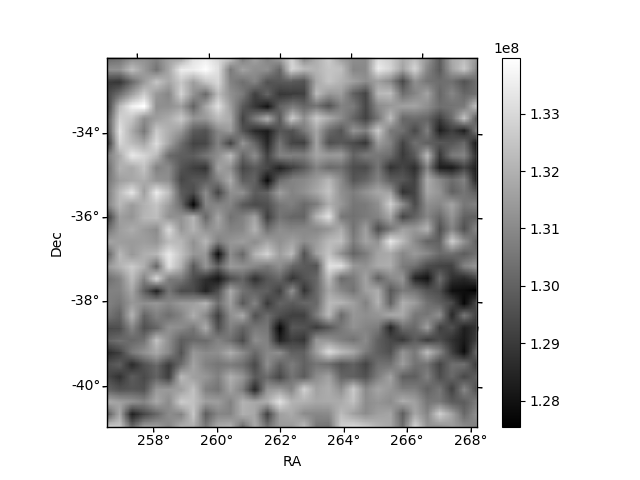
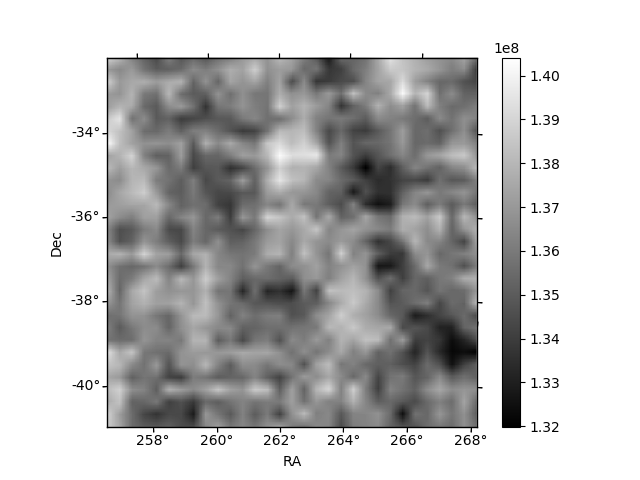
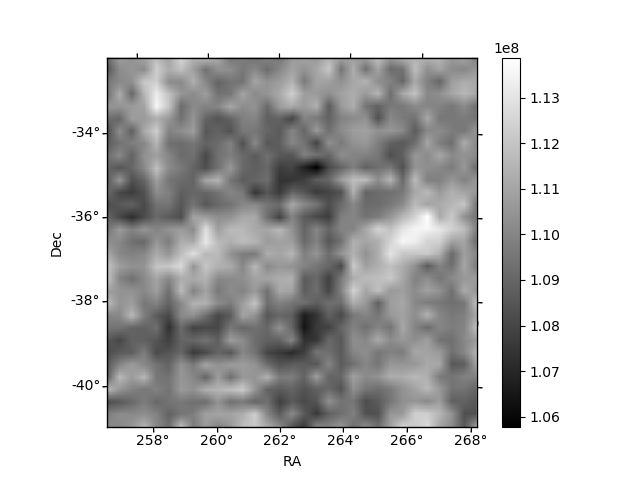
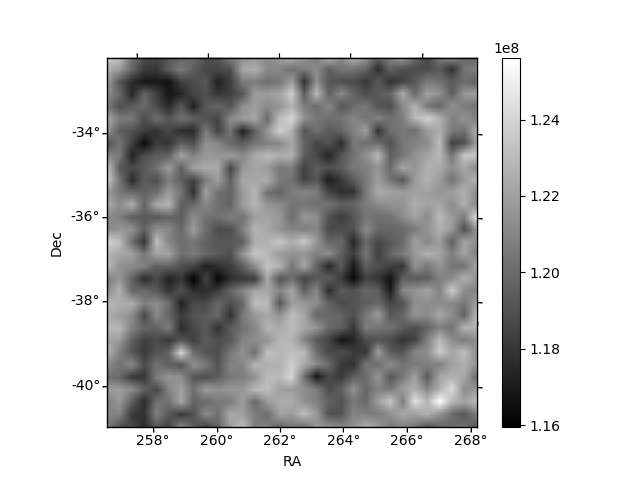
Histogram calculated using DETX and DETY for each event in the final _common_clean file
| Quadrant A | 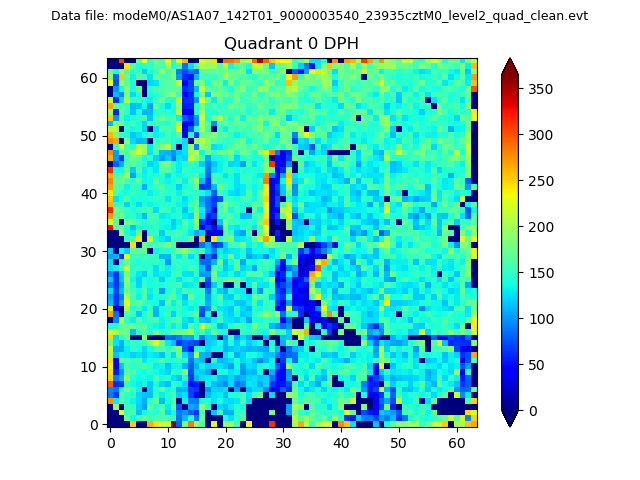 |
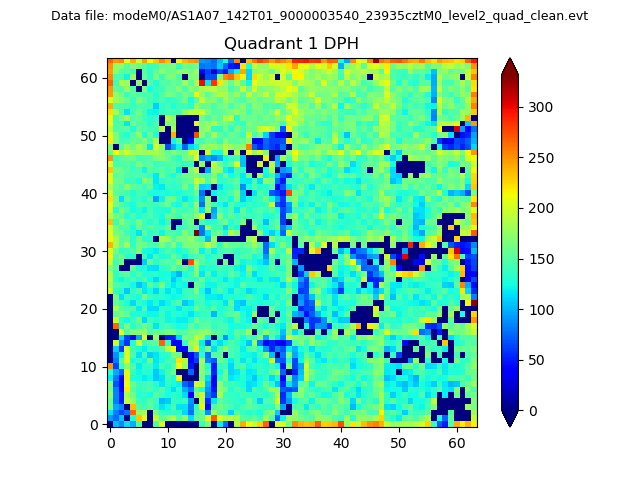 |
Quadrant B |
|---|---|---|---|
| Quadrant D | 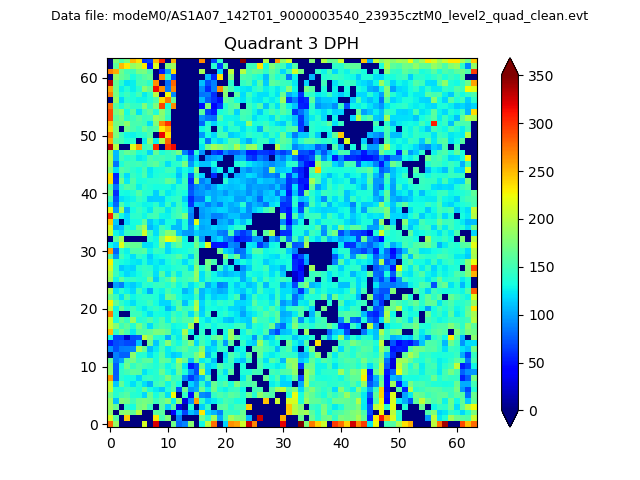 |
 |
Quadrant C |
| Plot type | Count rate plots | Images |
|---|---|---|
| Comparison with Poisson distribution Blue bars denote a histogram of data divided into 1 sec bins. Red curve is a Poisson curve with rate = median count rate of data. |
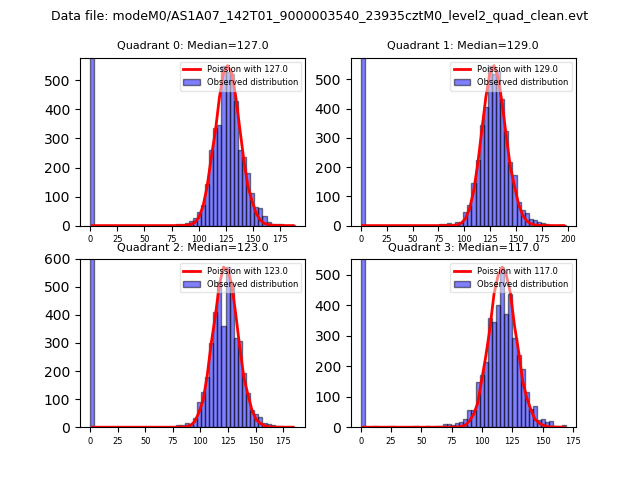 |
 |
| Quadrant-wise count rates Data is divided into 100 sec bins |
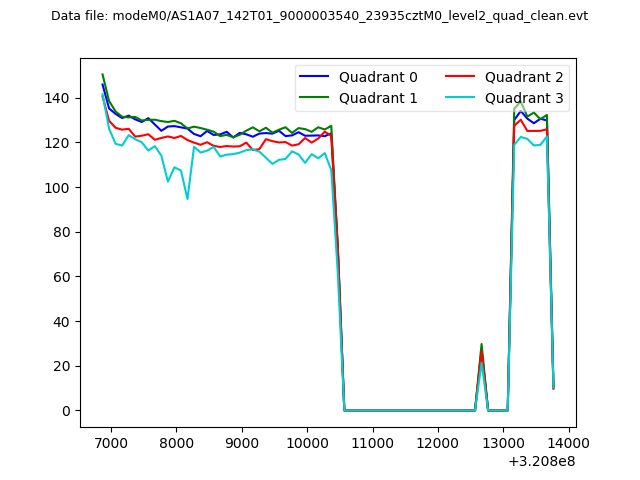 |
|
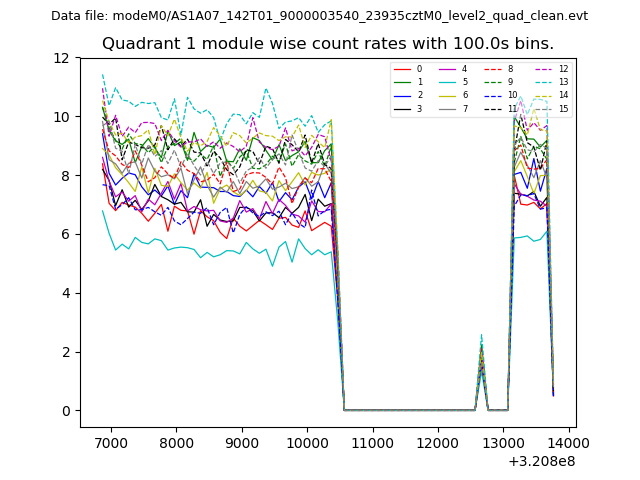
| Module-wise count rates for Quadrant A Data is divided into 100 sec bins |
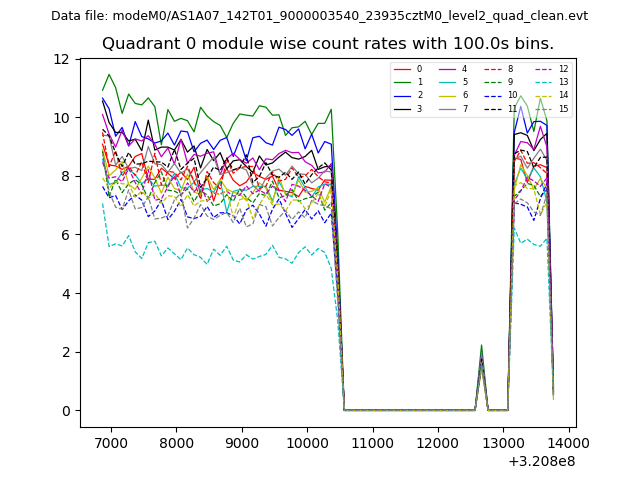 |
 |
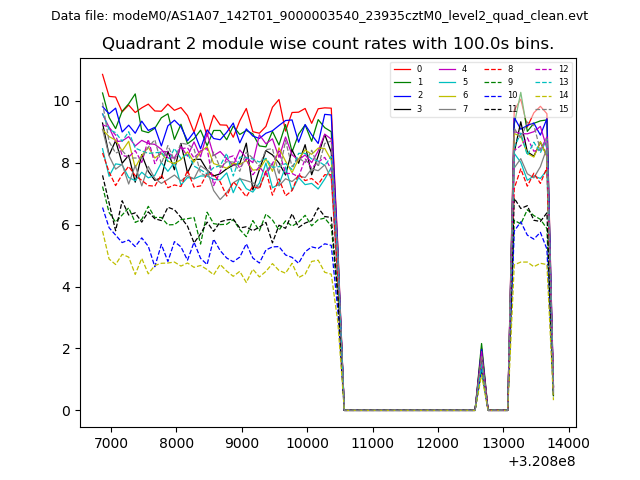
| Module-wise count rates for Quadrant B Data is divided into 100 sec bins |
 |
 |
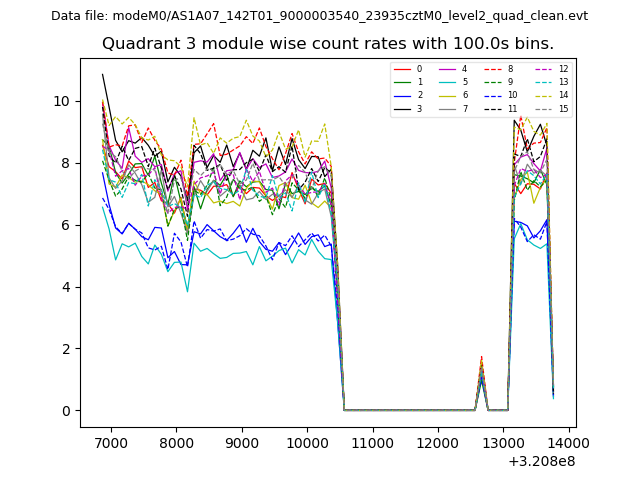
| Module-wise count rates for Quadrant C Data is divided into 100 sec bins |
 |
 |
| Module-wise count rates for Quadrant D Data is divided into 100 sec bins |
 |
 |
| Parameter | Plot |
|---|---|
| CZT HV Monitor | 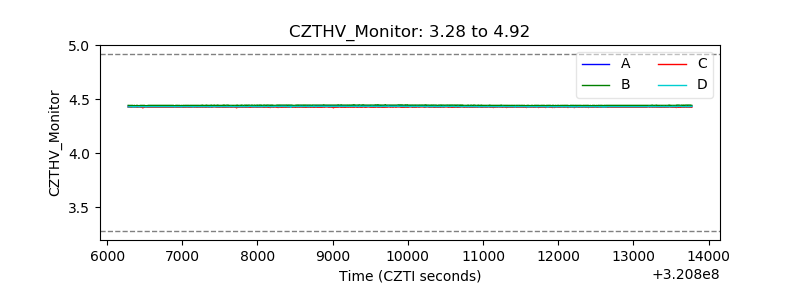 |
| D_VDD | 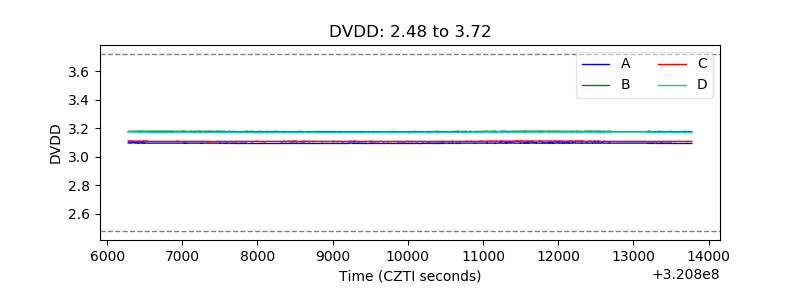 |
| Temperature 1 | 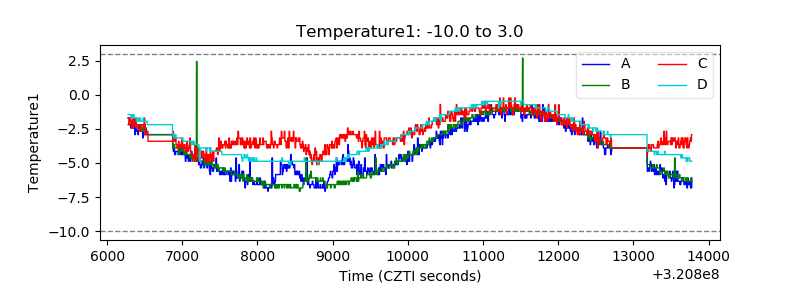 |
| Veto HV Monitor | 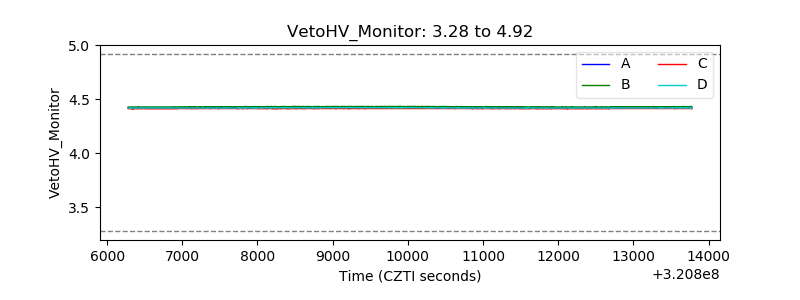 |
| Veto LLD | 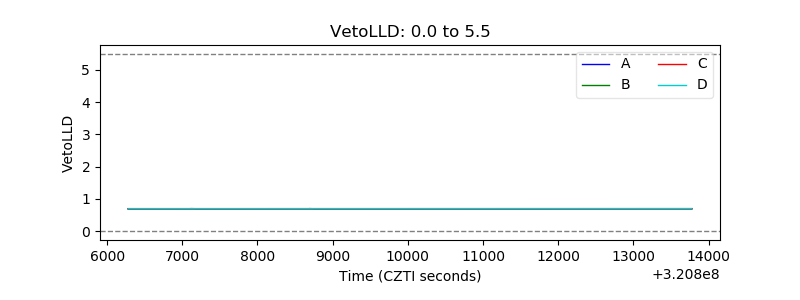 |
| Alpha Counter | 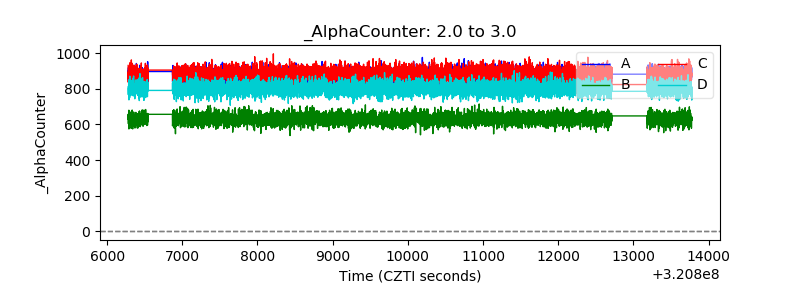 |
| _CPM_Rate | 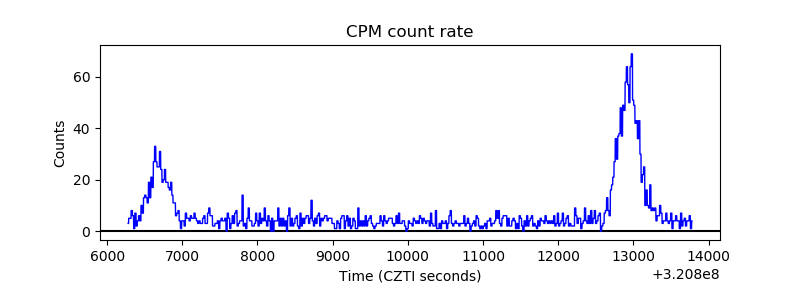 |
| CZT Counter | 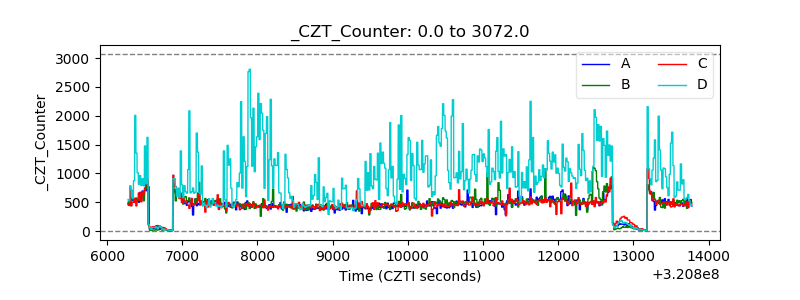 |
| +2.5 Volts monitor |  |
| +5 Volts monitor |  |
| _ROLL_ROT | 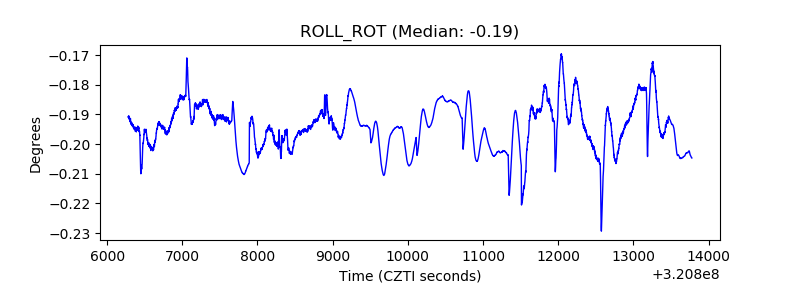 |
| _Roll_DEC | 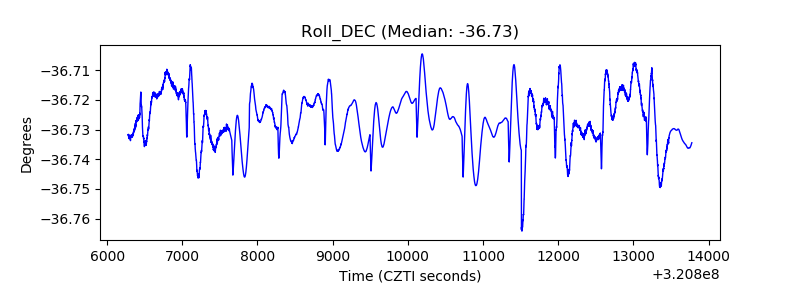 |
| _Roll_RA | 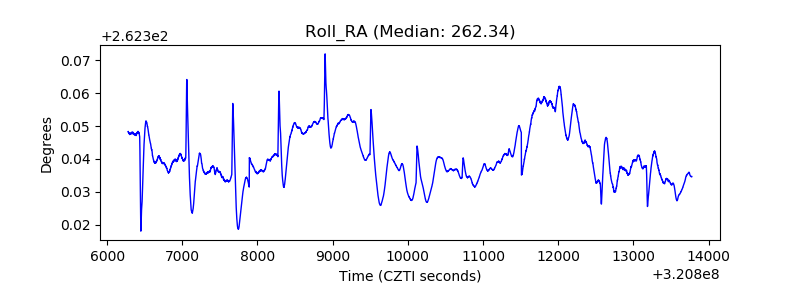 |
| Veto Counter | 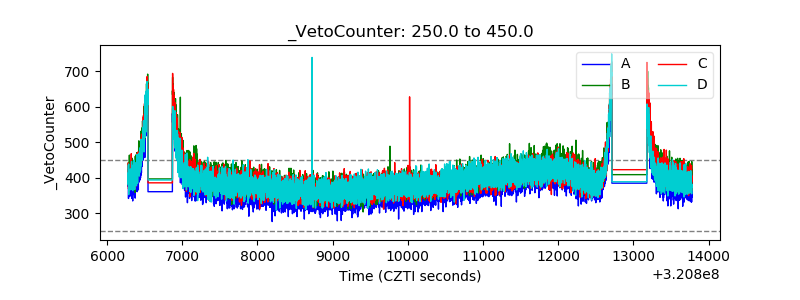 |