| Param | Original file | Final file |
|---|---|---|
| Filename | modeM0/AS1A07_101T02_9000003544cztM0_level2.fits | modeM0/AS1A07_101T02_9000003544cztM0_level2_quad_clean.evt |
| Size (bytes) | 1,333,203,840 | 1,196,985,600 |
| Size | 1.2 GB | 1.1 GB |
| Events in quadrant A | 8,492,334 | 7,175,413 |
| Events in quadrant B | 8,042,964 | 7,174,872 |
| Events in quadrant C | 8,231,906 | 6,948,540 |
| Events in quadrant D | 6,504,106 | 5,855,286 |
| Mode SS | |||
|---|---|---|---|
| Quadrant | BADHDUFLAG | Total packets | Discarded packets |
| A | 0 | 2642 | 0 |
| B | 0 | 2642 | 0 |
| C | 0 | 2642 | 0 |
| D | 0 | 2642 | 0 |
| Mode M0 | |||
|---|---|---|---|
| Quadrant | BADHDUFLAG | Total packets | Discarded packets |
| A | 0 | 279252 | 0 |
| B | 0 | 295008 | 0 |
| C | 0 | 284284 | 0 |
| D | 0 | 478267 | 0 |
| Mode M9 | |||
|---|---|---|---|
| Quadrant | BADHDUFLAG | Total packets | Discarded packets |
| A | 0 | 220 | 0 |
| B | 0 | 220 | 0 |
| C | 0 | 220 | 0 |
| D | 0 | 220 | 0 |
| Quadrant | Total seconds | Saturated seconds | Saturation percentage |
|---|---|---|---|
| A | 132966 | 1405 | 1.056661% |
| B | 132964 | 2610 | 1.962937% |
| C | 132964 | 2578 | 1.938871% |
| D | 132967 | 22382 | 16.832748% |
Noise dominated data is calculated using 1-second bins in cleaned event files. If a bin has >2000 counts, and if more than 50% of those come from <1% of pixels, then it is considered to be noise-dominated and hence unusable.
| Quadrant | # 1 sec bins | Bins with >0 counts | Bins with >2000 counts | High rate bins dominated by noise | Noise dominated (total time) | Noise dominated (detector-on time) | Marked lightcurve |
|---|---|---|---|---|---|---|---|
| A | 155416 | 132974 | 0 | 0 | 0.00% | 0.00% | 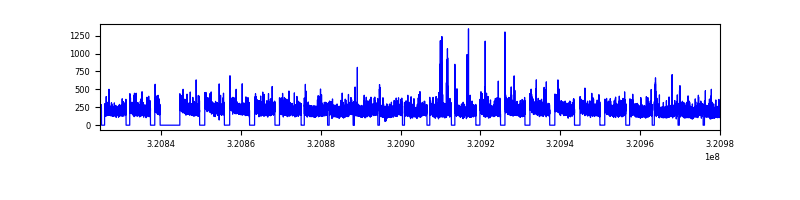 |
| B | 155416 | 132972 | 0 | 0 | 0.00% | 0.00% | 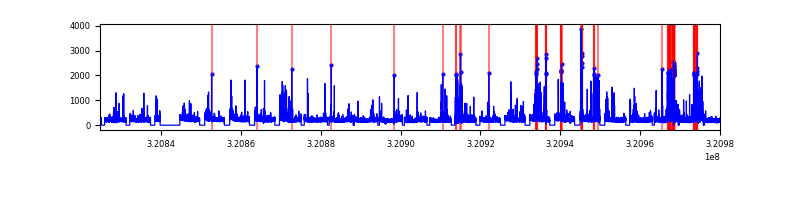 |
| C | 155416 | 132972 | 0 | 0 | 0.00% | 0.00% | 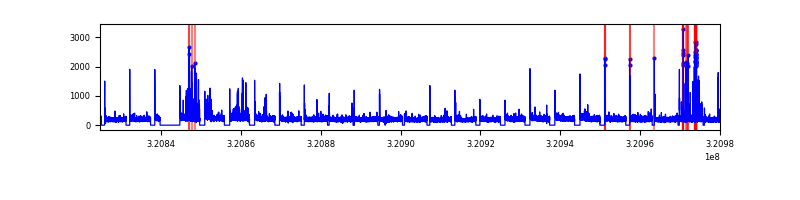 |
| D | 155416 | 130701 | 0 | 0 | 0.00% | 0.00% | 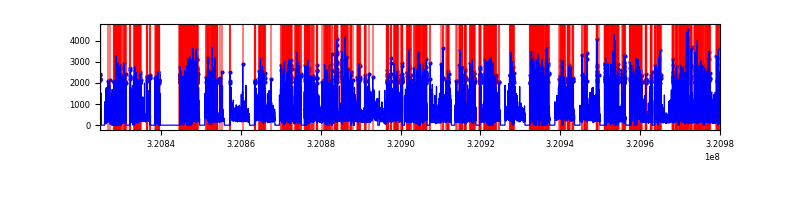 |
Top three noisy pixels from each quadrant. If the there are fewer than three noisy pixels in the level2.evt file, extra rows are filled as -1
| Pixel properties | Quadrant properties | ||||||
|---|---|---|---|---|---|---|---|
| Quadrant | DetID | PixID | Counts | Sigma | Mean | Median | Sigma |
| A | 0 | 29 | 8125 | 11.14 | 2214 | 2081 | 542.4 |
| A | 7 | 110 | 6605 | 8.34 | 2214 | 2081 | 542.4 |
| A | 0 | 30 | 6332 | 7.84 | 2214 | 2081 | 542.4 |
| B | 2 | 9 | 6521 | 10.98 | 2126 | 2037 | 408.2 |
| B | 2 | 8 | 5377 | 8.18 | 2126 | 2037 | 408.2 |
| B | 5 | 128 | 5374 | 8.17 | 2126 | 2037 | 408.2 |
| C | 1 | 80 | 6283 | 7.76 | 2174 | 2044 | 546.5 |
| C | 1 | 81 | 6240 | 7.68 | 2174 | 2044 | 546.5 |
| C | 3 | 126 | 5600 | 6.51 | 2174 | 2044 | 546.5 |
| D | 3 | 14 | 4737 | 6.26 | 1860 | 1701 | 485.2 |
| D | 15 | 46 | 4634 | 6.05 | 1860 | 1701 | 485.2 |
| D | 10 | 189 | 4575 | 5.92 | 1860 | 1701 | 485.2 |
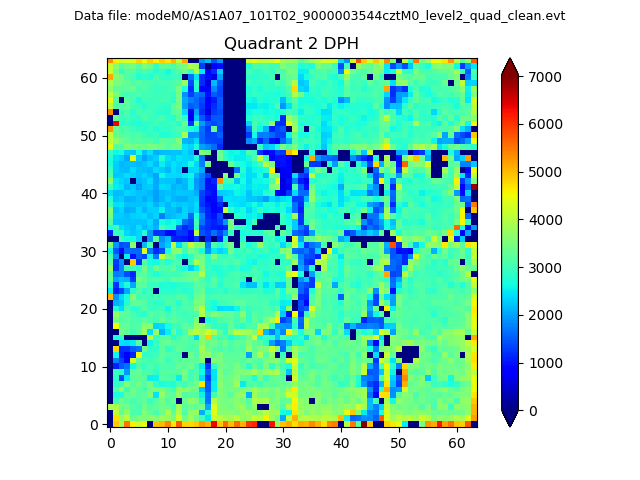
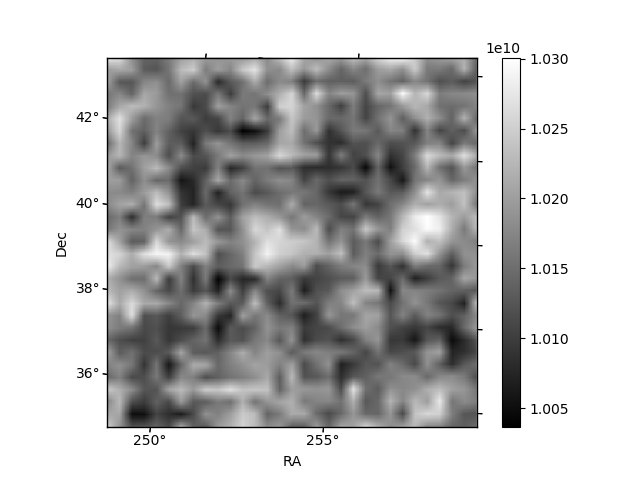
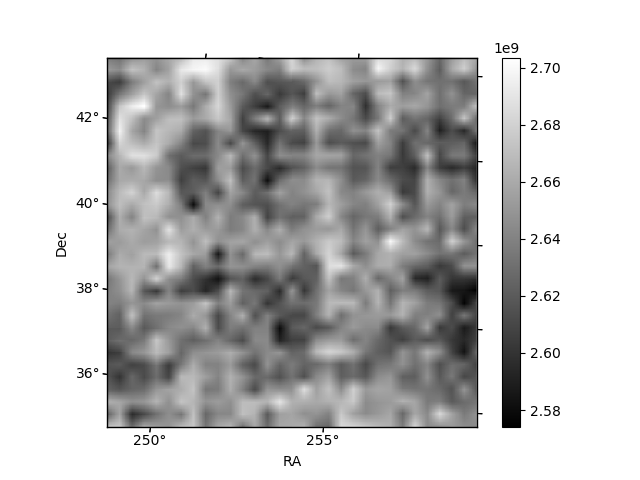
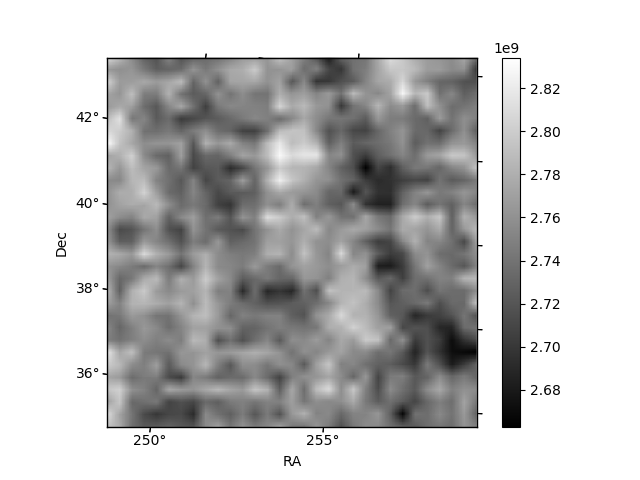
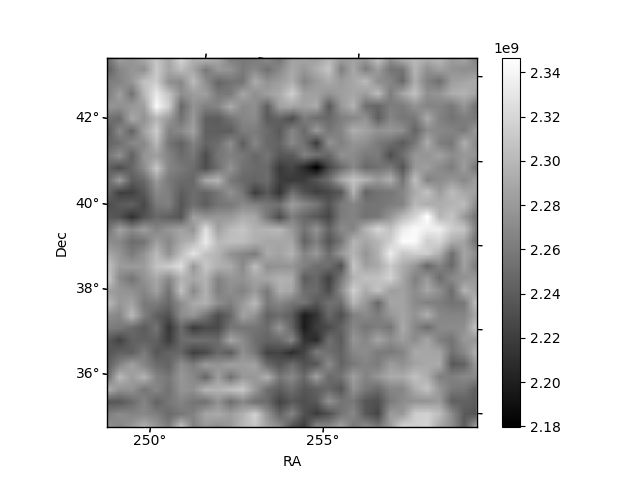
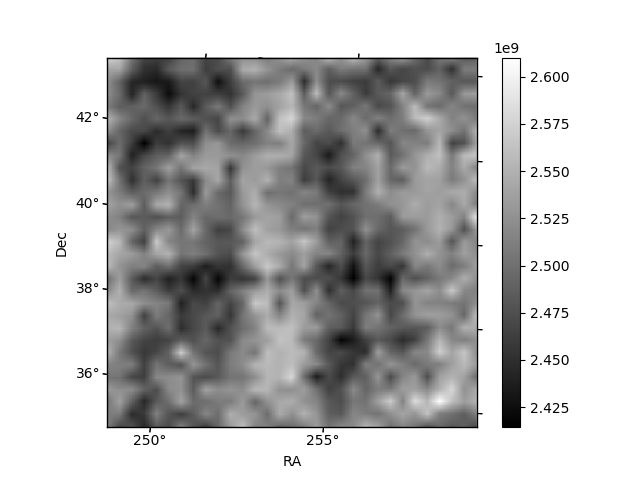
Histogram calculated using DETX and DETY for each event in the final _common_clean file
| Quadrant A | 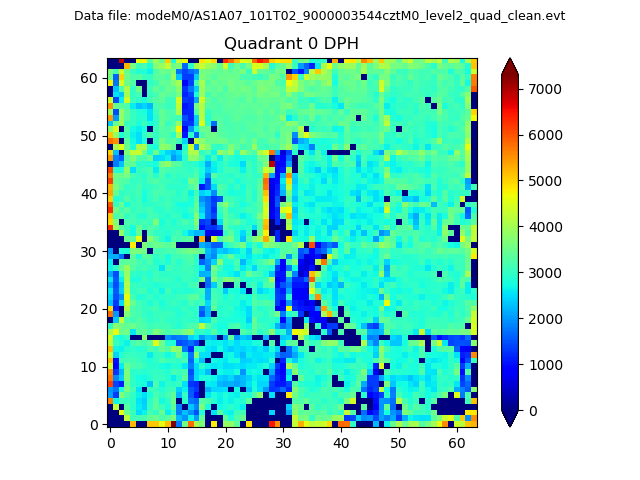 |
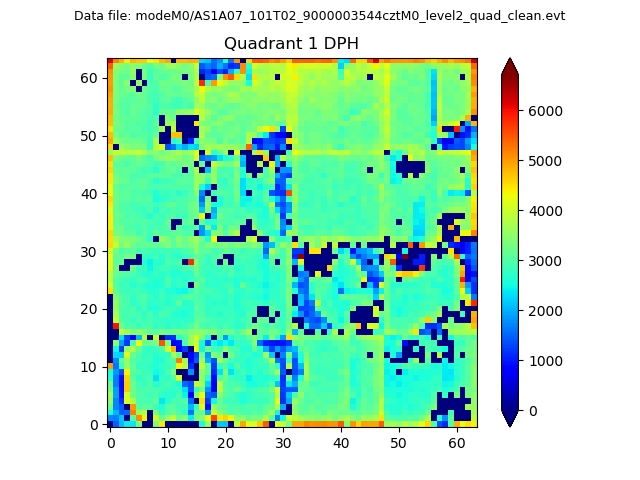 |
Quadrant B |
|---|---|---|---|
| Quadrant D | 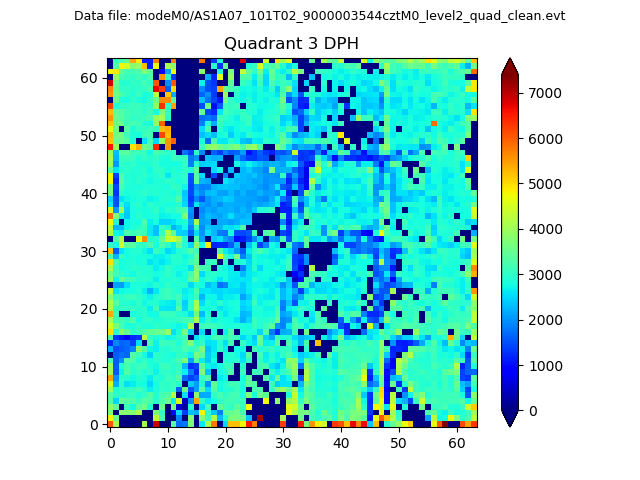 |
 |
Quadrant C |
| Plot type | Count rate plots | Images |
|---|---|---|
| Comparison with Poisson distribution Blue bars denote a histogram of data divided into 1 sec bins. Red curve is a Poisson curve with rate = median count rate of data. |
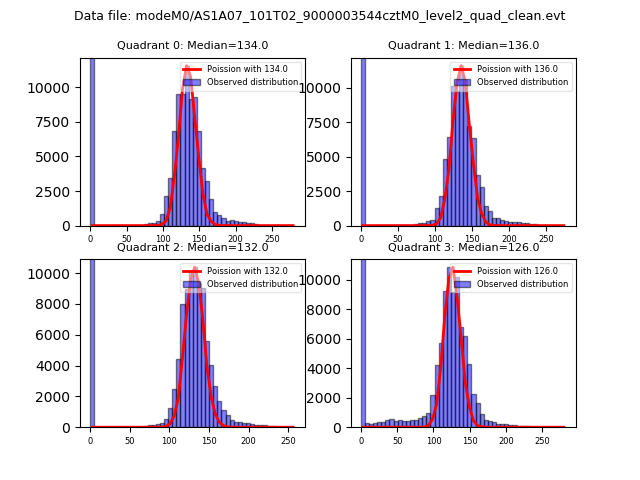 |
 |
| Quadrant-wise count rates Data is divided into 100 sec bins |
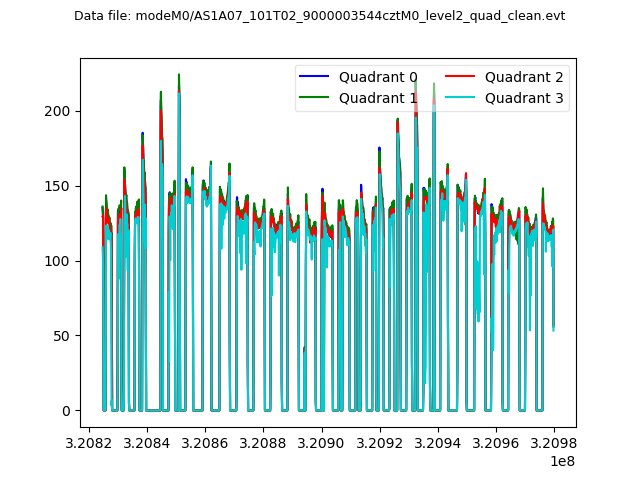 |
|
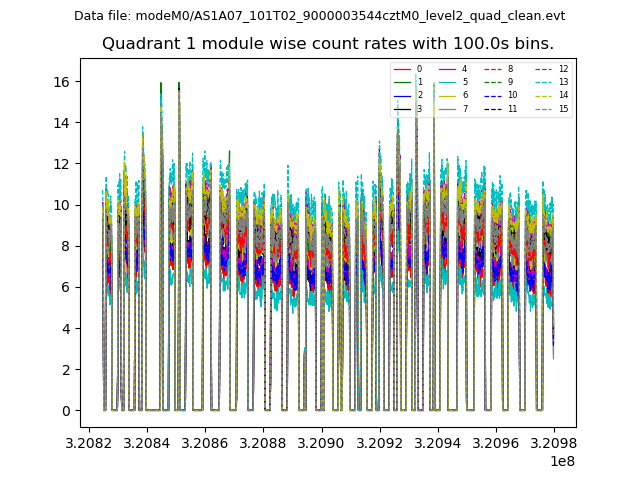
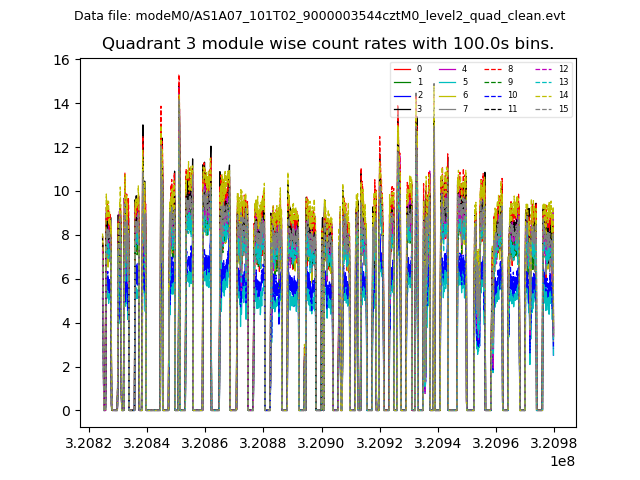
| Module-wise count rates for Quadrant A Data is divided into 100 sec bins |
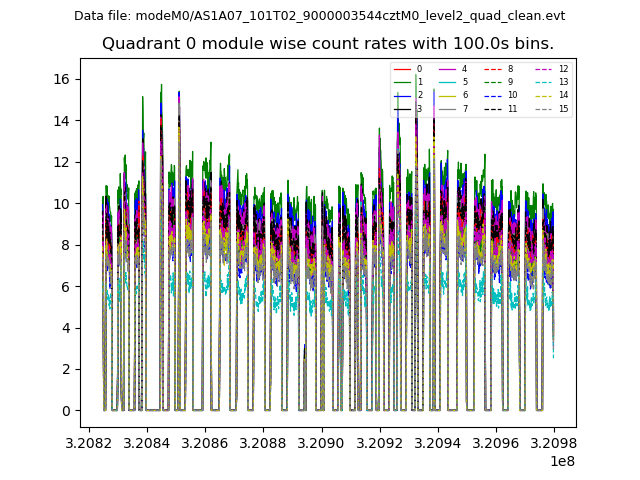 |
 |
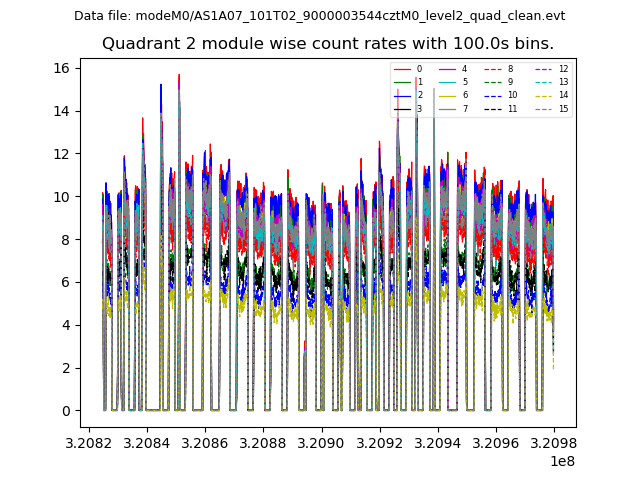
| Module-wise count rates for Quadrant B Data is divided into 100 sec bins |
 |
 |
| Module-wise count rates for Quadrant C Data is divided into 100 sec bins |
 |
 |
| Module-wise count rates for Quadrant D Data is divided into 100 sec bins |
 |
 |
| Parameter | Plot |
|---|---|
| CZT HV Monitor | 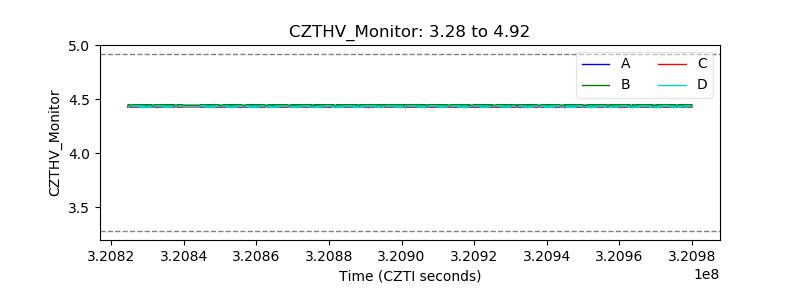 |
| D_VDD | 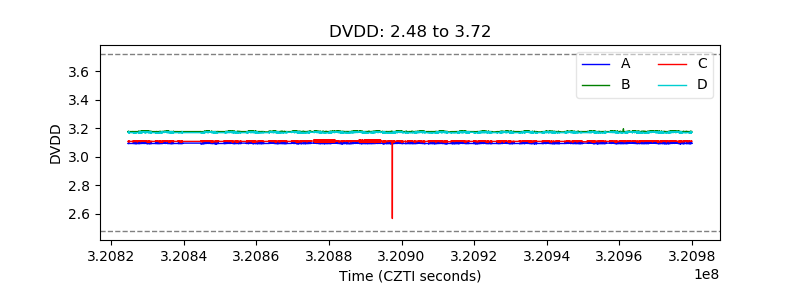 |
| Temperature 1 | 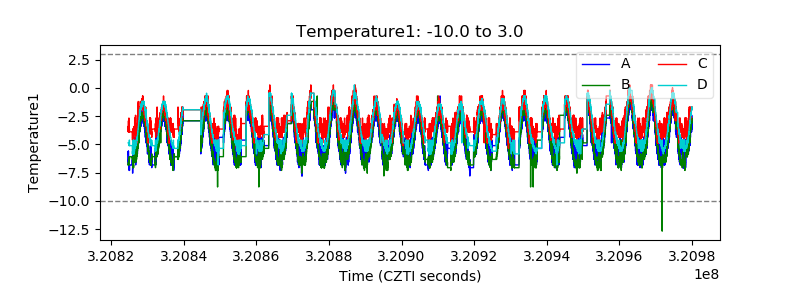 |
| Veto HV Monitor | 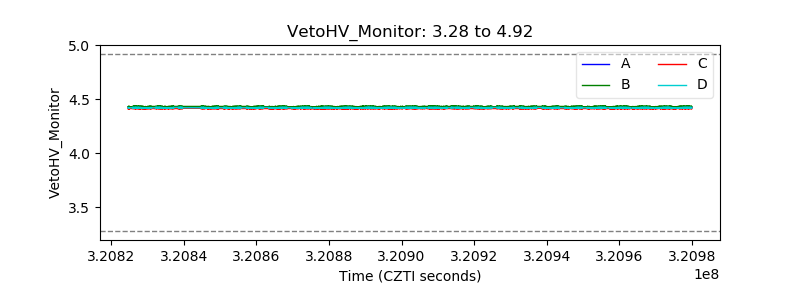 |
| Veto LLD | 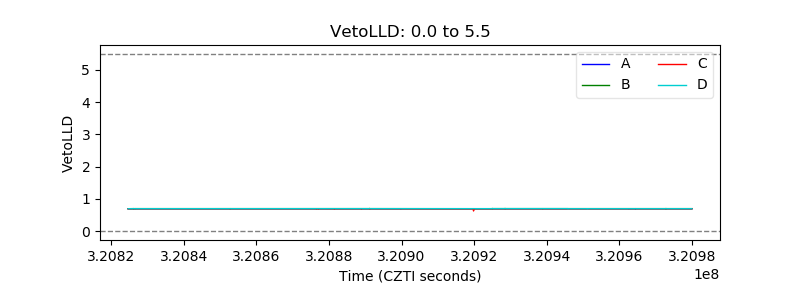 |
| Alpha Counter | 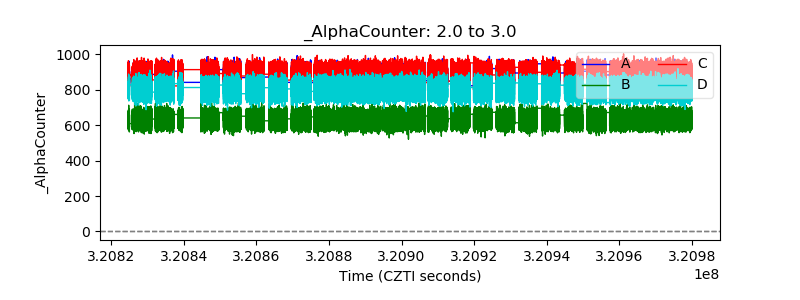 |
| _CPM_Rate | 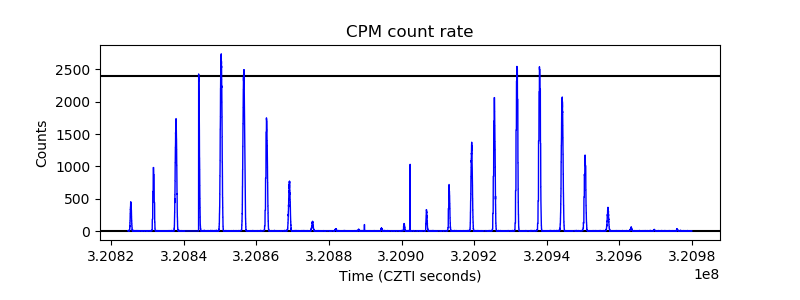 |
| CZT Counter | 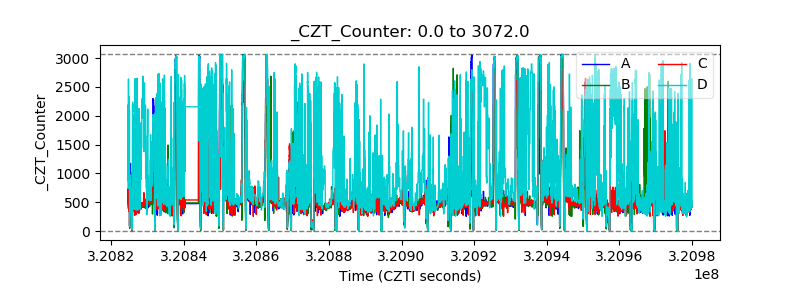 |
| +2.5 Volts monitor | 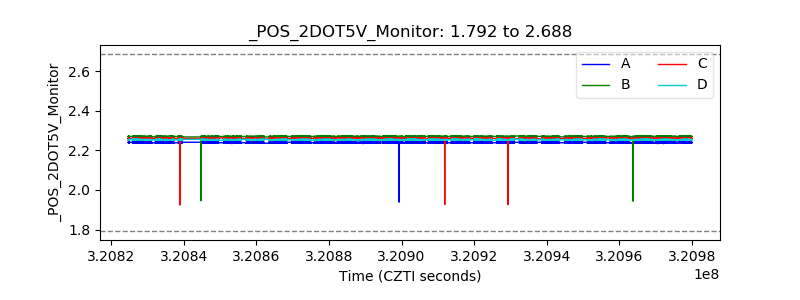 |
| +5 Volts monitor | 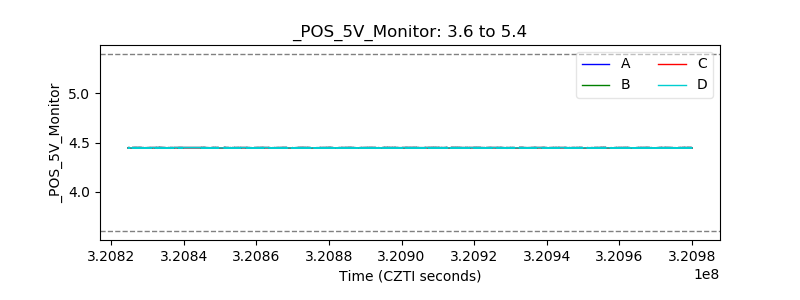 |
| _ROLL_ROT | 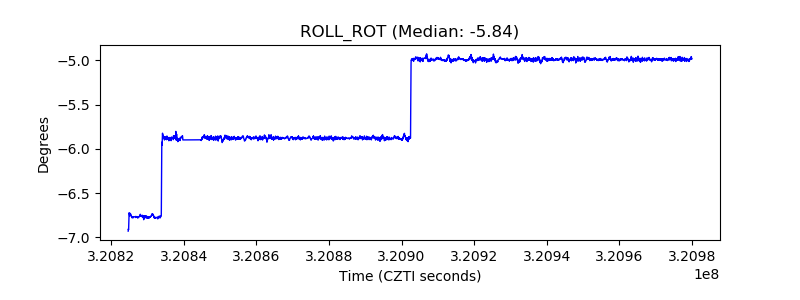 |
| _Roll_DEC | 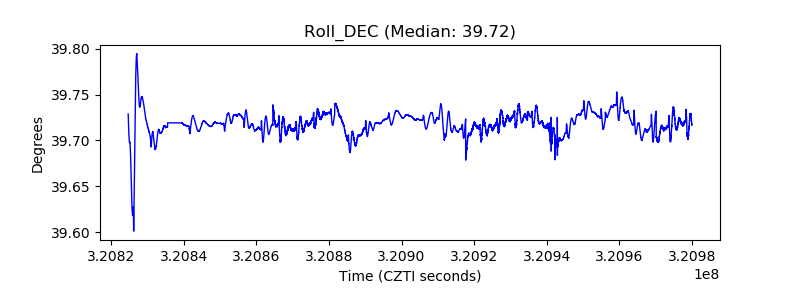 |
| _Roll_RA | 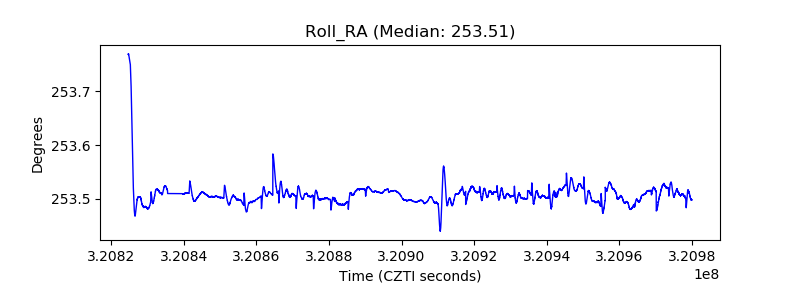 |
| Veto Counter | 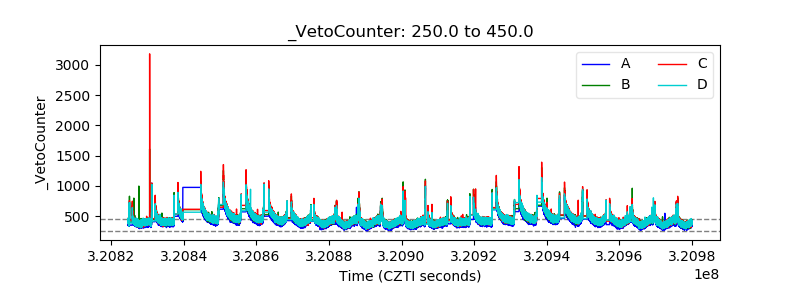 |