| Param | Original file | Final file |
|---|---|---|
| Filename | modeM0/AS1A07_101T02_9000003544_23936cztM0_level2.evt | modeM0/AS1A07_101T02_9000003544_23936cztM0_level2_quad_clean.evt |
| Size (bytes) | 553,138,560 | 82,402,560 |
| Size | 527.5 MB | 78.6 MB |
| Events in quadrant A | 2,864,074 | 541,053 |
| Events in quadrant B | 2,920,627 | 552,385 |
| Events in quadrant C | 2,885,904 | 529,976 |
| Events in quadrant D | 7,666,470 | 445,677 |
| Mode SS | |||
|---|---|---|---|
| Quadrant | BADHDUFLAG | Total packets | Discarded packets |
| A | 0 | 124 | 0 |
| B | 0 | 124 | 0 |
| C | 0 | 124 | 0 |
| D | 0 | 124 | 0 |
| Mode M0 | |||
|---|---|---|---|
| Quadrant | BADHDUFLAG | Total packets | Discarded packets |
| A | 0 | 12370 | 1 |
| B | 0 | 12462 | 1 |
| C | 0 | 12405 | 1 |
| D | 0 | 26973 | 1 |
| Mode M9 | |||
|---|---|---|---|
| Quadrant | BADHDUFLAG | Total packets | Discarded packets |
| A | 0 | 9 | 0 |
| B | 0 | 9 | 0 |
| C | 0 | 9 | 0 |
| D | 0 | 9 | 0 |
| Quadrant | Total seconds | Saturated seconds | Saturation percentage |
|---|---|---|---|
| A | 6097 | 52 | 0.852878% |
| B | 6098 | 52 | 0.852739% |
| C | 6098 | 74 | 1.213513% |
| D | 6098 | 2680 | 43.948836% |
Noise dominated data is calculated using 1-second bins in cleaned event files. If a bin has >2000 counts, and if more than 50% of those come from <1% of pixels, then it is considered to be noise-dominated and hence unusable.
| Quadrant | # 1 sec bins | Bins with >0 counts | Bins with >2000 counts | High rate bins dominated by noise | Noise dominated (total time) | Noise dominated (detector-on time) | Marked lightcurve |
|---|---|---|---|---|---|---|---|
| A | 7027 | 6098 | 0 | 0 | 0.00% | 0.00% | 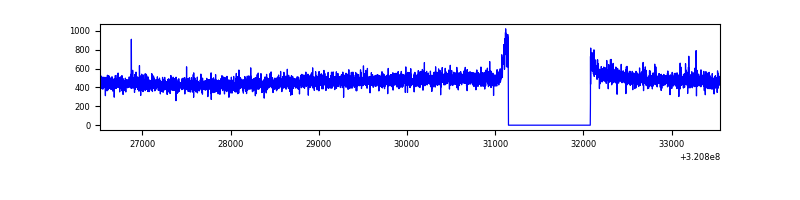 |
| B | 7028 | 6099 | 1 | 1 | 0.01% | 0.02% | 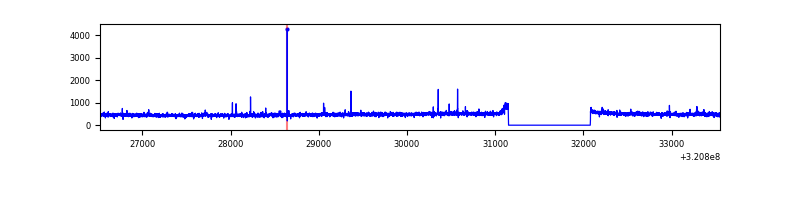 |
| C | 7028 | 6099 | 2 | 2 | 0.03% | 0.03% | 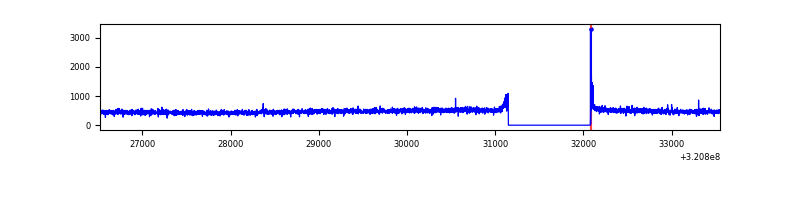 |
| D | 7028 | 6099 | 1318 | 1318 | 18.75% | 21.61% | 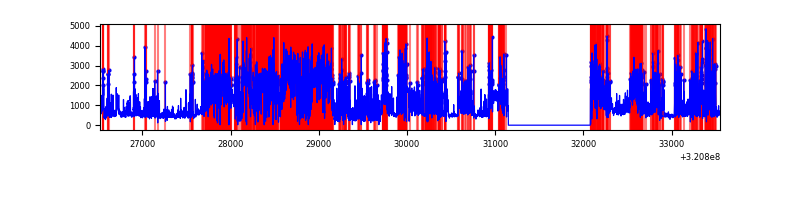 |
Top three noisy pixels from each quadrant. If the there are fewer than three noisy pixels in the level2.evt file, extra rows are filled as -1
| Pixel properties | Quadrant properties | ||||||
|---|---|---|---|---|---|---|---|
| Quadrant | DetID | PixID | Counts | Sigma | Mean | Median | Sigma |
| A | 13 | 254 | 8563 | 52.36 | 742 | 726 | 149.7 |
| A | 3 | 137 | 6663 | 39.66 | 742 | 726 | 149.7 |
| A | 0 | 226 | 6396 | 37.88 | 742 | 726 | 149.7 |
| B | 12 | 111 | 16980 | 115.21 | 736 | 717 | 141.2 |
| B | 11 | 111 | 15363 | 103.75 | 736 | 717 | 141.2 |
| B | 14 | 111 | 13629 | 91.47 | 736 | 717 | 141.2 |
| C | 14 | 238 | 111632 | 672.28 | 704 | 708 | 165.0 |
| C | 0 | 10 | 17413 | 101.24 | 704 | 708 | 165.0 |
| C | 7 | 247 | 7928 | 43.76 | 704 | 708 | 165.0 |
| D | 12 | 218 | 4058221 | 33200.83 | 498 | 483 | 122.2 |
| D | 1 | 52 | 1008546 | 8248.08 | 498 | 483 | 122.2 |
| D | 12 | 250 | 311599 | 2545.58 | 498 | 483 | 122.2 |
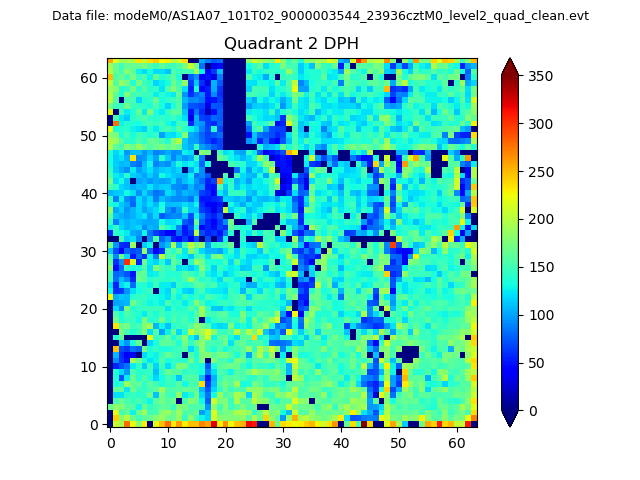
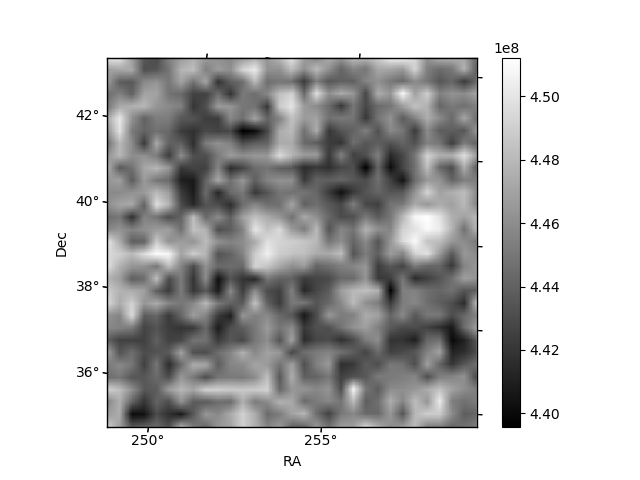
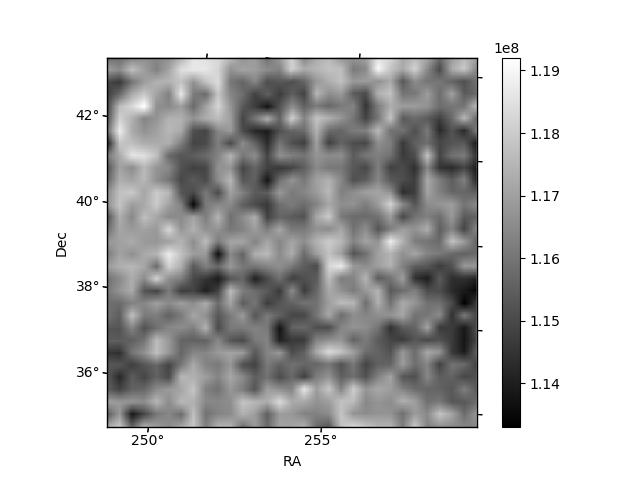
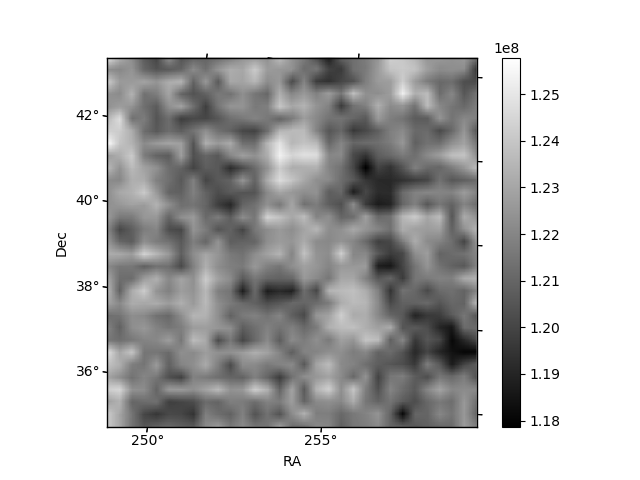
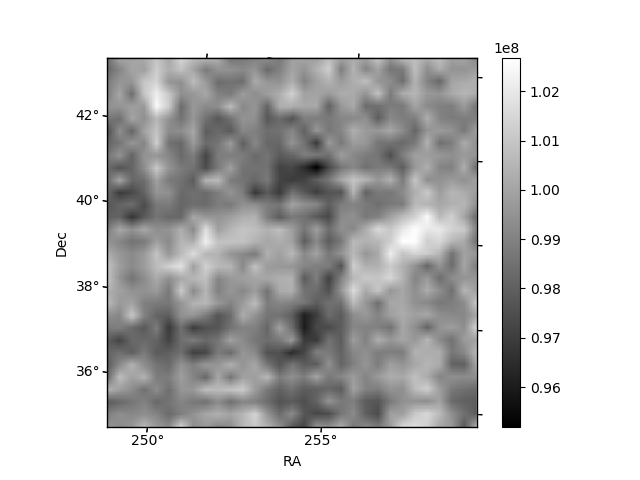
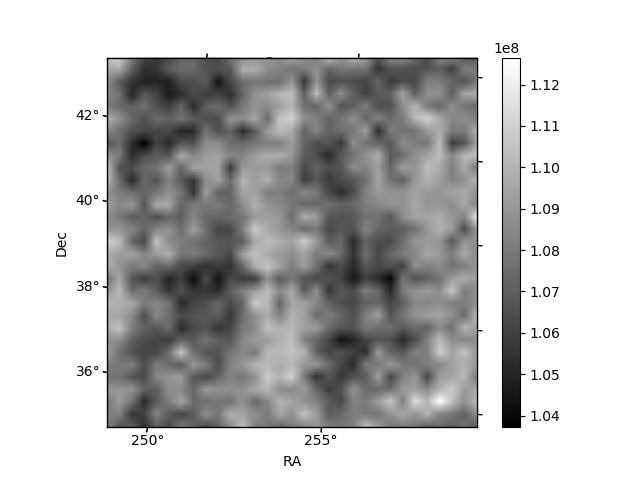
Histogram calculated using DETX and DETY for each event in the final _common_clean file
| Quadrant A | 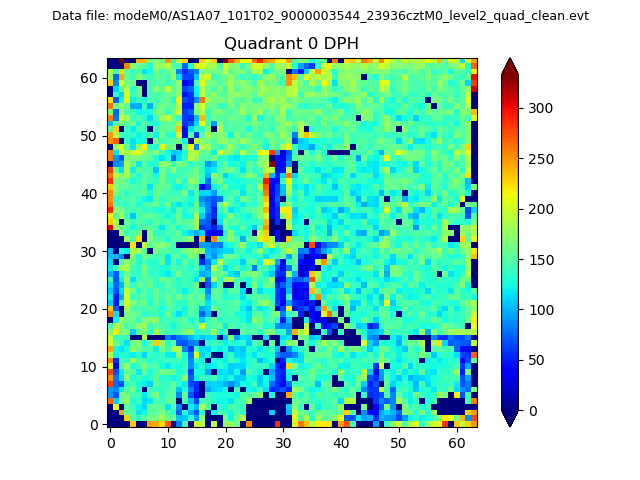 |
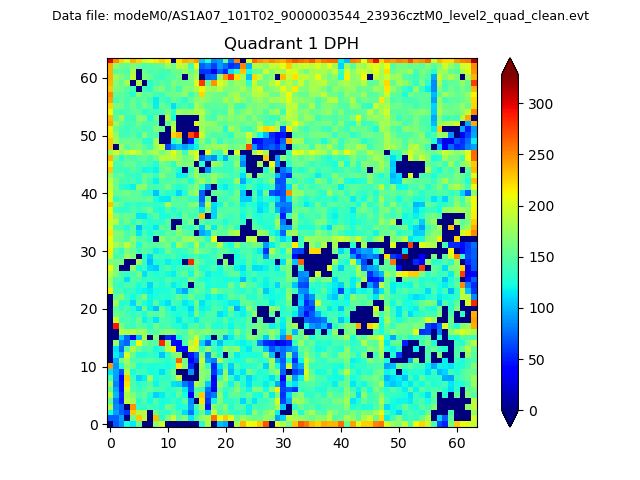 |
Quadrant B |
|---|---|---|---|
| Quadrant D | 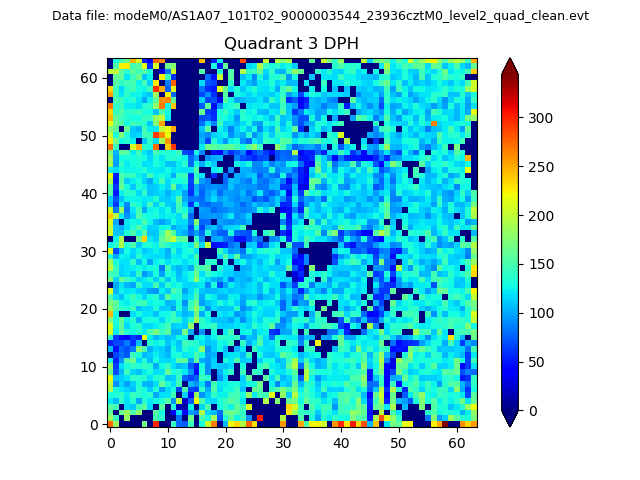 |
 |
Quadrant C |
| Plot type | Count rate plots | Images |
|---|---|---|
| Comparison with Poisson distribution Blue bars denote a histogram of data divided into 1 sec bins. Red curve is a Poisson curve with rate = median count rate of data. |
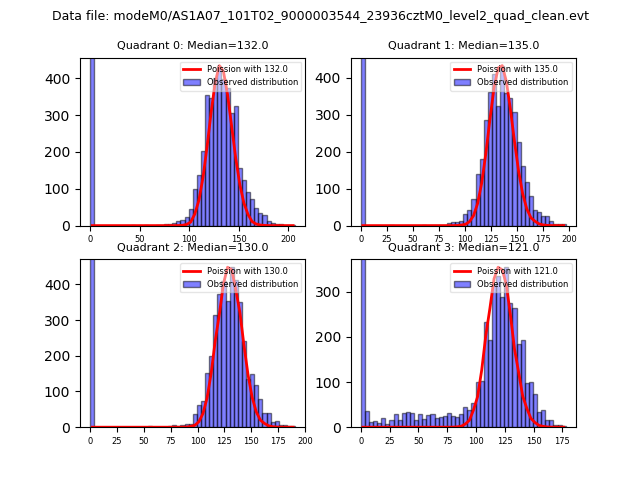 |
 |
| Quadrant-wise count rates Data is divided into 100 sec bins |
 |
|
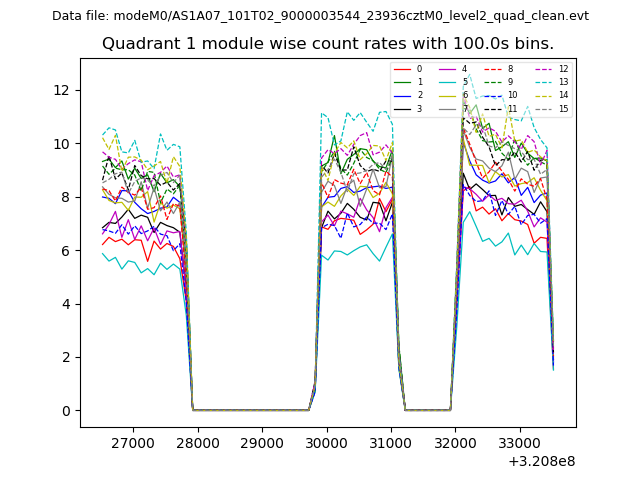
| Module-wise count rates for Quadrant A Data is divided into 100 sec bins |
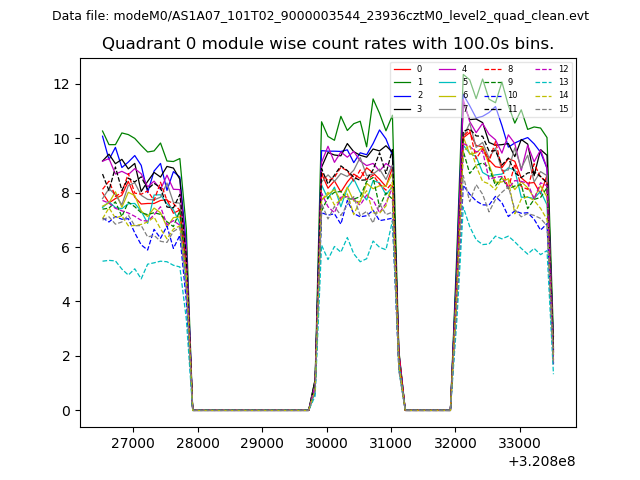 |
 |
| Module-wise count rates for Quadrant B Data is divided into 100 sec bins |
 |
 |
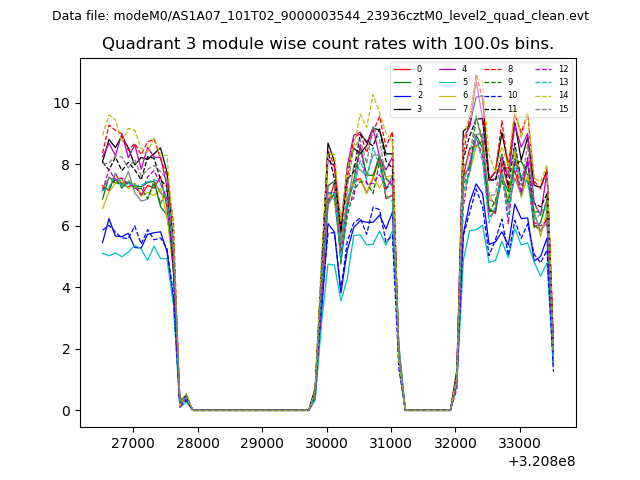
| Module-wise count rates for Quadrant C Data is divided into 100 sec bins |
 |
 |
| Module-wise count rates for Quadrant D Data is divided into 100 sec bins |
 |
 |
| Parameter | Plot |
|---|---|
| CZT HV Monitor | 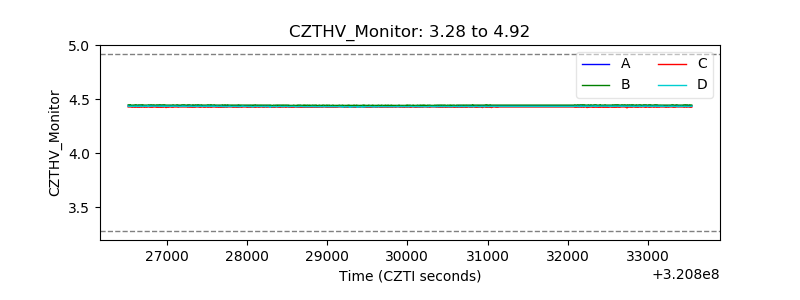 |
| D_VDD | 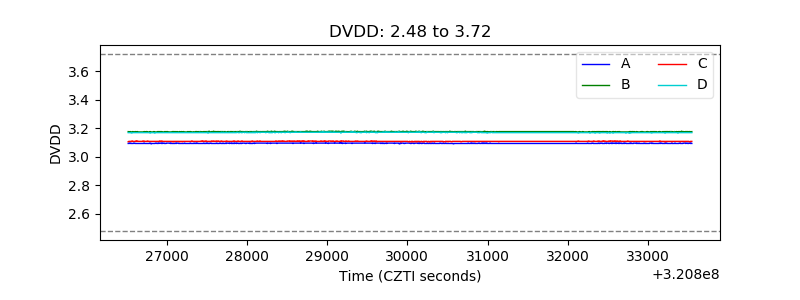 |
| Temperature 1 | 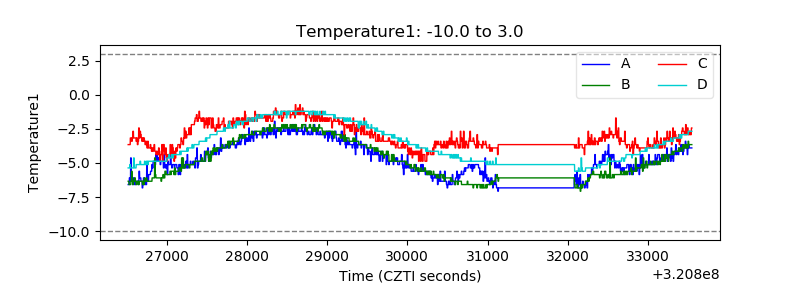 |
| Veto HV Monitor | 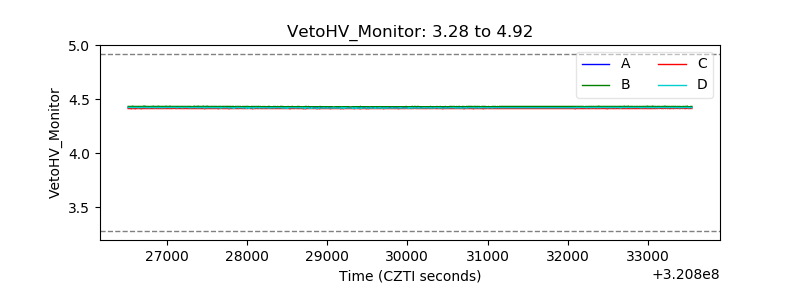 |
| Veto LLD | 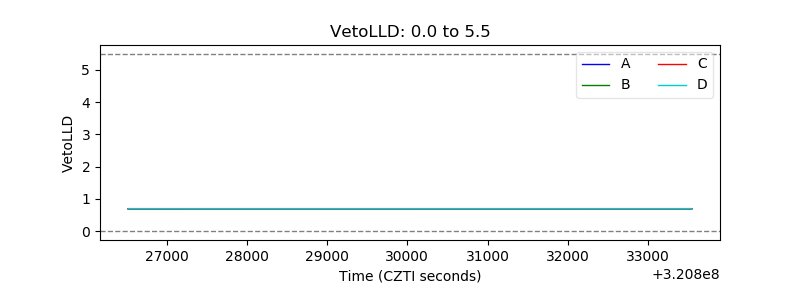 |
| Alpha Counter | 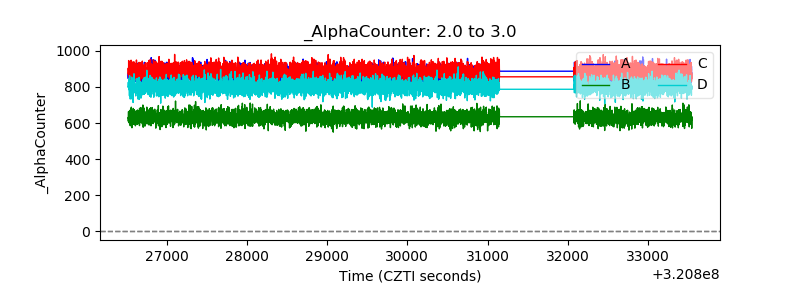 |
| _CPM_Rate | 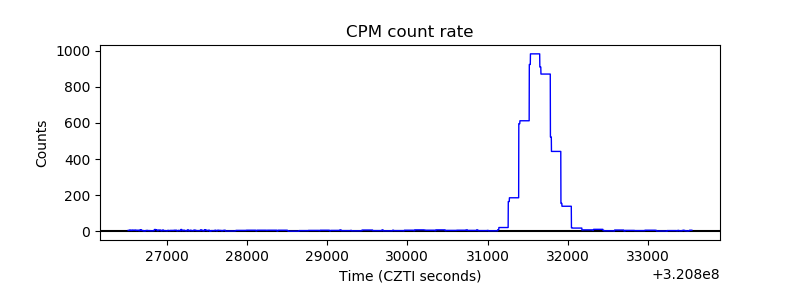 |
| CZT Counter | 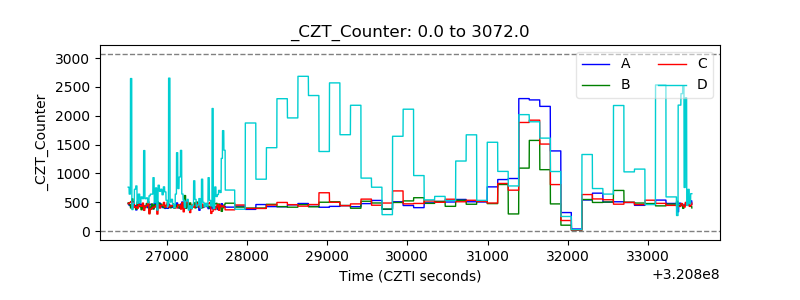 |
| +2.5 Volts monitor | 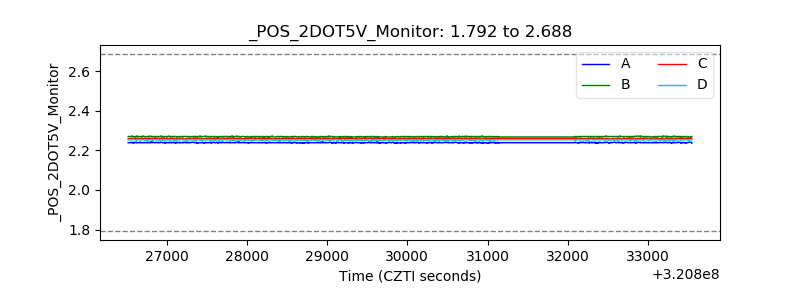 |
| +5 Volts monitor |  |
| _ROLL_ROT | 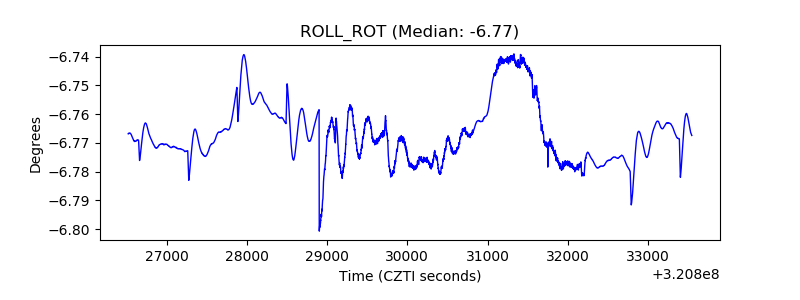 |
| _Roll_DEC | 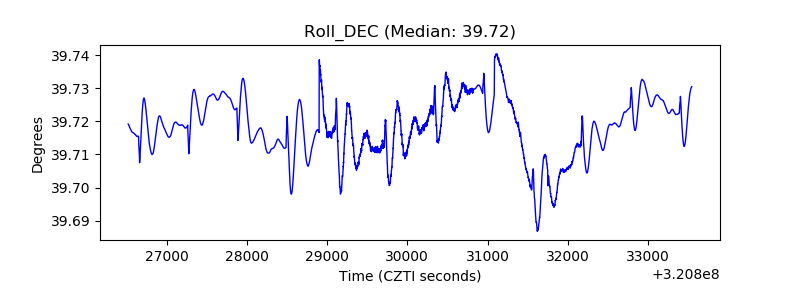 |
| _Roll_RA | 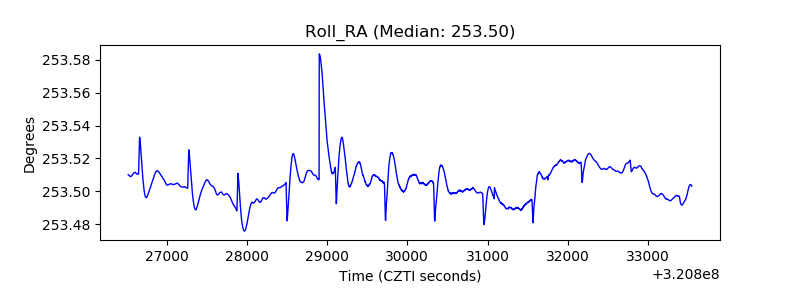 |
| Veto Counter | 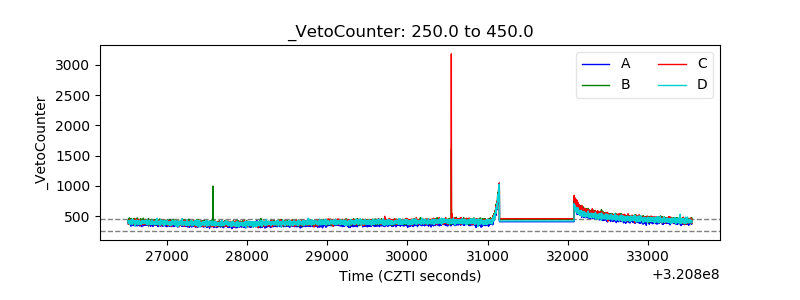 |