| Param | Original file | Final file |
|---|---|---|
| Filename | modeM0/AS1A07_101T02_9000003544_23938cztM0_level2.evt | modeM0/AS1A07_101T02_9000003544_23938cztM0_level2_quad_clean.evt |
| Size (bytes) | 502,839,360 | 84,870,720 |
| Size | 479.5 MB | 80.9 MB |
| Events in quadrant A | 2,955,288 | 558,283 |
| Events in quadrant B | 2,991,922 | 566,937 |
| Events in quadrant C | 2,961,477 | 541,955 |
| Events in quadrant D | 5,911,798 | 482,824 |
| Mode SS | |||
|---|---|---|---|
| Quadrant | BADHDUFLAG | Total packets | Discarded packets |
| A | 0 | 122 | 0 |
| B | 0 | 122 | 0 |
| C | 0 | 122 | 0 |
| D | 0 | 122 | 0 |
| Mode M0 | |||
|---|---|---|---|
| Quadrant | BADHDUFLAG | Total packets | Discarded packets |
| A | 0 | 12418 | 1 |
| B | 0 | 12517 | 1 |
| C | 0 | 12403 | 1 |
| D | 0 | 21688 | 2 |
| Mode M9 | |||
|---|---|---|---|
| Quadrant | BADHDUFLAG | Total packets | Discarded packets |
| A | 0 | 10 | 0 |
| B | 0 | 10 | 0 |
| C | 0 | 10 | 0 |
| D | 0 | 10 | 0 |
| Quadrant | Total seconds | Saturated seconds | Saturation percentage |
|---|---|---|---|
| A | 6012 | 52 | 0.864937% |
| B | 6013 | 59 | 0.981207% |
| C | 6013 | 76 | 1.263928% |
| D | 6012 | 909 | 15.119760% |
Noise dominated data is calculated using 1-second bins in cleaned event files. If a bin has >2000 counts, and if more than 50% of those come from <1% of pixels, then it is considered to be noise-dominated and hence unusable.
| Quadrant | # 1 sec bins | Bins with >0 counts | Bins with >2000 counts | High rate bins dominated by noise | Noise dominated (total time) | Noise dominated (detector-on time) | Marked lightcurve |
|---|---|---|---|---|---|---|---|
| A | 7087 | 6013 | 0 | 0 | 0.00% | 0.00% | 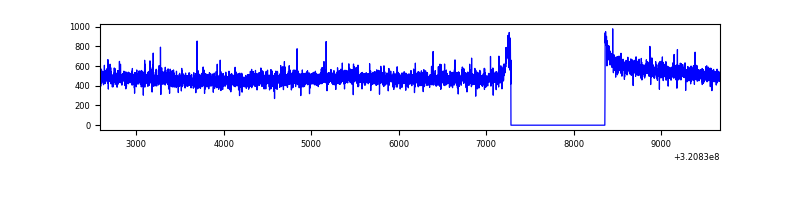 |
| B | 7088 | 6014 | 1 | 1 | 0.01% | 0.02% | 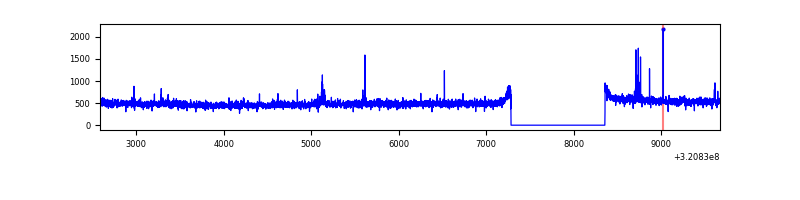 |
| C | 7088 | 6014 | 2 | 2 | 0.03% | 0.03% | 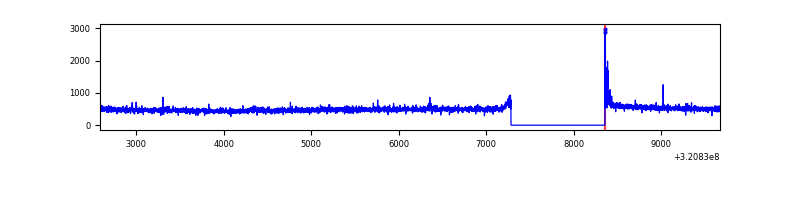 |
| D | 7087 | 6013 | 604 | 604 | 8.52% | 10.04% | 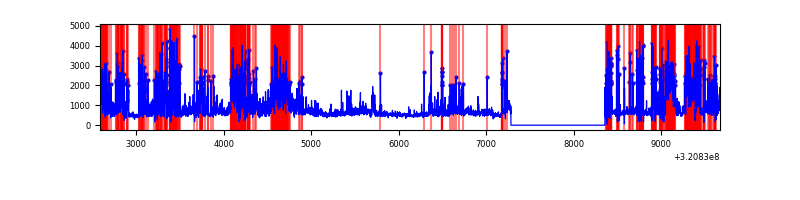 |
Top three noisy pixels from each quadrant. If the there are fewer than three noisy pixels in the level2.evt file, extra rows are filled as -1
| Pixel properties | Quadrant properties | ||||||
|---|---|---|---|---|---|---|---|
| Quadrant | DetID | PixID | Counts | Sigma | Mean | Median | Sigma |
| A | 2 | 250 | 19723 | 124.25 | 762 | 749 | 152.7 |
| A | 13 | 254 | 8627 | 51.59 | 762 | 749 | 152.7 |
| A | 3 | 137 | 6596 | 38.29 | 762 | 749 | 152.7 |
| B | 0 | 189 | 23040 | 158.15 | 750 | 732 | 141.1 |
| B | 12 | 111 | 17120 | 116.18 | 750 | 732 | 141.1 |
| B | 11 | 111 | 15378 | 103.83 | 750 | 732 | 141.1 |
| C | 14 | 238 | 115688 | 691.76 | 718 | 723 | 166.2 |
| C | 0 | 10 | 25140 | 146.92 | 718 | 723 | 166.2 |
| C | 3 | 233 | 11464 | 64.63 | 718 | 723 | 166.2 |
| D | 12 | 218 | 2363170 | 14383.37 | 684 | 664 | 164.3 |
| D | 8 | 195 | 521116 | 3168.61 | 684 | 664 | 164.3 |
| D | 1 | 52 | 126201 | 764.29 | 684 | 664 | 164.3 |
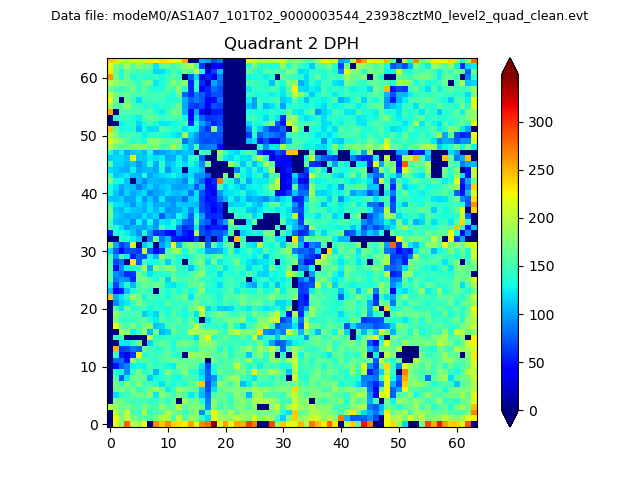
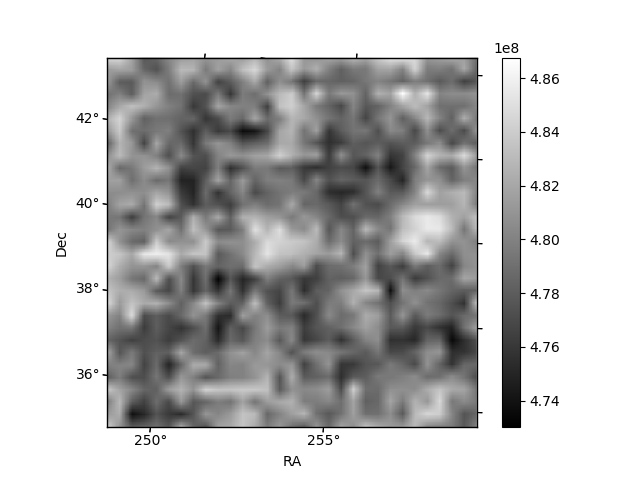
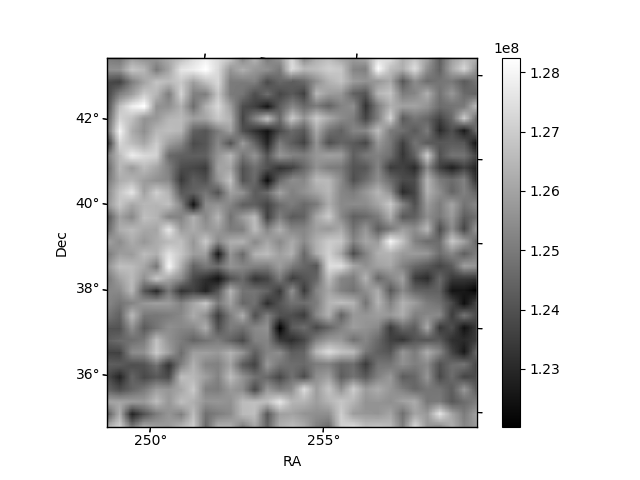
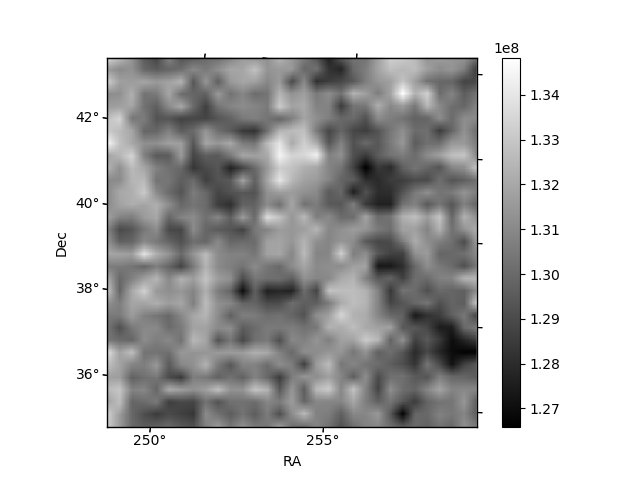
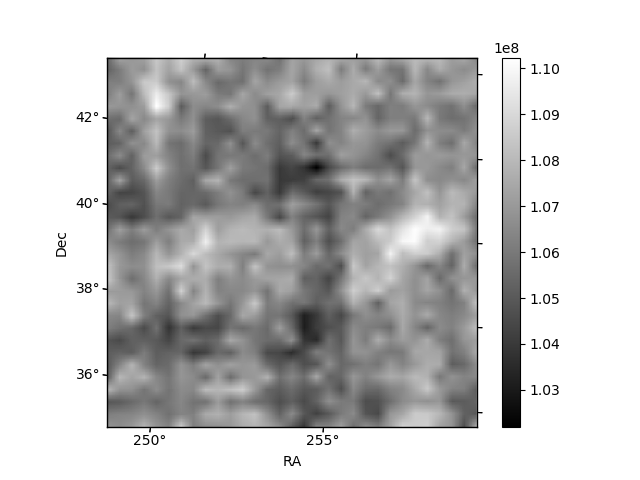
Histogram calculated using DETX and DETY for each event in the final _common_clean file
| Quadrant A | 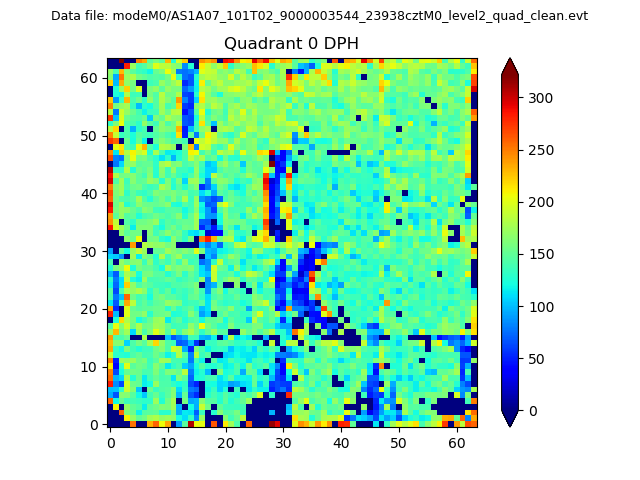 |
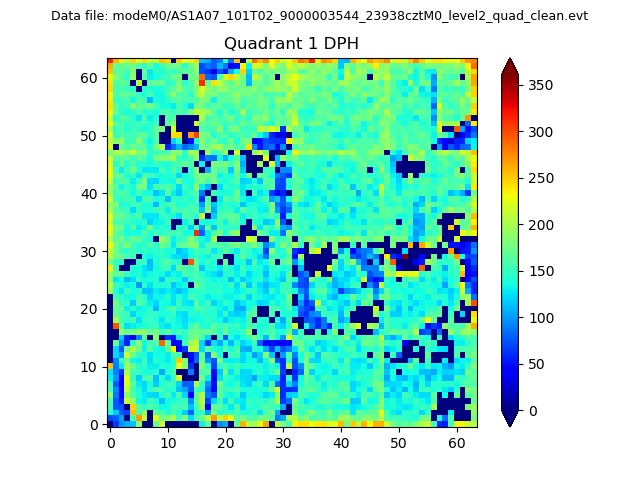 |
Quadrant B |
|---|---|---|---|
| Quadrant D | 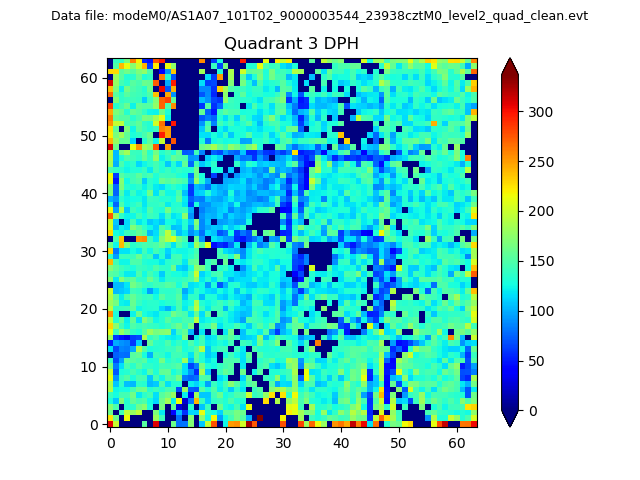 |
 |
Quadrant C |
| Plot type | Count rate plots | Images |
|---|---|---|
| Comparison with Poisson distribution Blue bars denote a histogram of data divided into 1 sec bins. Red curve is a Poisson curve with rate = median count rate of data. |
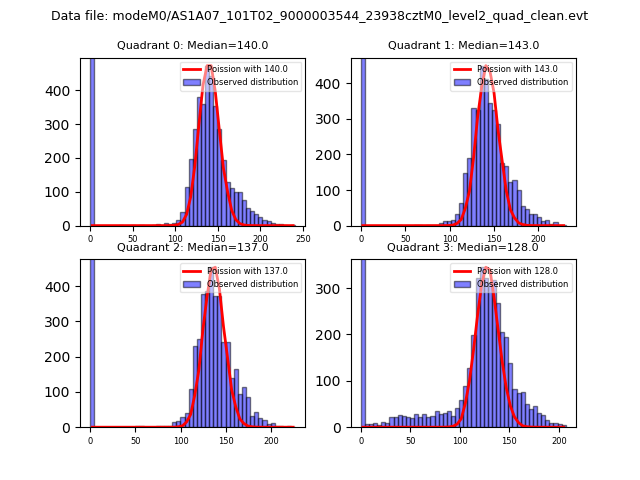 |
 |
| Quadrant-wise count rates Data is divided into 100 sec bins |
 |
|
| Module-wise count rates for Quadrant A Data is divided into 100 sec bins |
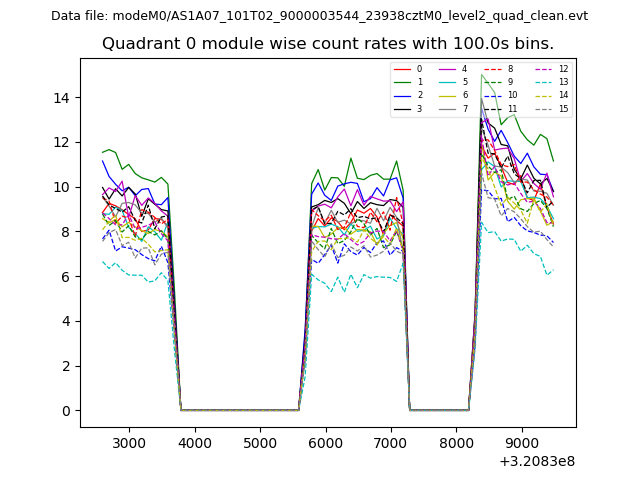 |
 |
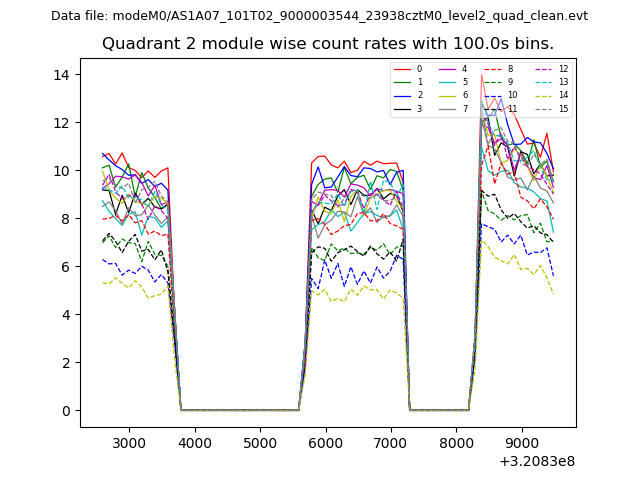
| Module-wise count rates for Quadrant B Data is divided into 100 sec bins |
 |
 |
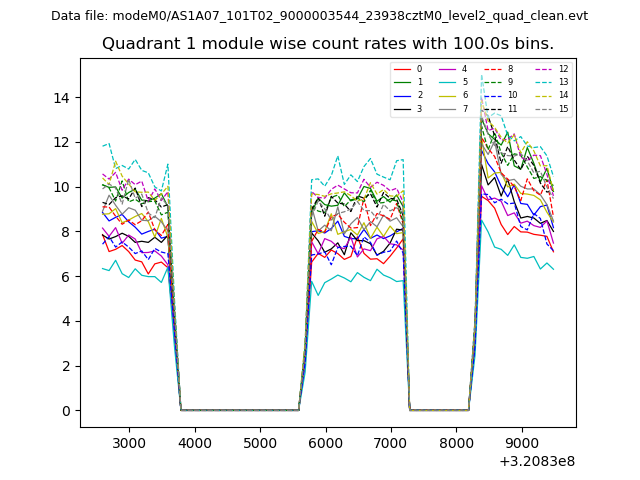
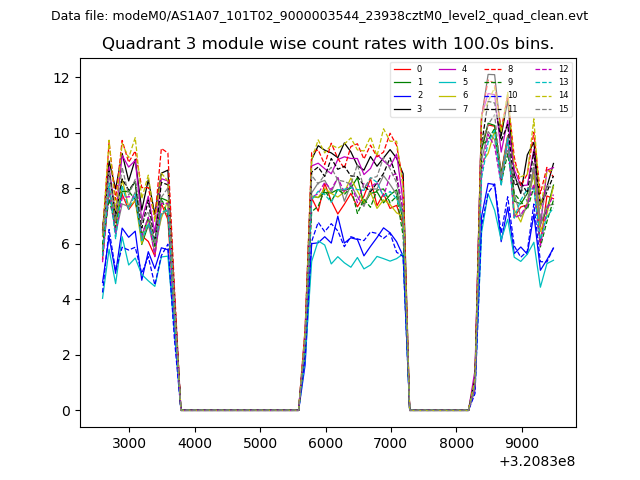
| Module-wise count rates for Quadrant C Data is divided into 100 sec bins |
 |
 |
| Module-wise count rates for Quadrant D Data is divided into 100 sec bins |
 |
 |
| Parameter | Plot |
|---|---|
| CZT HV Monitor | 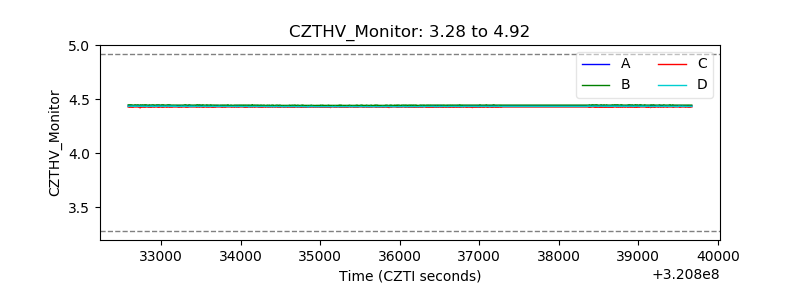 |
| D_VDD | 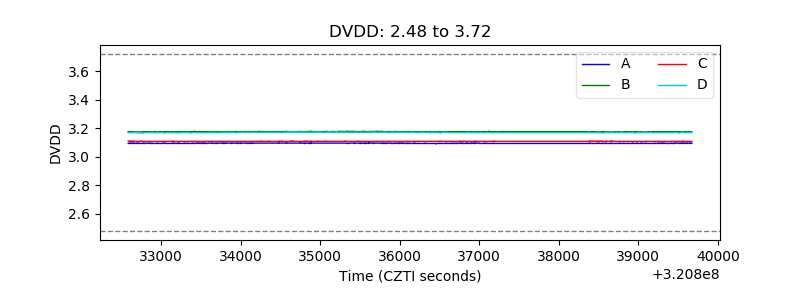 |
| Temperature 1 | 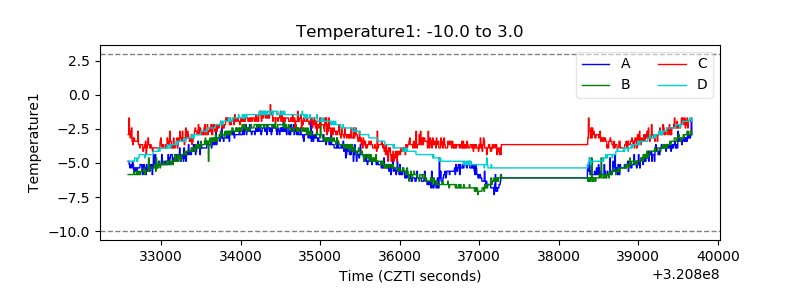 |
| Veto HV Monitor | 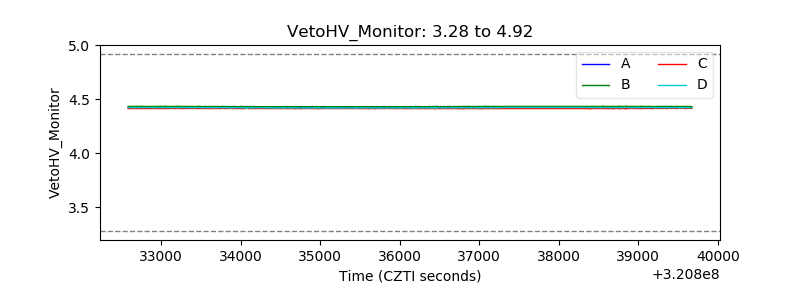 |
| Veto LLD | 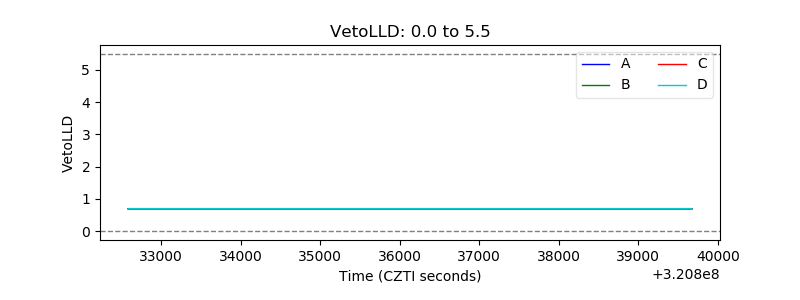 |
| Alpha Counter | 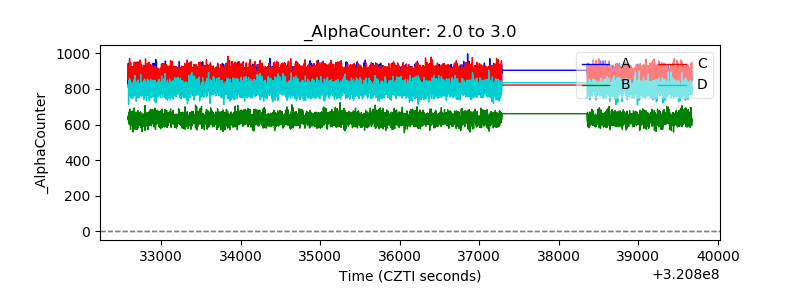 |
| _CPM_Rate | 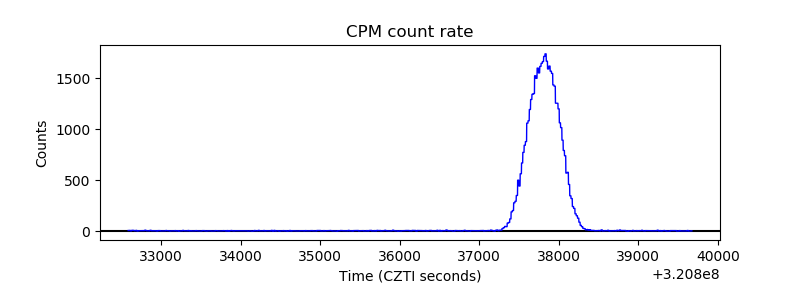 |
| CZT Counter | 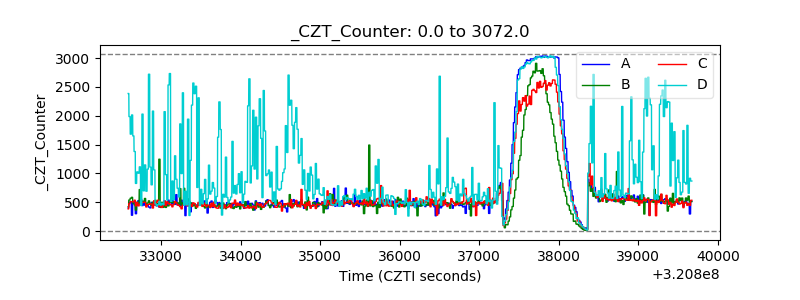 |
| +2.5 Volts monitor |  |
| +5 Volts monitor |  |
| _ROLL_ROT | 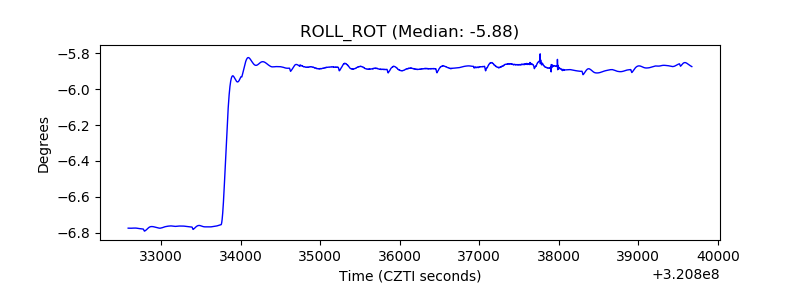 |
| _Roll_DEC | 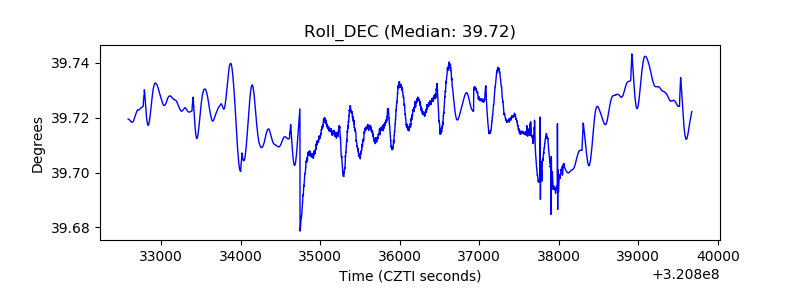 |
| _Roll_RA | 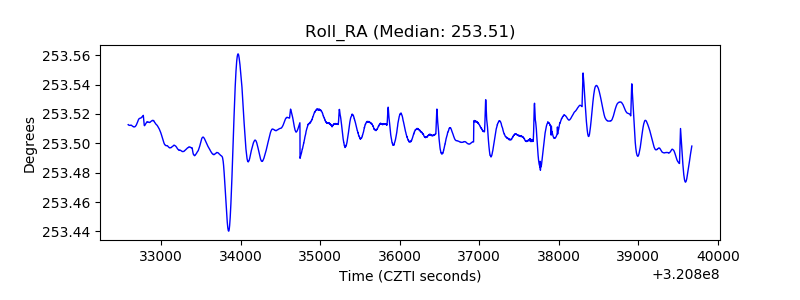 |
| Veto Counter | 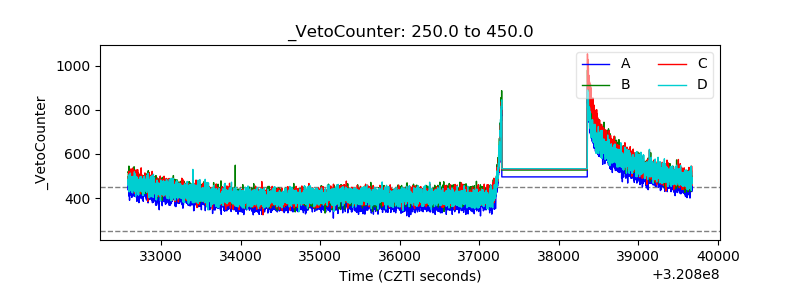 |