| Param | Original file | Final file |
|---|---|---|
| Filename | modeM0/AS1A07_101T02_9000003544_23943cztM0_level2.evt | modeM0/AS1A07_101T02_9000003544_23943cztM0_level2_quad_clean.evt |
| Size (bytes) | 528,900,480 | 80,570,880 |
| Size | 504.4 MB | 76.8 MB |
| Events in quadrant A | 3,257,211 | 505,375 |
| Events in quadrant B | 3,663,263 | 514,202 |
| Events in quadrant C | 3,416,775 | 500,259 |
| Events in quadrant D | 5,251,655 | 478,673 |
| Mode SS | |||
|---|---|---|---|
| Quadrant | BADHDUFLAG | Total packets | Discarded packets |
| A | 0 | 128 | 0 |
| B | 0 | 128 | 0 |
| C | 0 | 128 | 0 |
| D | 0 | 128 | 0 |
| Mode M0 | |||
|---|---|---|---|
| Quadrant | BADHDUFLAG | Total packets | Discarded packets |
| A | 0 | 13619 | 2 |
| B | 0 | 14954 | 1 |
| C | 0 | 13967 | 1 |
| D | 0 | 19995 | 1 |
| Mode M9 | |||
|---|---|---|---|
| Quadrant | BADHDUFLAG | Total packets | Discarded packets |
| A | 0 | 12 | 0 |
| B | 0 | 12 | 0 |
| C | 0 | 12 | 0 |
| D | 0 | 12 | 0 |
| Quadrant | Total seconds | Saturated seconds | Saturation percentage |
|---|---|---|---|
| A | 6324 | 64 | 1.012018% |
| B | 6325 | 126 | 1.992095% |
| C | 6325 | 125 | 1.976285% |
| D | 6325 | 583 | 9.217391% |
Noise dominated data is calculated using 1-second bins in cleaned event files. If a bin has >2000 counts, and if more than 50% of those come from <1% of pixels, then it is considered to be noise-dominated and hence unusable.
| Quadrant | # 1 sec bins | Bins with >0 counts | Bins with >2000 counts | High rate bins dominated by noise | Noise dominated (total time) | Noise dominated (detector-on time) | Marked lightcurve |
|---|---|---|---|---|---|---|---|
| A | 7484 | 6325 | 0 | 0 | 0.00% | 0.00% | 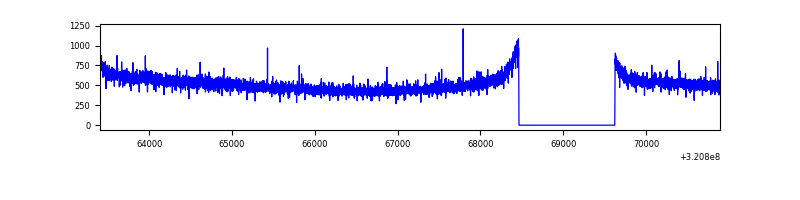 |
| B | 7485 | 6326 | 16 | 16 | 0.21% | 0.25% | 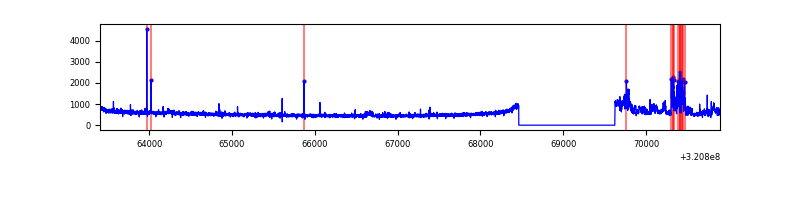 |
| C | 7485 | 6326 | 3 | 3 | 0.04% | 0.05% | 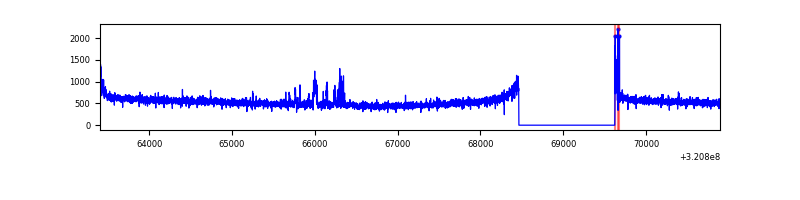 |
| D | 7484 | 6325 | 428 | 428 | 5.72% | 6.77% | 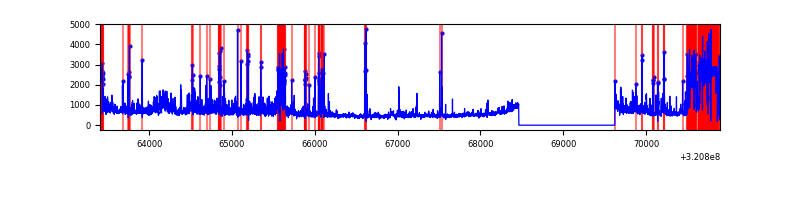 |
Top three noisy pixels from each quadrant. If the there are fewer than three noisy pixels in the level2.evt file, extra rows are filled as -1
| Pixel properties | Quadrant properties | ||||||
|---|---|---|---|---|---|---|---|
| Quadrant | DetID | PixID | Counts | Sigma | Mean | Median | Sigma |
| A | 13 | 254 | 9422 | 50.96 | 845 | 829 | 168.6 |
| A | 0 | 226 | 7234 | 37.98 | 845 | 829 | 168.6 |
| A | 3 | 137 | 7021 | 36.72 | 845 | 829 | 168.6 |
| B | 0 | 197 | 313163 | 1984.3 | 838 | 820 | 157.4 |
| B | 0 | 189 | 51302 | 320.71 | 838 | 820 | 157.4 |
| B | 12 | 111 | 18402 | 111.7 | 838 | 820 | 157.4 |
| C | 14 | 238 | 130631 | 691.18 | 818 | 823 | 187.8 |
| C | 10 | 9 | 64269 | 337.83 | 818 | 823 | 187.8 |
| C | 0 | 10 | 26465 | 136.53 | 818 | 823 | 187.8 |
| D | 12 | 218 | 1115847 | 5855.65 | 793 | 774 | 190.4 |
| D | 8 | 195 | 625754 | 3282.0 | 793 | 774 | 190.4 |
| D | 1 | 52 | 307100 | 1608.63 | 793 | 774 | 190.4 |
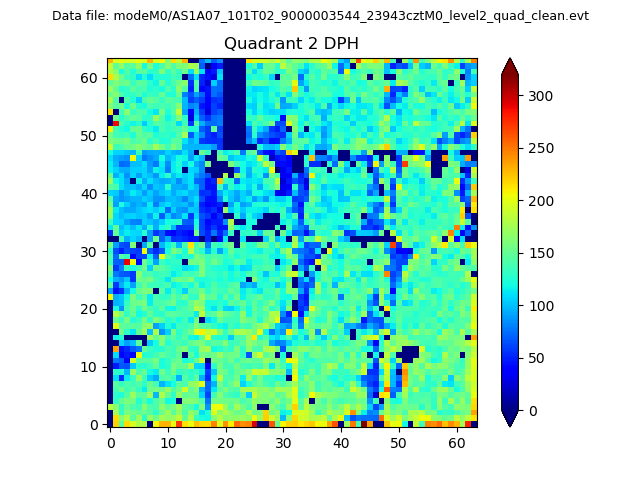
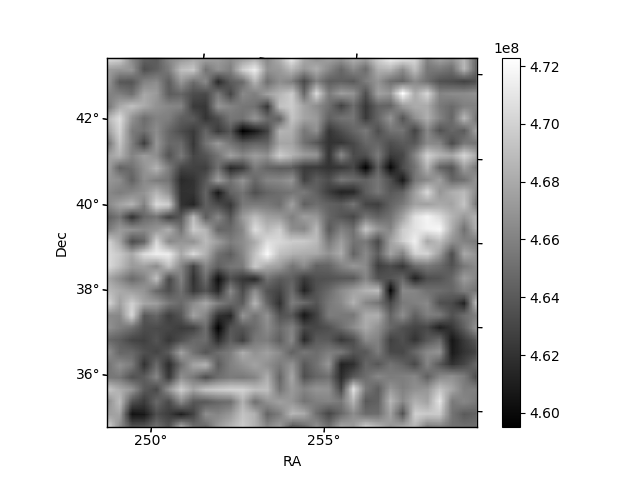
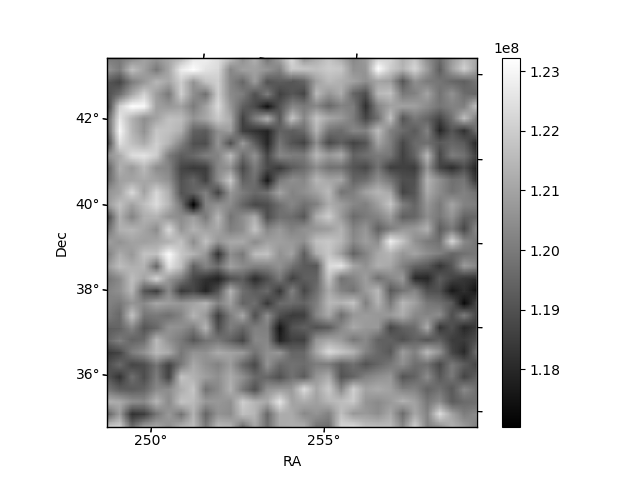
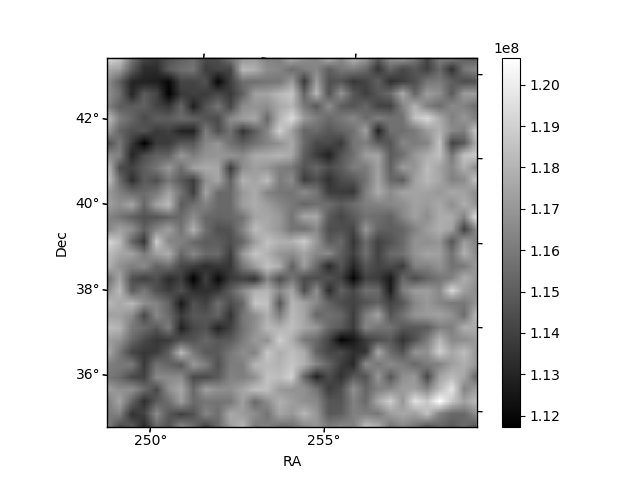
Histogram calculated using DETX and DETY for each event in the final _common_clean file
| Quadrant A | 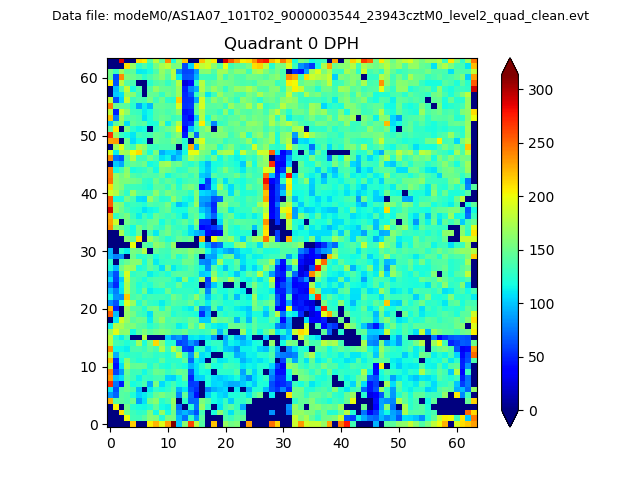 |
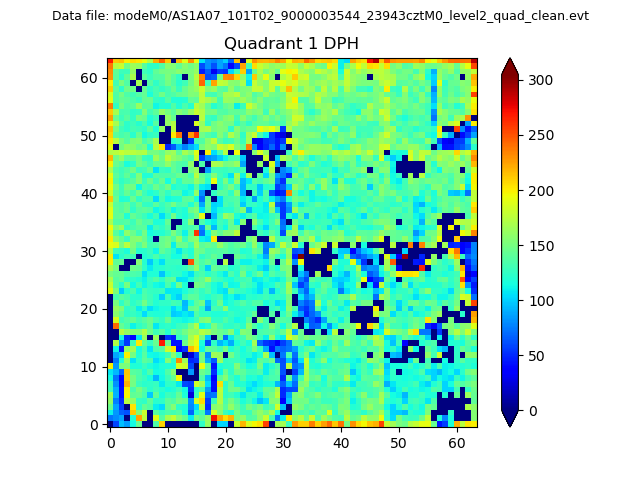 |
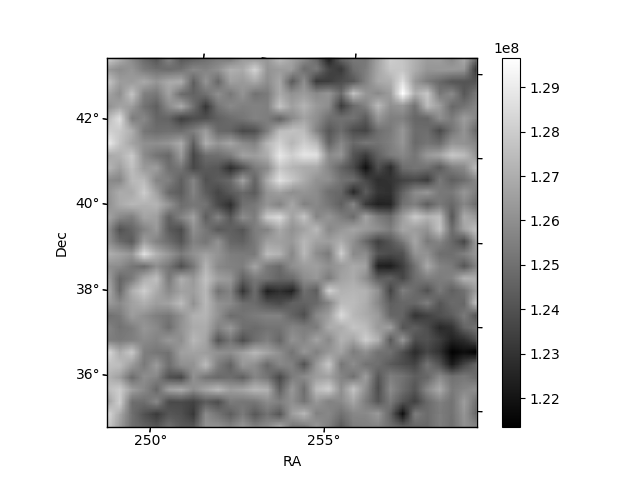
Quadrant B |
|---|---|---|---|
| Quadrant D | 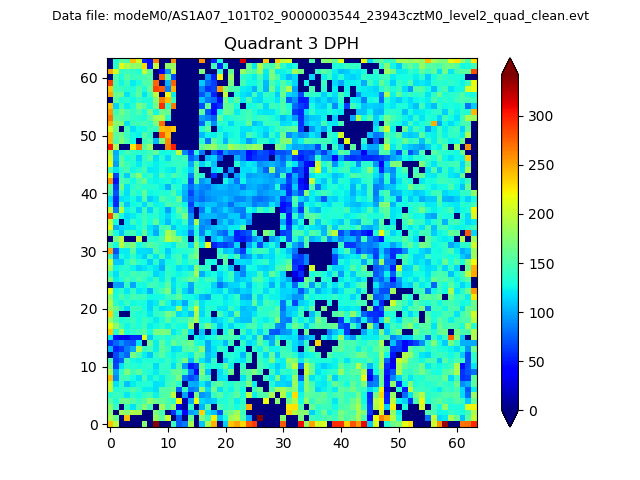 |
 |
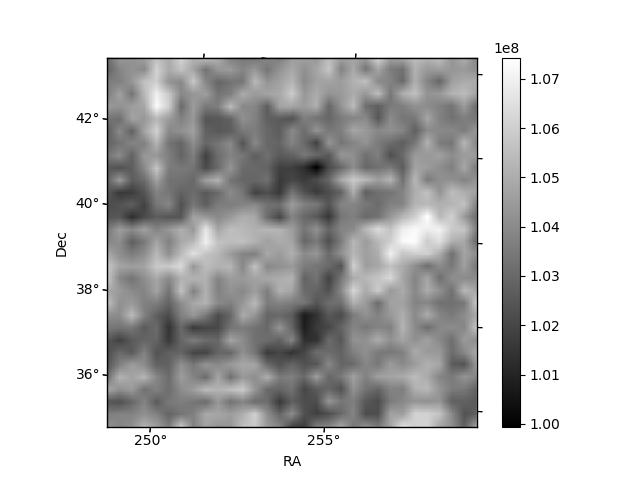
Quadrant C |
| Plot type | Count rate plots | Images |
|---|---|---|
| Comparison with Poisson distribution Blue bars denote a histogram of data divided into 1 sec bins. Red curve is a Poisson curve with rate = median count rate of data. |
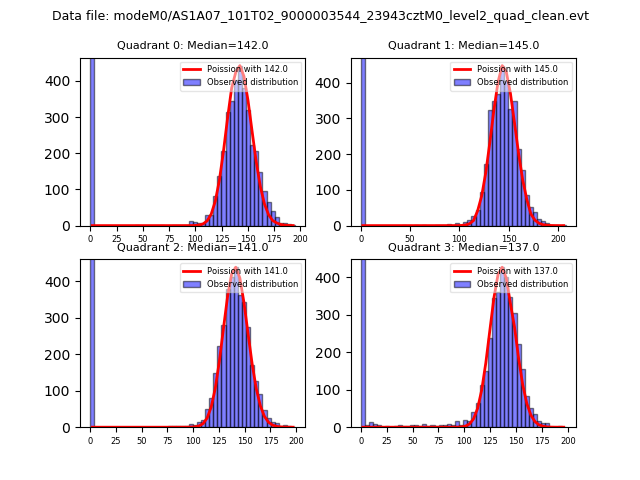 |
 |
| Quadrant-wise count rates Data is divided into 100 sec bins |
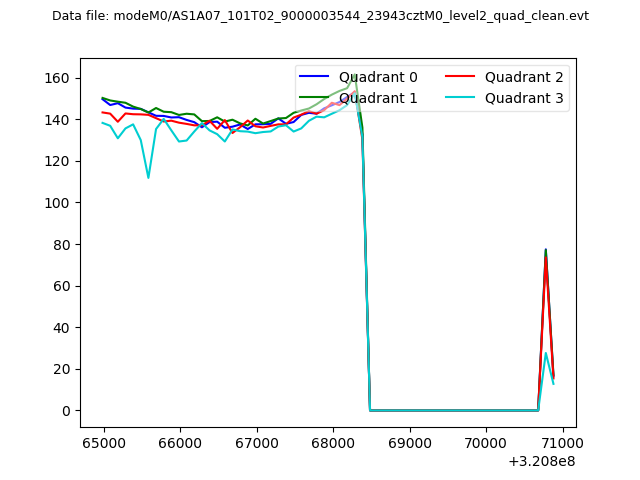 |
|
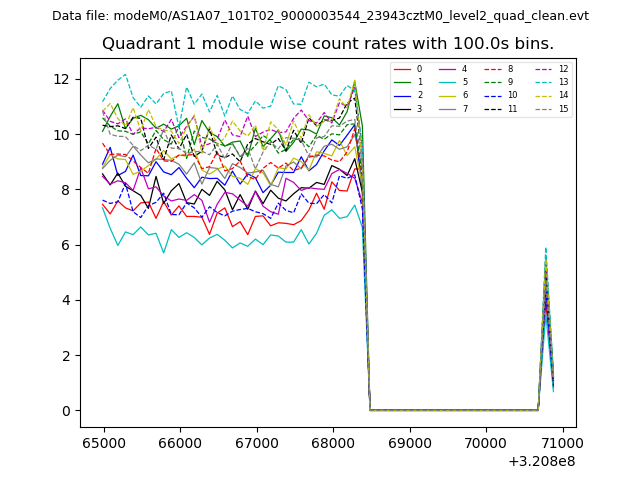
| Module-wise count rates for Quadrant A Data is divided into 100 sec bins |
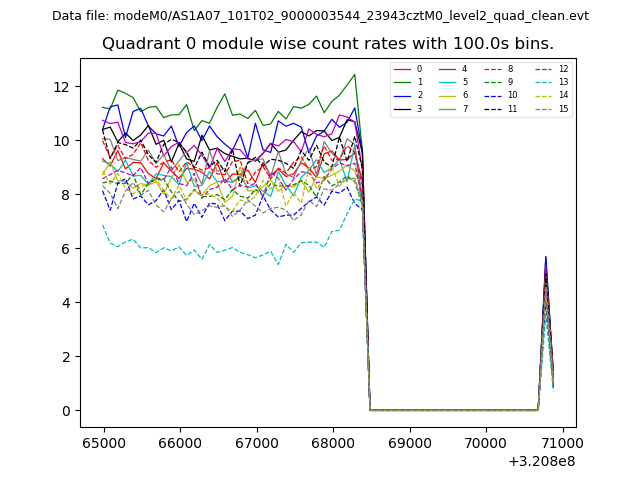 |
 |
| Module-wise count rates for Quadrant B Data is divided into 100 sec bins |
 |
 |
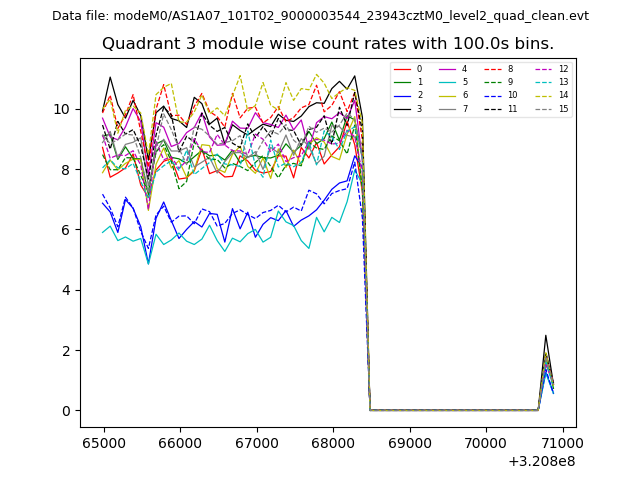
| Module-wise count rates for Quadrant C Data is divided into 100 sec bins |
 |
 |
| Module-wise count rates for Quadrant D Data is divided into 100 sec bins |
 |
 |
| Parameter | Plot |
|---|---|
| CZT HV Monitor |  |
| D_VDD | 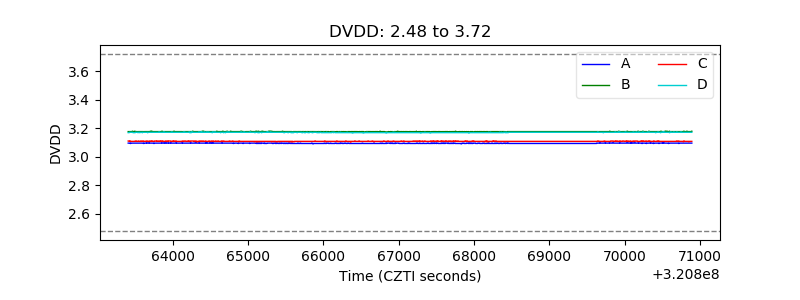 |
| Temperature 1 | 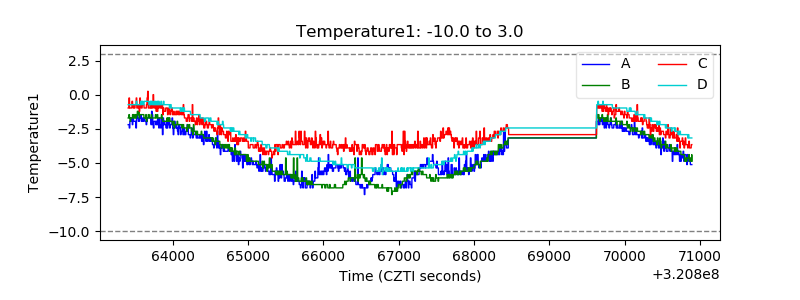 |
| Veto HV Monitor | 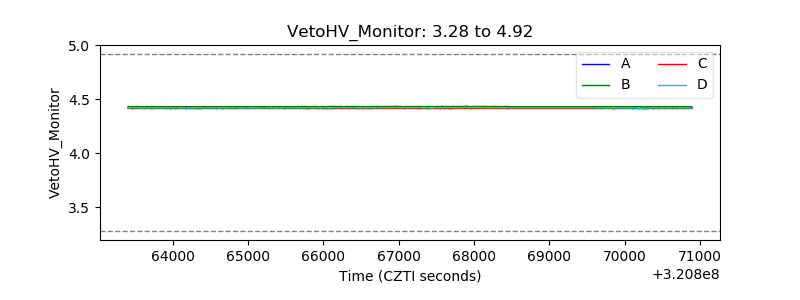 |
| Veto LLD | 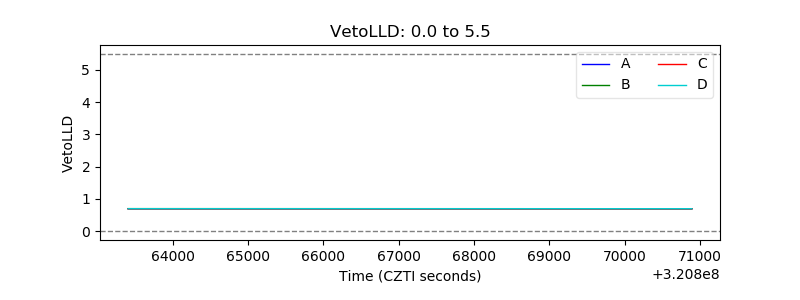 |
| Alpha Counter | 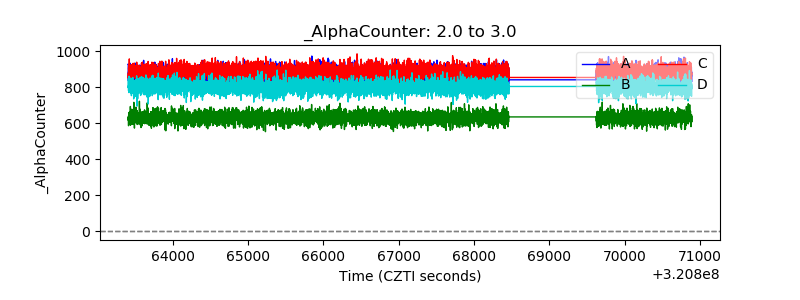 |
| _CPM_Rate | 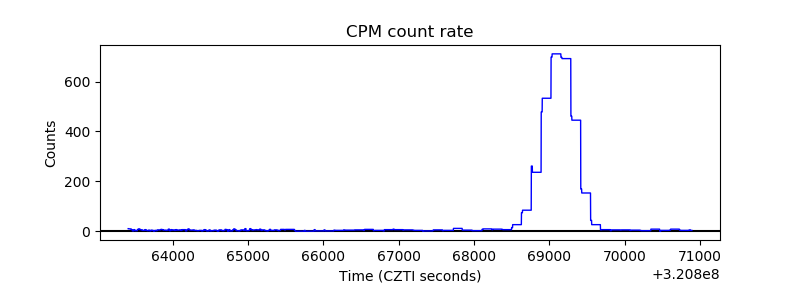 |
| CZT Counter | 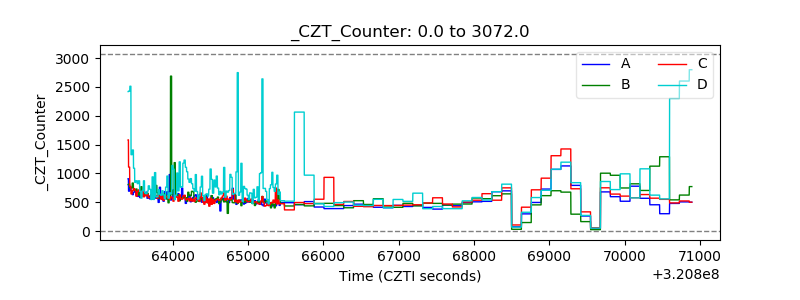 |
| +2.5 Volts monitor |  |
| +5 Volts monitor |  |
| _ROLL_ROT | 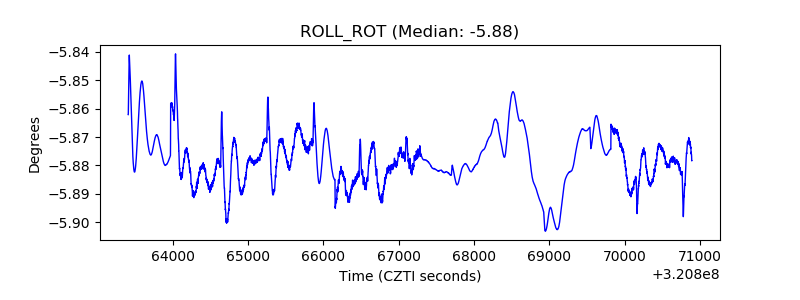 |
| _Roll_DEC | 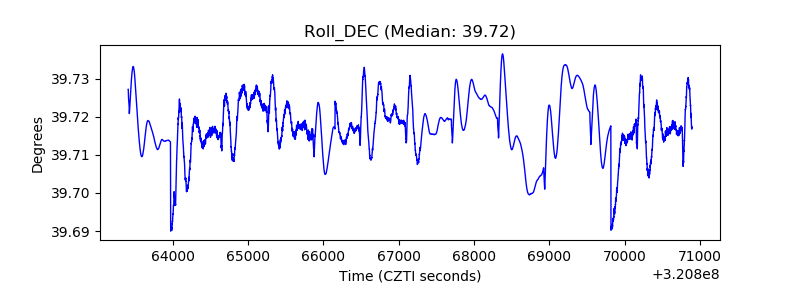 |
| _Roll_RA | 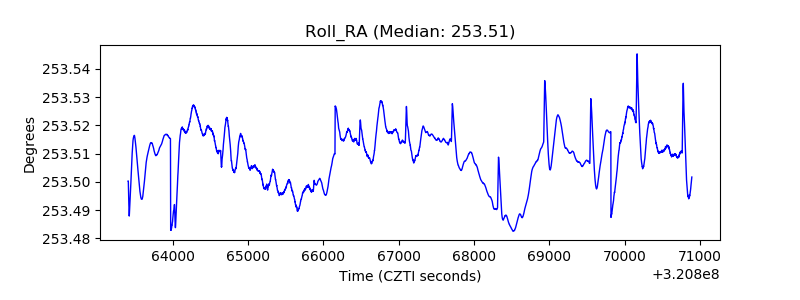 |
| Veto Counter | 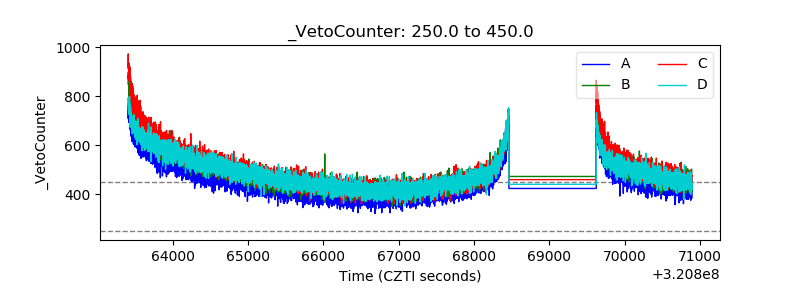 |