| Param | Original file | Final file |
|---|---|---|
| Filename | modeM0/AS1A07_101T02_9000003544_23949cztM0_level2.evt | modeM0/AS1A07_101T02_9000003544_23949cztM0_level2_quad_clean.evt |
| Size (bytes) | 1,060,917,120 | 177,955,200 |
| Size | 1011.8 MB | 169.7 MB |
| Events in quadrant A | 6,371,866 | 1,126,983 |
| Events in quadrant B | 6,519,529 | 1,153,620 |
| Events in quadrant C | 6,428,395 | 1,118,216 |
| Events in quadrant D | 11,890,965 | 1,051,159 |
| Mode SS | |||
|---|---|---|---|
| Quadrant | BADHDUFLAG | Total packets | Discarded packets |
| A | 0 | 280 | 0 |
| B | 0 | 280 | 0 |
| C | 0 | 280 | 0 |
| D | 0 | 280 | 0 |
| Mode M0 | |||
|---|---|---|---|
| Quadrant | BADHDUFLAG | Total packets | Discarded packets |
| A | 0 | 28030 | 4 |
| B | 0 | 28220 | 3 |
| C | 0 | 28145 | 3 |
| D | 0 | 44822 | 3 |
| Mode M9 | |||
|---|---|---|---|
| Quadrant | BADHDUFLAG | Total packets | Discarded packets |
| A | 0 | 16 | 0 |
| B | 0 | 16 | 0 |
| C | 0 | 16 | 0 |
| D | 0 | 16 | 0 |
| Quadrant | Total seconds | Saturated seconds | Saturation percentage |
|---|---|---|---|
| A | 13591 | 105 | 0.772570% |
| B | 13592 | 172 | 1.265450% |
| C | 13592 | 215 | 1.581813% |
| D | 13592 | 1393 | 10.248676% |
Noise dominated data is calculated using 1-second bins in cleaned event files. If a bin has >2000 counts, and if more than 50% of those come from <1% of pixels, then it is considered to be noise-dominated and hence unusable.
| Quadrant | # 1 sec bins | Bins with >0 counts | Bins with >2000 counts | High rate bins dominated by noise | Noise dominated (total time) | Noise dominated (detector-on time) | Marked lightcurve |
|---|---|---|---|---|---|---|---|
| A | 15211 | 13594 | 0 | 0 | 0.00% | 0.00% | 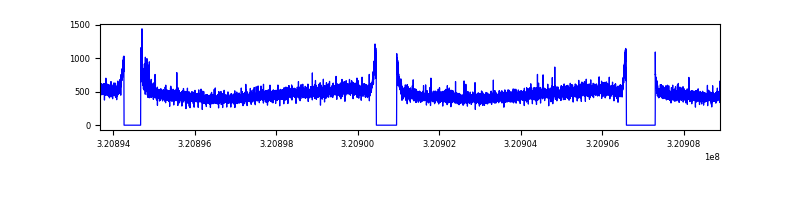 |
| B | 15212 | 13595 | 2 | 2 | 0.01% | 0.01% | 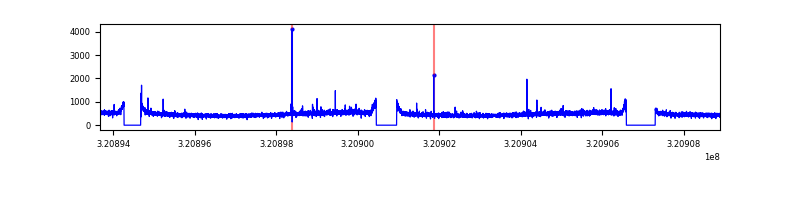 |
| C | 15212 | 13595 | 0 | 0 | 0.00% | 0.00% | 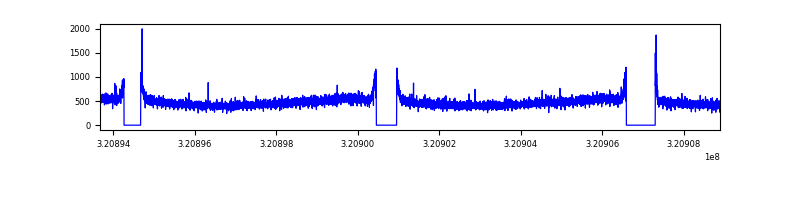 |
| D | 15212 | 13595 | 785 | 785 | 5.16% | 5.77% | 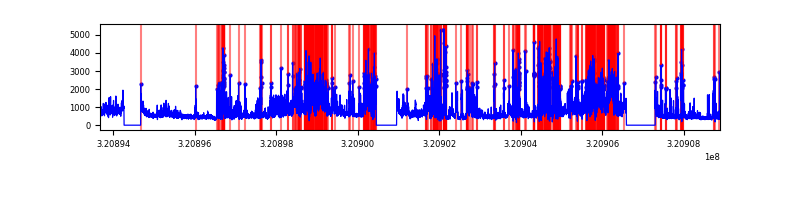 |
Top three noisy pixels from each quadrant. If the there are fewer than three noisy pixels in the level2.evt file, extra rows are filled as -1
| Pixel properties | Quadrant properties | ||||||
|---|---|---|---|---|---|---|---|
| Quadrant | DetID | PixID | Counts | Sigma | Mean | Median | Sigma |
| A | 14 | 111 | 36720 | 106.81 | 1642 | 1607 | 328.8 |
| A | 13 | 254 | 21675 | 61.04 | 1642 | 1607 | 328.8 |
| A | 3 | 137 | 15127 | 41.13 | 1642 | 1607 | 328.8 |
| B | 0 | 189 | 55855 | 173.38 | 1637 | 1595 | 313.0 |
| B | 12 | 111 | 39447 | 120.95 | 1637 | 1595 | 313.0 |
| B | 11 | 111 | 35114 | 107.11 | 1637 | 1595 | 313.0 |
| C | 14 | 238 | 248583 | 669.17 | 1577 | 1587 | 369.1 |
| C | 0 | 10 | 21955 | 55.18 | 1577 | 1587 | 369.1 |
| C | 3 | 233 | 11071 | 25.69 | 1577 | 1587 | 369.1 |
| D | 1 | 52 | 2574341 | 6933.87 | 1526 | 1484 | 371.1 |
| D | 12 | 218 | 2276321 | 6130.71 | 1526 | 1484 | 371.1 |
| D | 8 | 195 | 781116 | 2101.12 | 1526 | 1484 | 371.1 |
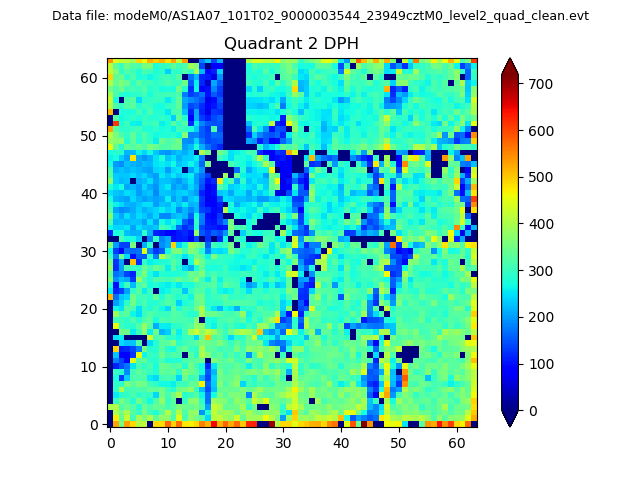
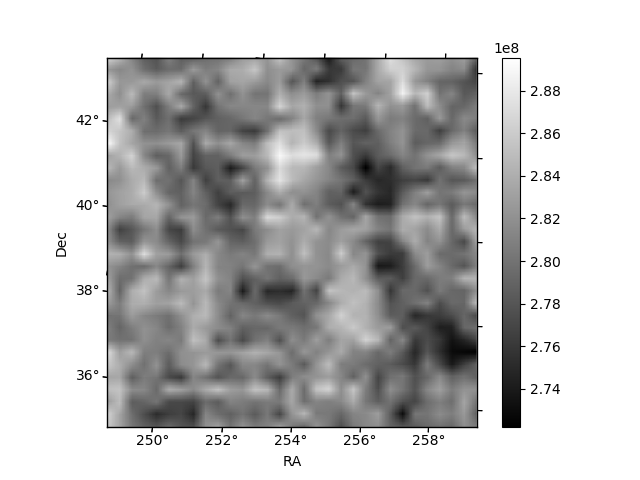
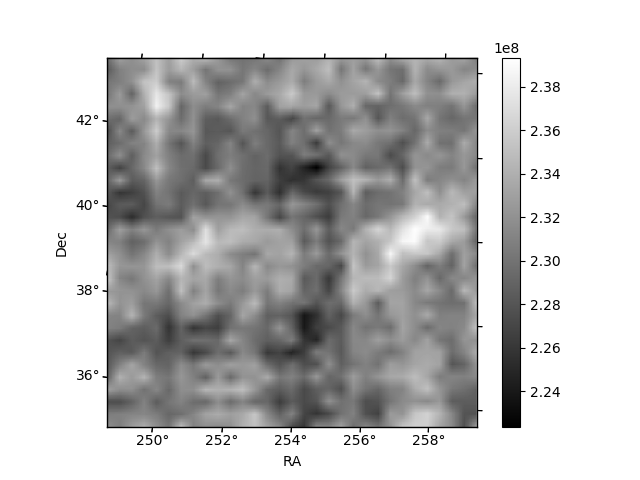
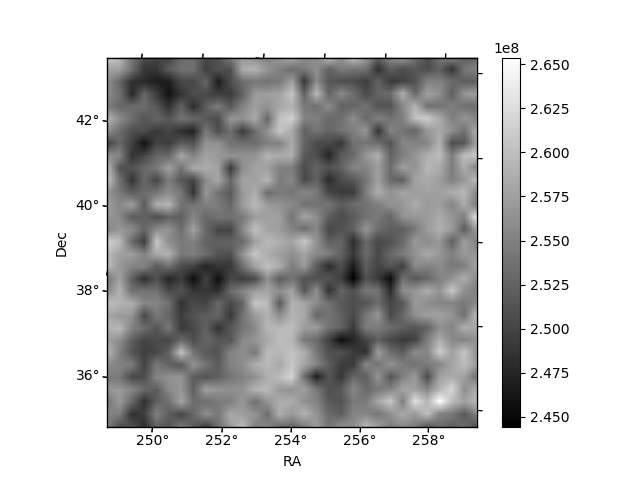
Histogram calculated using DETX and DETY for each event in the final _common_clean file
| Quadrant A | 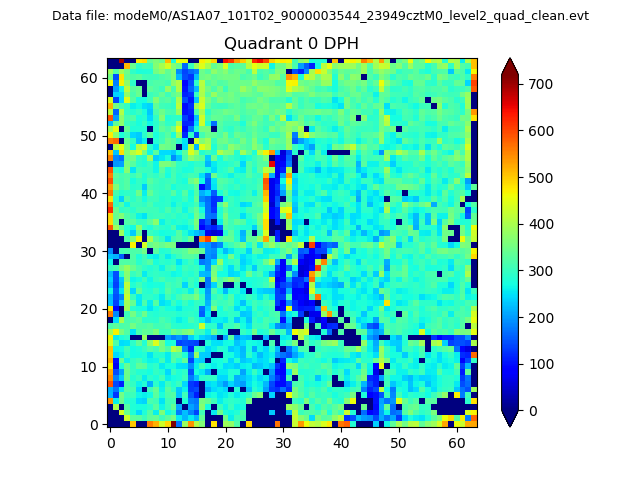 |
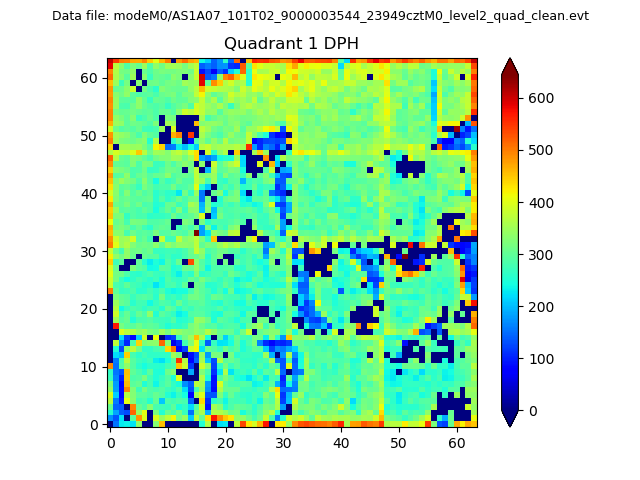 |
Quadrant B |
|---|---|---|---|
| Quadrant D | 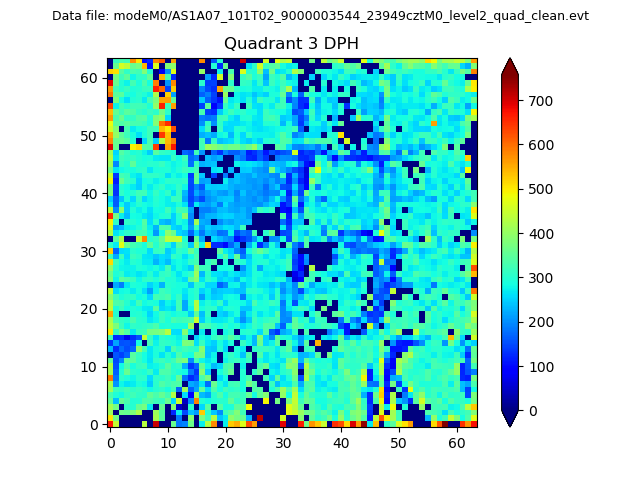 |
 |
Quadrant C |
| Plot type | Count rate plots | Images |
|---|---|---|
| Comparison with Poisson distribution Blue bars denote a histogram of data divided into 1 sec bins. Red curve is a Poisson curve with rate = median count rate of data. |
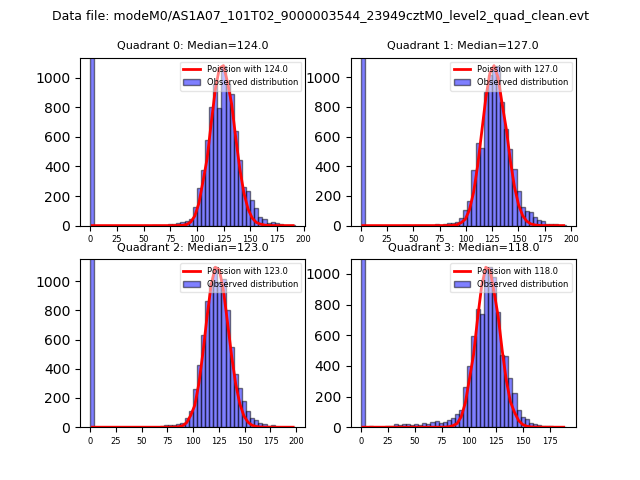 |
 |
| Quadrant-wise count rates Data is divided into 100 sec bins |
 |
|
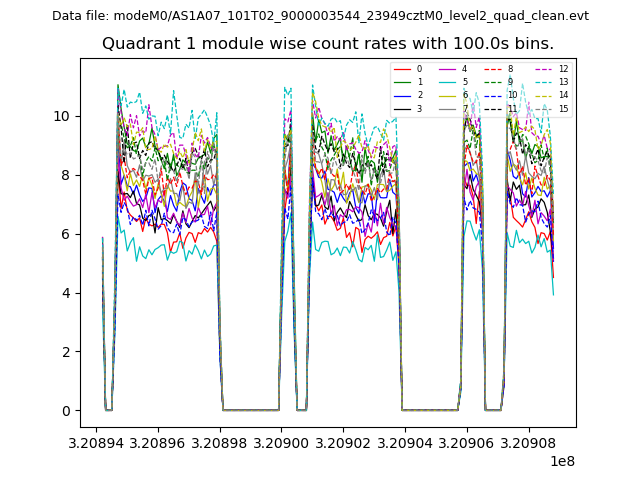
| Module-wise count rates for Quadrant A Data is divided into 100 sec bins |
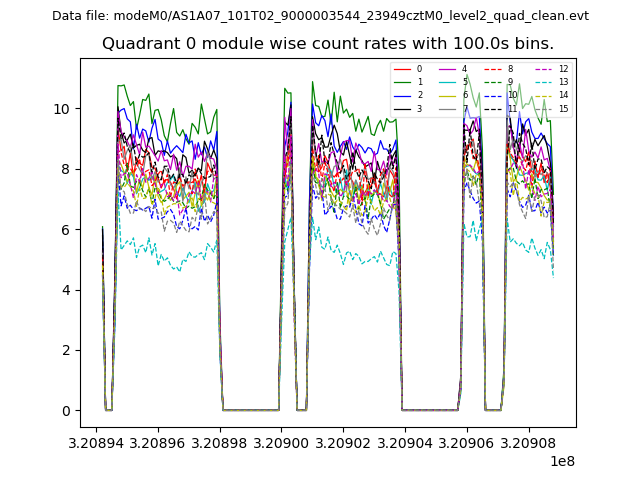 |
 |
| Module-wise count rates for Quadrant B Data is divided into 100 sec bins |
 |
 |
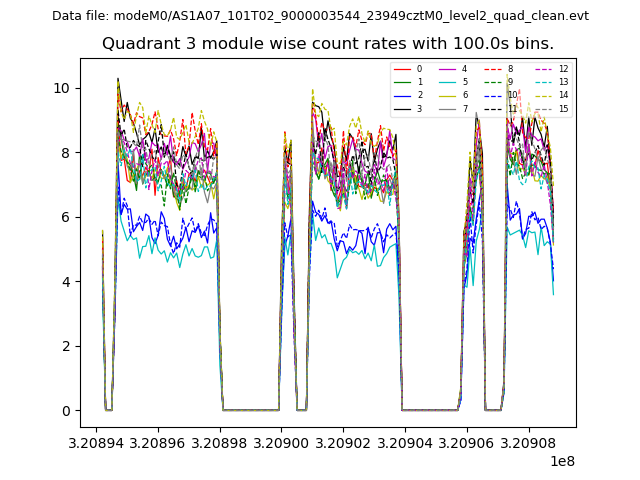
| Module-wise count rates for Quadrant C Data is divided into 100 sec bins |
 |
 |
| Module-wise count rates for Quadrant D Data is divided into 100 sec bins |
 |
 |
| Parameter | Plot |
|---|---|
| CZT HV Monitor | 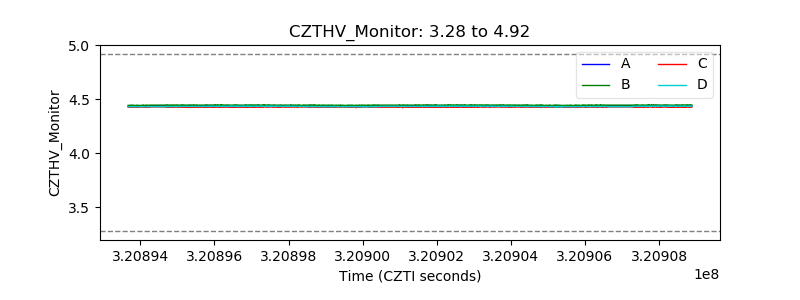 |
| D_VDD | 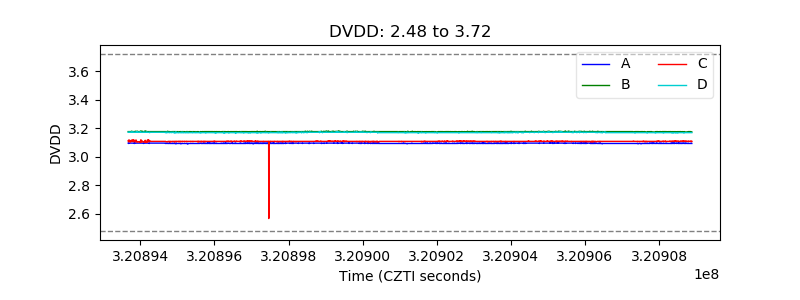 |
| Temperature 1 | 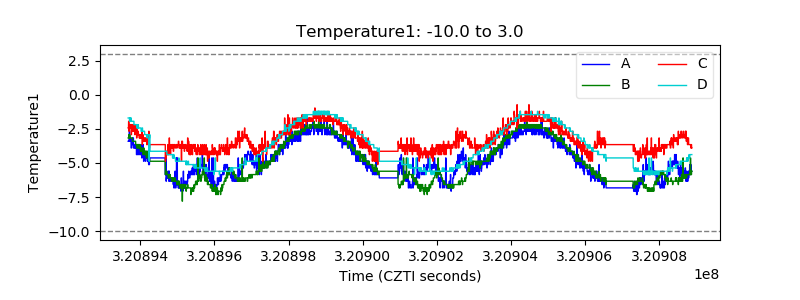 |
| Veto HV Monitor | 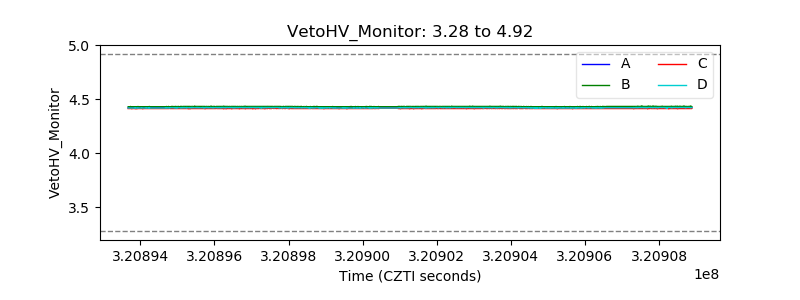 |
| Veto LLD | 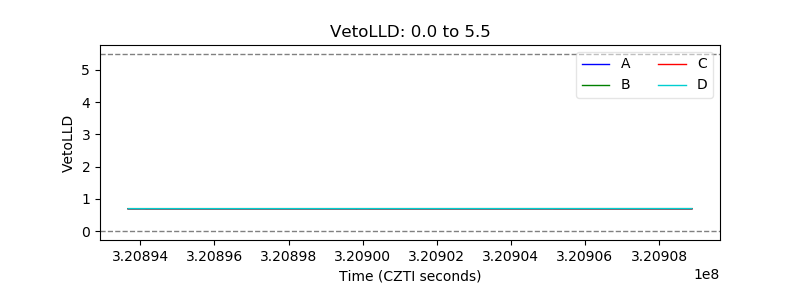 |
| Alpha Counter | 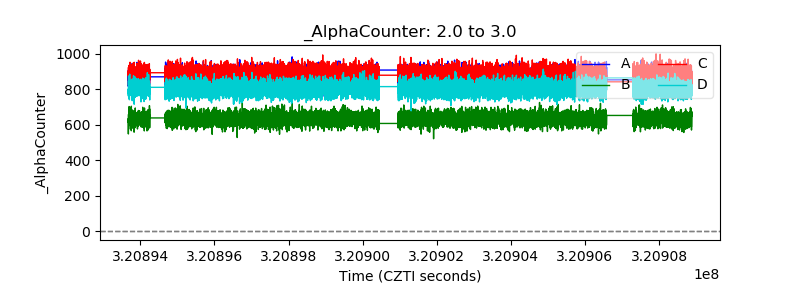 |
| _CPM_Rate | 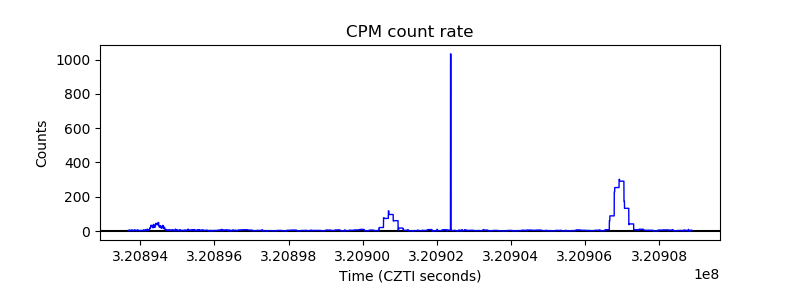 |
| CZT Counter | 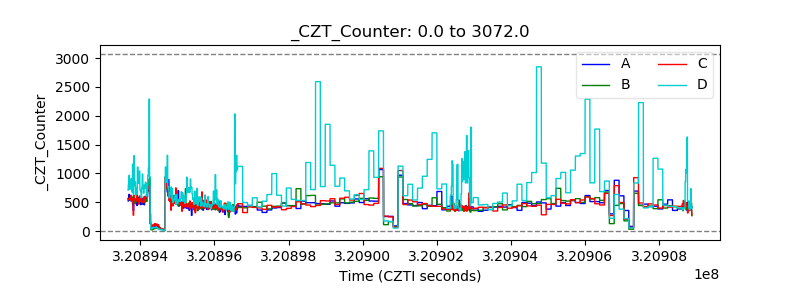 |
| +2.5 Volts monitor | 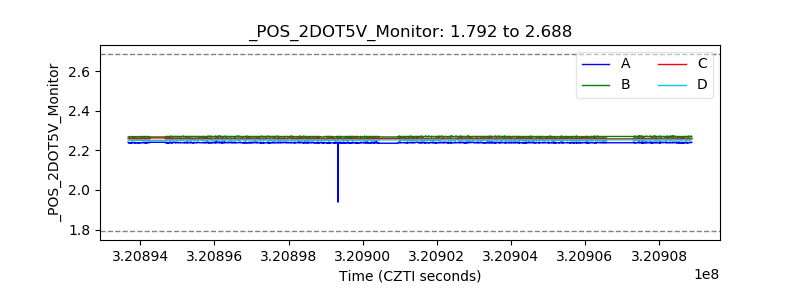 |
| +5 Volts monitor |  |
| _ROLL_ROT | 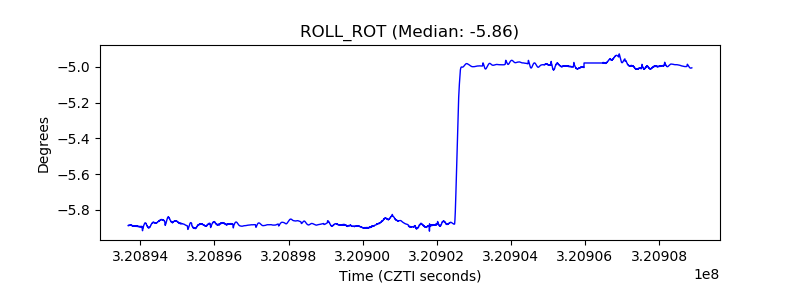 |
| _Roll_DEC | 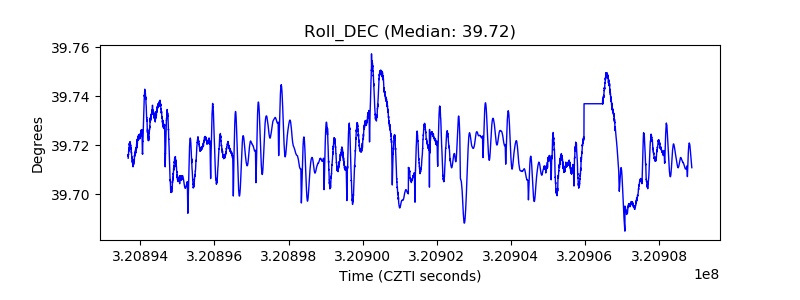 |
| _Roll_RA | 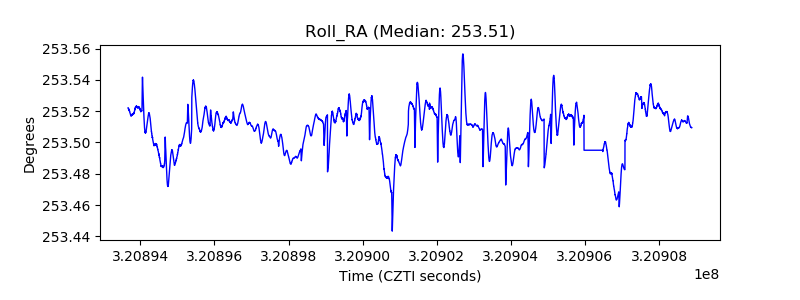 |
| Veto Counter | 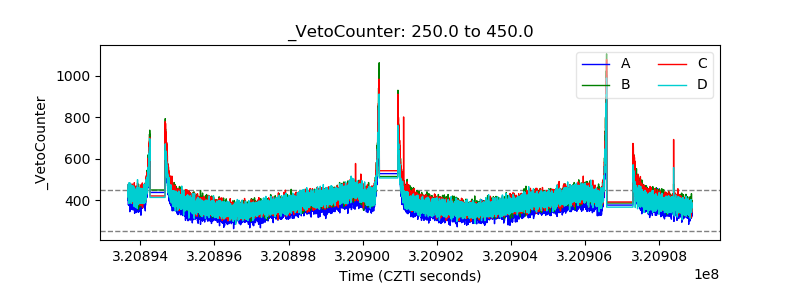 |