| Param | Original file | Final file |
|---|---|---|
| Filename | modeM0/AS1A07_101T02_9000003544_23951cztM0_level2.evt | modeM0/AS1A07_101T02_9000003544_23951cztM0_level2_quad_clean.evt |
| Size (bytes) | 508,907,520 | 95,423,040 |
| Size | 485.3 MB | 91.0 MB |
| Events in quadrant A | 3,128,458 | 625,404 |
| Events in quadrant B | 3,759,403 | 623,806 |
| Events in quadrant C | 3,125,424 | 609,712 |
| Events in quadrant D | 4,954,490 | 573,937 |
| Mode SS | |||
|---|---|---|---|
| Quadrant | BADHDUFLAG | Total packets | Discarded packets |
| A | 0 | 134 | 0 |
| B | 0 | 134 | 0 |
| C | 0 | 134 | 0 |
| D | 0 | 134 | 0 |
| Mode M0 | |||
|---|---|---|---|
| Quadrant | BADHDUFLAG | Total packets | Discarded packets |
| A | 0 | 13362 | 1 |
| B | 0 | 15179 | 1 |
| C | 0 | 13323 | 1 |
| D | 0 | 19041 | 1 |
| Mode M9 | |||
|---|---|---|---|
| Quadrant | BADHDUFLAG | Total packets | Discarded packets |
| A | 0 | 10 | 0 |
| B | 0 | 10 | 0 |
| C | 0 | 10 | 0 |
| D | 0 | 10 | 0 |
| Quadrant | Total seconds | Saturated seconds | Saturation percentage |
|---|---|---|---|
| A | 6544 | 47 | 0.718215% |
| B | 6545 | 190 | 2.902979% |
| C | 6545 | 55 | 0.840336% |
| D | 6545 | 479 | 7.318564% |
Noise dominated data is calculated using 1-second bins in cleaned event files. If a bin has >2000 counts, and if more than 50% of those come from <1% of pixels, then it is considered to be noise-dominated and hence unusable.
| Quadrant | # 1 sec bins | Bins with >0 counts | Bins with >2000 counts | High rate bins dominated by noise | Noise dominated (total time) | Noise dominated (detector-on time) | Marked lightcurve |
|---|---|---|---|---|---|---|---|
| A | 7549 | 6545 | 0 | 0 | 0.00% | 0.00% | 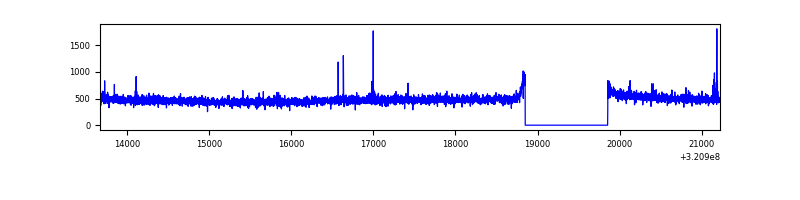 |
| B | 7550 | 6546 | 98 | 98 | 1.30% | 1.50% | 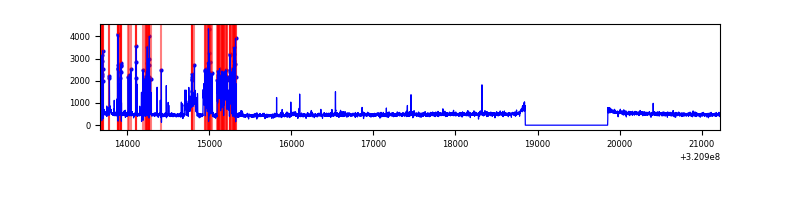 |
| C | 7550 | 6546 | 0 | 0 | 0.00% | 0.00% | 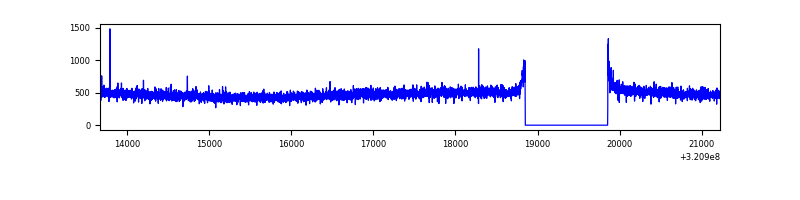 |
| D | 7550 | 6546 | 395 | 395 | 5.23% | 6.03% | 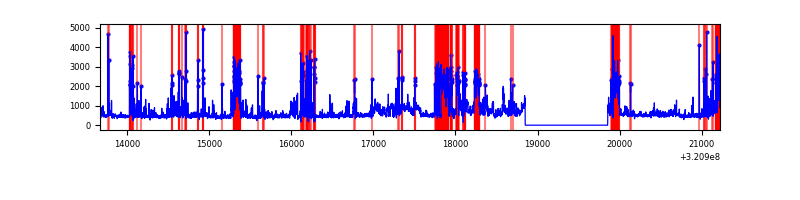 |
Top three noisy pixels from each quadrant. If the there are fewer than three noisy pixels in the level2.evt file, extra rows are filled as -1
| Pixel properties | Quadrant properties | ||||||
|---|---|---|---|---|---|---|---|
| Quadrant | DetID | PixID | Counts | Sigma | Mean | Median | Sigma |
| A | 13 | 254 | 9224 | 51.77 | 808 | 793 | 162.9 |
| A | 14 | 111 | 8850 | 49.47 | 808 | 793 | 162.9 |
| A | 2 | 79 | 8243 | 45.75 | 808 | 793 | 162.9 |
| B | 3 | 64 | 618711 | 4114.82 | 790 | 770 | 150.2 |
| B | 0 | 189 | 29718 | 192.76 | 790 | 770 | 150.2 |
| B | 12 | 111 | 18435 | 117.63 | 790 | 770 | 150.2 |
| C | 14 | 238 | 123127 | 690.49 | 767 | 773 | 177.2 |
| C | 0 | 10 | 7546 | 38.22 | 767 | 773 | 177.2 |
| C | 13 | 61 | 5270 | 25.38 | 767 | 773 | 177.2 |
| D | 12 | 218 | 1867428 | 10095.47 | 763 | 739 | 184.9 |
| D | 8 | 195 | 129621 | 697.02 | 763 | 739 | 184.9 |
| D | 12 | 250 | 37099 | 196.64 | 763 | 739 | 184.9 |
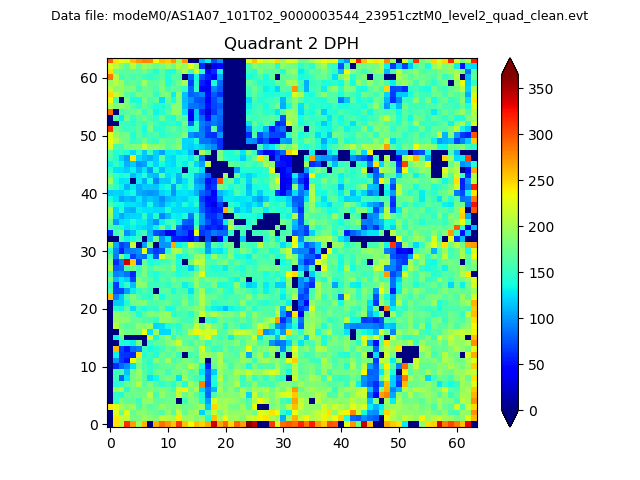
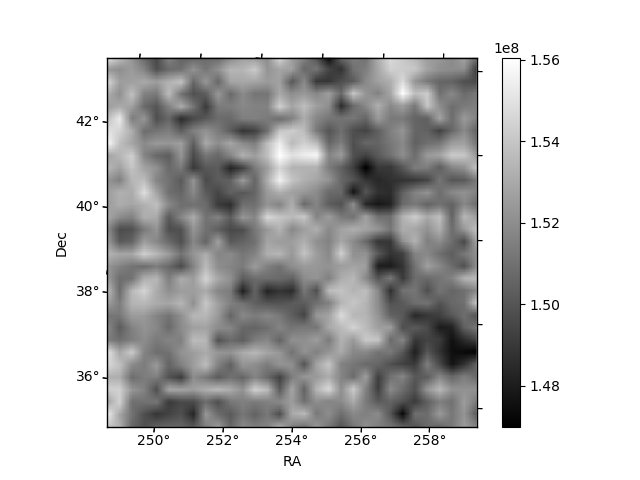
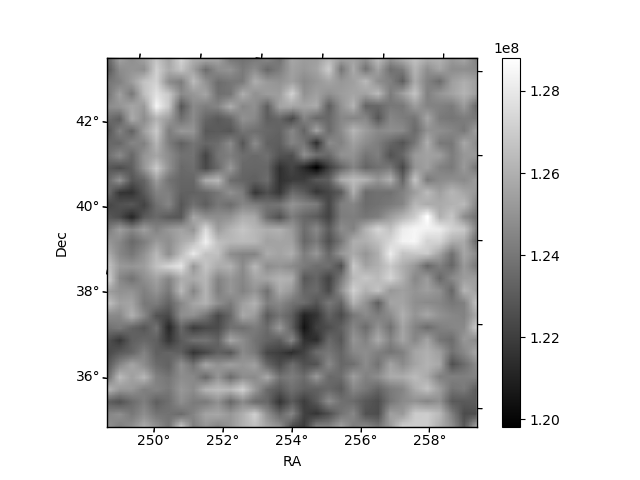
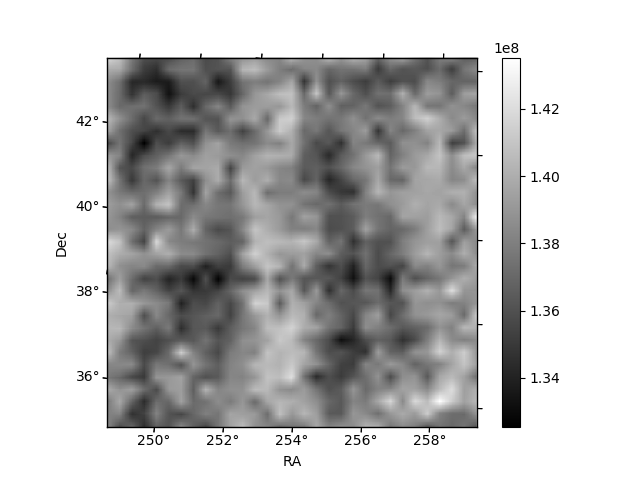
Histogram calculated using DETX and DETY for each event in the final _common_clean file
| Quadrant A | 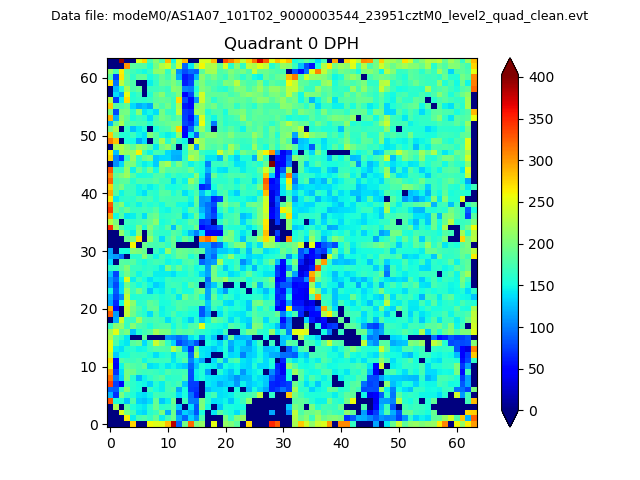 |
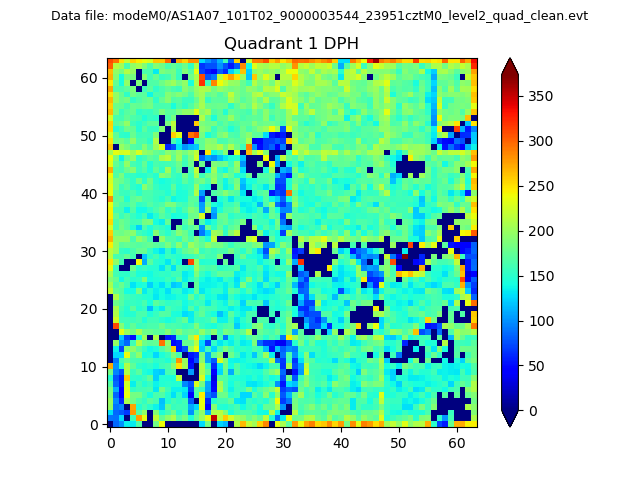 |
Quadrant B |
|---|---|---|---|
| Quadrant D | 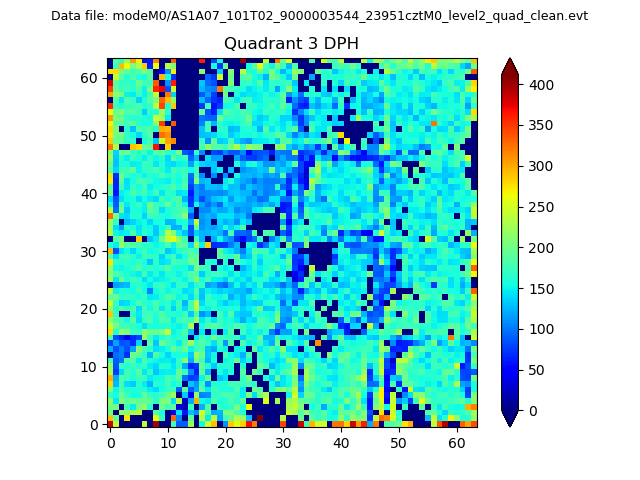 |
 |
Quadrant C |
| Plot type | Count rate plots | Images |
|---|---|---|
| Comparison with Poisson distribution Blue bars denote a histogram of data divided into 1 sec bins. Red curve is a Poisson curve with rate = median count rate of data. |
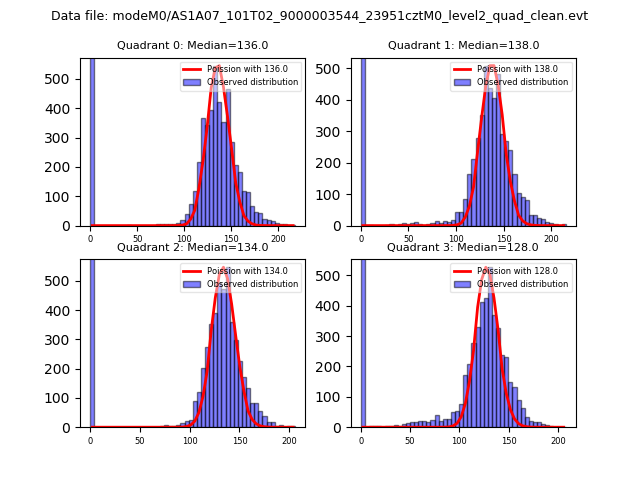 |
 |
| Quadrant-wise count rates Data is divided into 100 sec bins |
 |
|
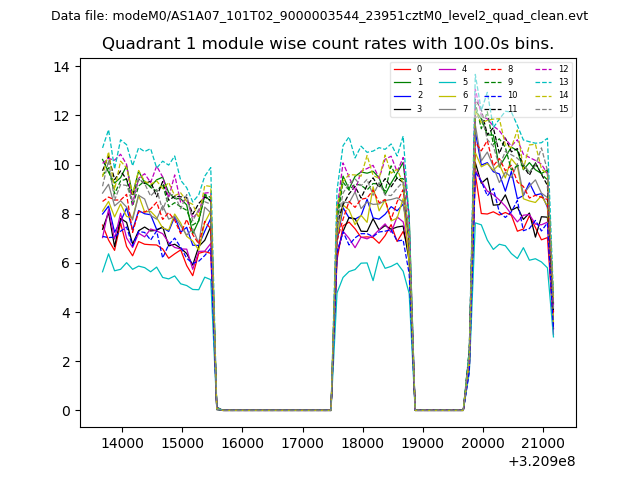
| Module-wise count rates for Quadrant A Data is divided into 100 sec bins |
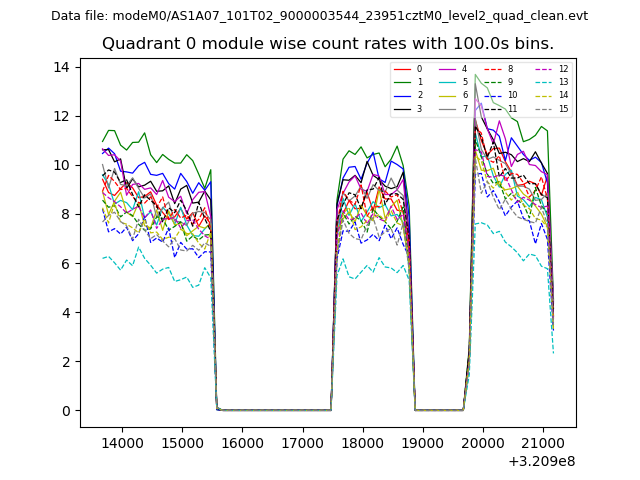 |
 |
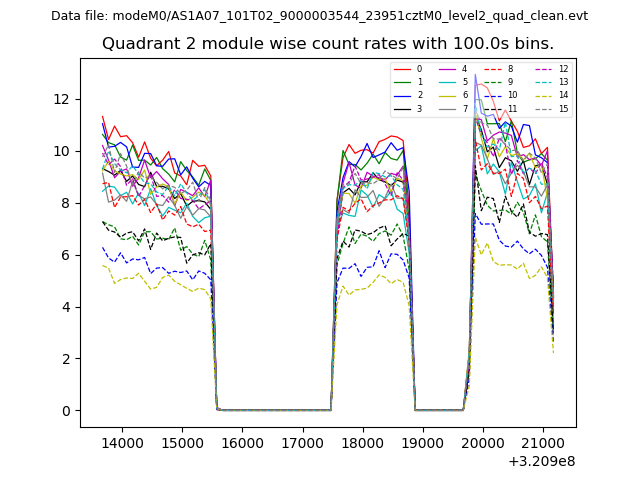
| Module-wise count rates for Quadrant B Data is divided into 100 sec bins |
 |
 |
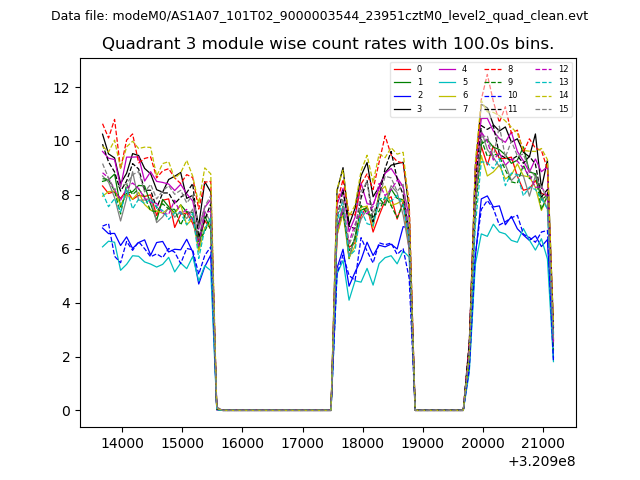
| Module-wise count rates for Quadrant C Data is divided into 100 sec bins |
 |
 |
| Module-wise count rates for Quadrant D Data is divided into 100 sec bins |
 |
 |
| Parameter | Plot |
|---|---|
| CZT HV Monitor | 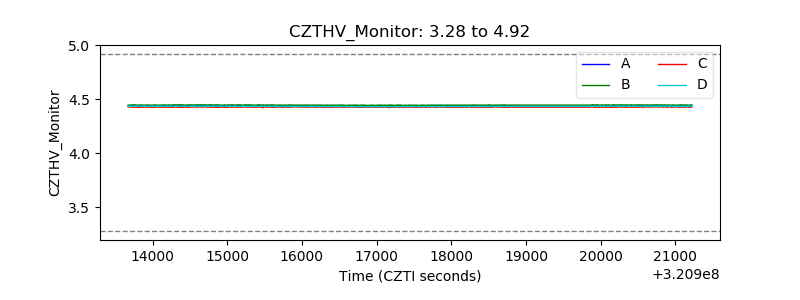 |
| D_VDD | 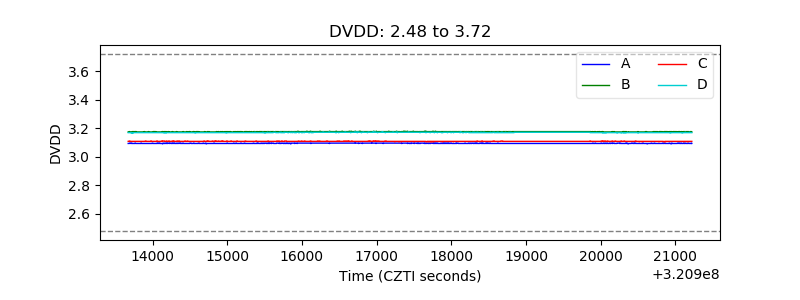 |
| Temperature 1 | 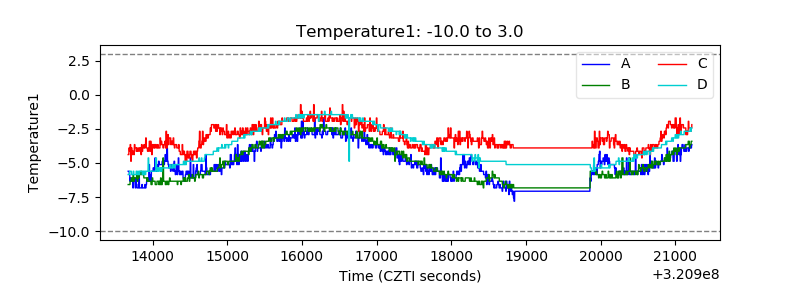 |
| Veto HV Monitor | 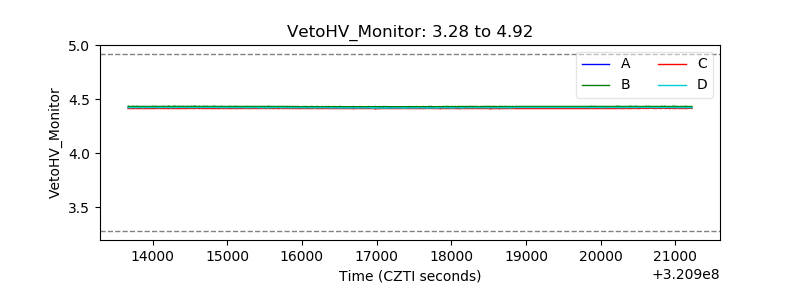 |
| Veto LLD | 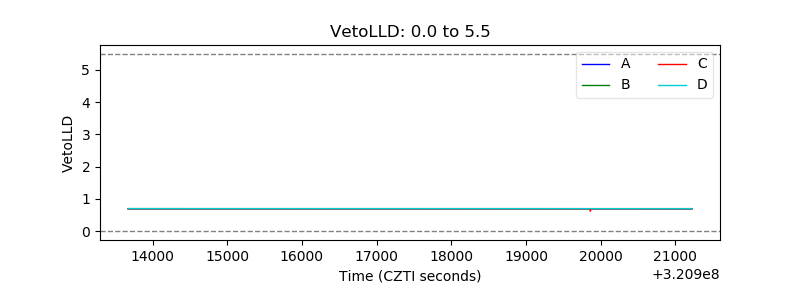 |
| Alpha Counter |  |
| _CPM_Rate | 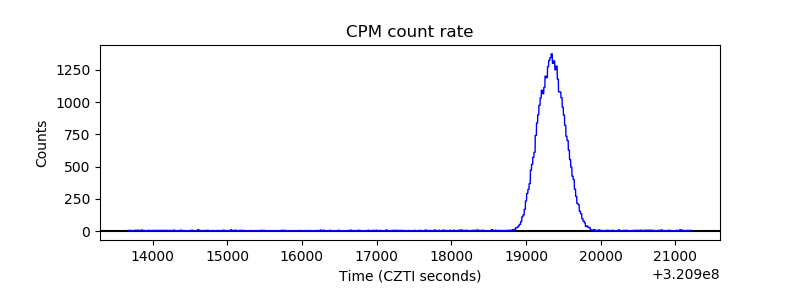 |
| CZT Counter | 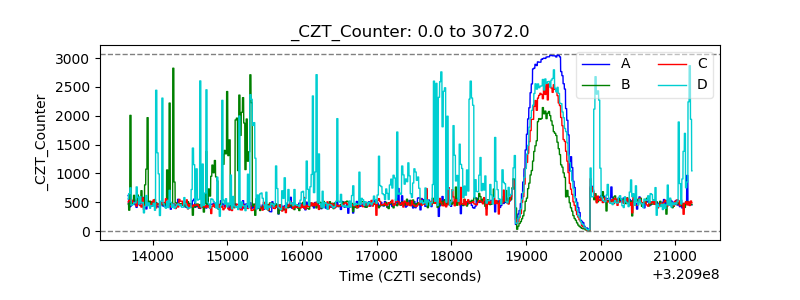 |
| +2.5 Volts monitor |  |
| +5 Volts monitor |  |
| _ROLL_ROT | 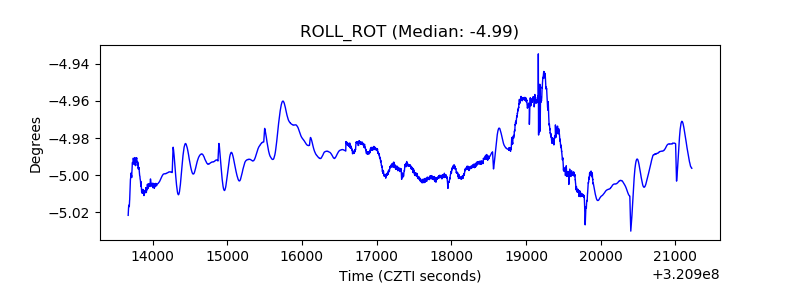 |
| _Roll_DEC | 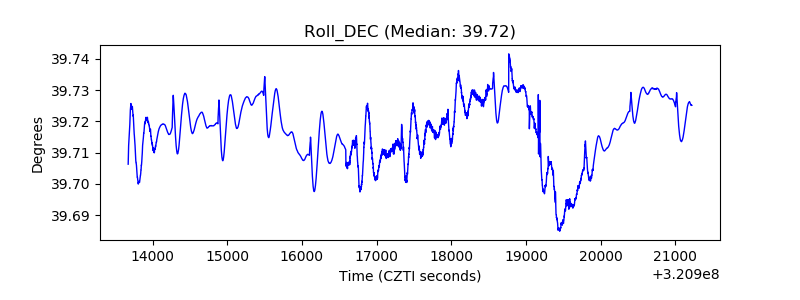 |
| _Roll_RA |  |
| Veto Counter | 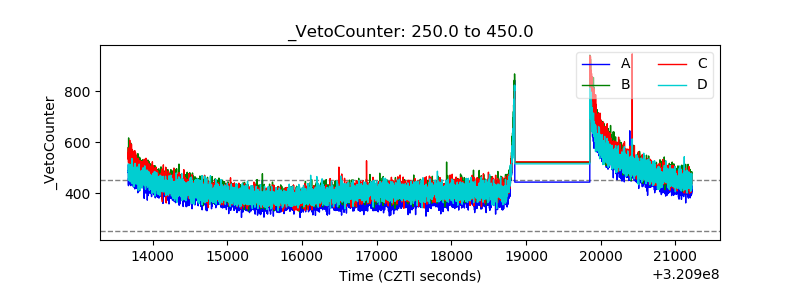 |