| Param | Original file | Final file |
|---|---|---|
| Filename | modeM0/AS1A07_101T02_9000003544_23953cztM0_level2.evt | modeM0/AS1A07_101T02_9000003544_23953cztM0_level2_quad_clean.evt |
| Size (bytes) | 595,840,320 | 95,420,160 |
| Size | 568.2 MB | 91.0 MB |
| Events in quadrant A | 3,239,933 | 624,619 |
| Events in quadrant B | 3,231,493 | 633,239 |
| Events in quadrant C | 3,209,404 | 608,786 |
| Events in quadrant D | 7,928,848 | 574,854 |
| Mode SS | |||
|---|---|---|---|
| Quadrant | BADHDUFLAG | Total packets | Discarded packets |
| A | 0 | 132 | 0 |
| B | 0 | 132 | 0 |
| C | 0 | 132 | 0 |
| D | 0 | 132 | 0 |
| Mode M0 | |||
|---|---|---|---|
| Quadrant | BADHDUFLAG | Total packets | Discarded packets |
| A | 0 | 13489 | 2 |
| B | 0 | 13411 | 1 |
| C | 0 | 13362 | 1 |
| D | 0 | 27964 | 1 |
| Mode M9 | |||
|---|---|---|---|
| Quadrant | BADHDUFLAG | Total packets | Discarded packets |
| A | 0 | 11 | 0 |
| B | 0 | 11 | 0 |
| C | 0 | 11 | 0 |
| D | 0 | 11 | 0 |
| Quadrant | Total seconds | Saturated seconds | Saturation percentage |
|---|---|---|---|
| A | 6418 | 66 | 1.028358% |
| B | 6419 | 64 | 0.997040% |
| C | 6419 | 67 | 1.043776% |
| D | 6419 | 1724 | 26.857766% |
Noise dominated data is calculated using 1-second bins in cleaned event files. If a bin has >2000 counts, and if more than 50% of those come from <1% of pixels, then it is considered to be noise-dominated and hence unusable.
| Quadrant | # 1 sec bins | Bins with >0 counts | Bins with >2000 counts | High rate bins dominated by noise | Noise dominated (total time) | Noise dominated (detector-on time) | Marked lightcurve |
|---|---|---|---|---|---|---|---|
| A | 7548 | 6419 | 1 | 1 | 0.01% | 0.02% | 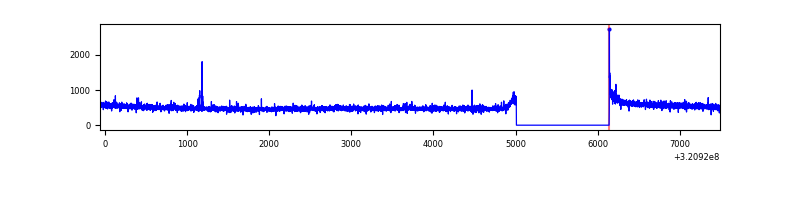 |
| B | 7549 | 6420 | 1 | 1 | 0.01% | 0.02% | 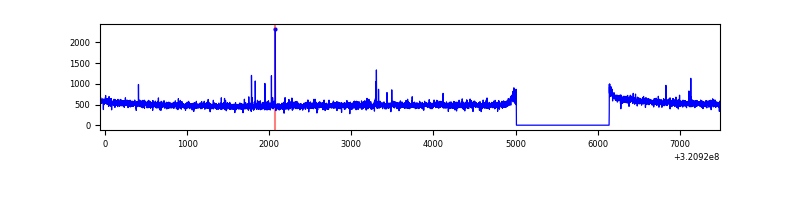 |
| C | 7549 | 6420 | 0 | 0 | 0.00% | 0.00% | 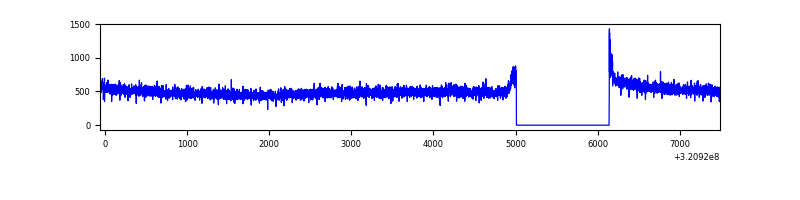 |
| D | 7549 | 6420 | 1469 | 1469 | 19.46% | 22.88% | 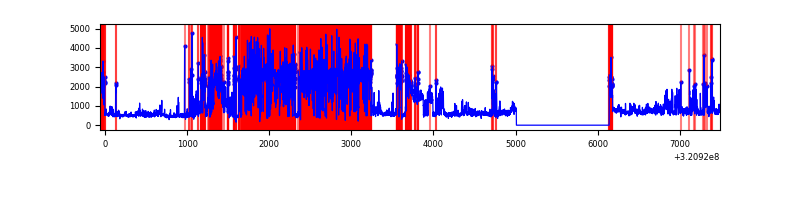 |
Top three noisy pixels from each quadrant. If the there are fewer than three noisy pixels in the level2.evt file, extra rows are filled as -1
| Pixel properties | Quadrant properties | ||||||
|---|---|---|---|---|---|---|---|
| Quadrant | DetID | PixID | Counts | Sigma | Mean | Median | Sigma |
| A | 14 | 111 | 25970 | 151.58 | 834 | 819 | 165.9 |
| A | 13 | 254 | 9557 | 52.66 | 834 | 819 | 165.9 |
| A | 0 | 226 | 7371 | 39.49 | 834 | 819 | 165.9 |
| B | 12 | 111 | 18468 | 114.16 | 819 | 801 | 154.8 |
| B | 11 | 111 | 16294 | 100.11 | 819 | 801 | 154.8 |
| B | 14 | 111 | 15012 | 91.83 | 819 | 801 | 154.8 |
| C | 14 | 238 | 126888 | 690.4 | 789 | 794 | 182.6 |
| C | 0 | 10 | 7920 | 39.02 | 789 | 794 | 182.6 |
| C | 13 | 61 | 5483 | 25.67 | 789 | 794 | 182.6 |
| D | 12 | 218 | 4860405 | 29496.42 | 685 | 666 | 164.8 |
| D | 8 | 195 | 402184 | 2437.03 | 685 | 666 | 164.8 |
| D | 12 | 250 | 42215 | 252.18 | 685 | 666 | 164.8 |
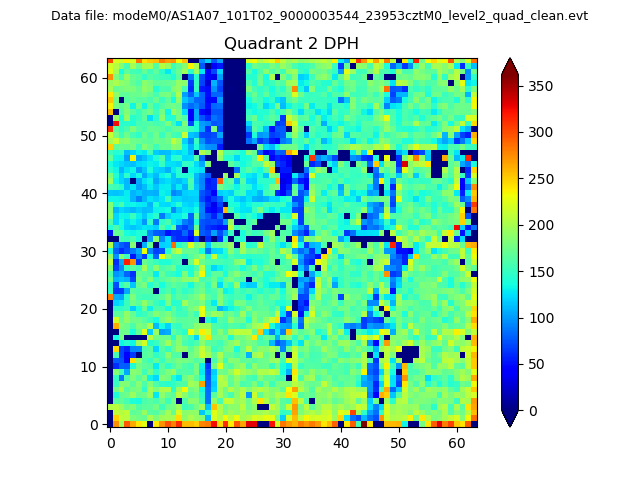
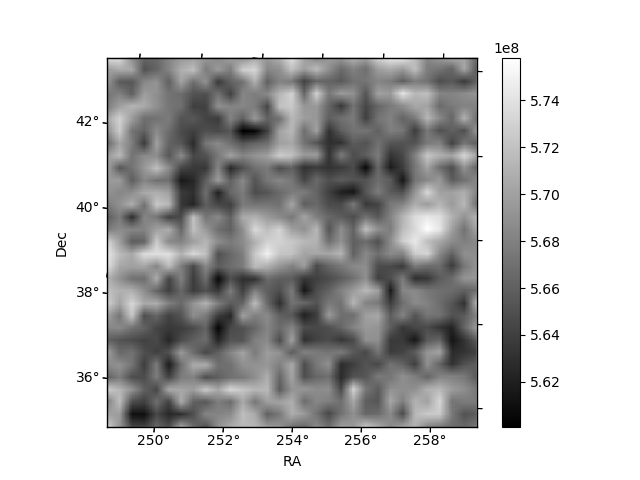
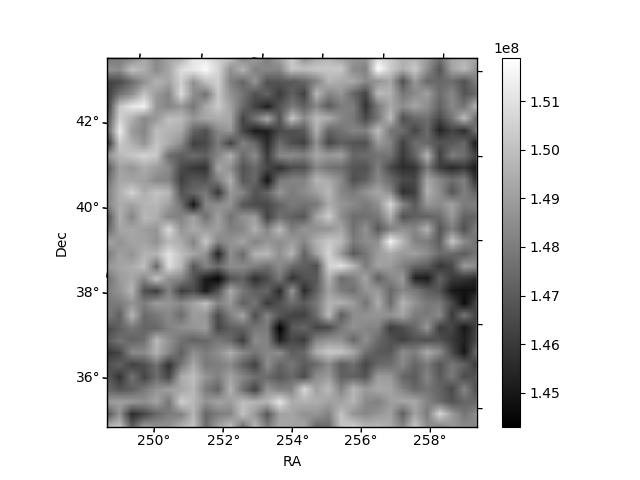
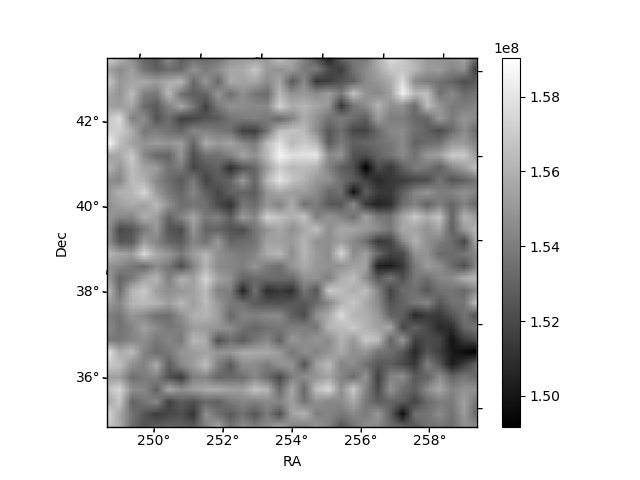
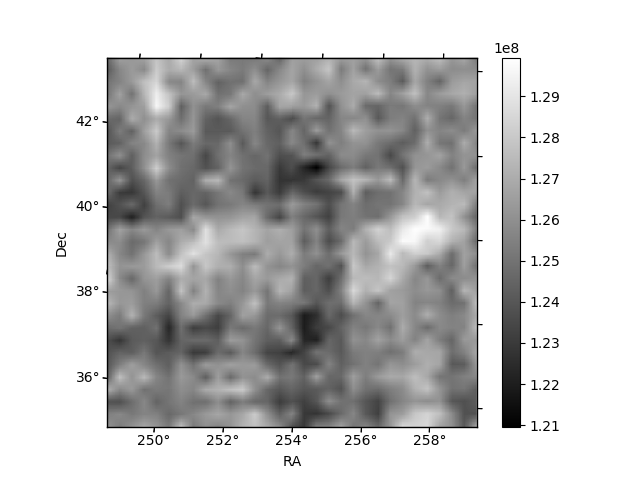
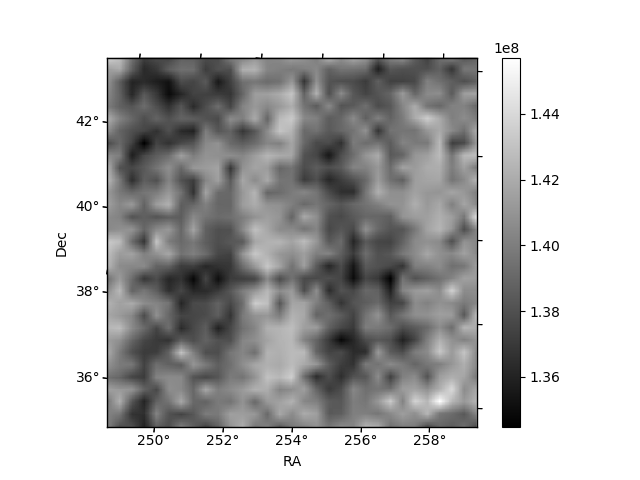
Histogram calculated using DETX and DETY for each event in the final _common_clean file
| Quadrant A | 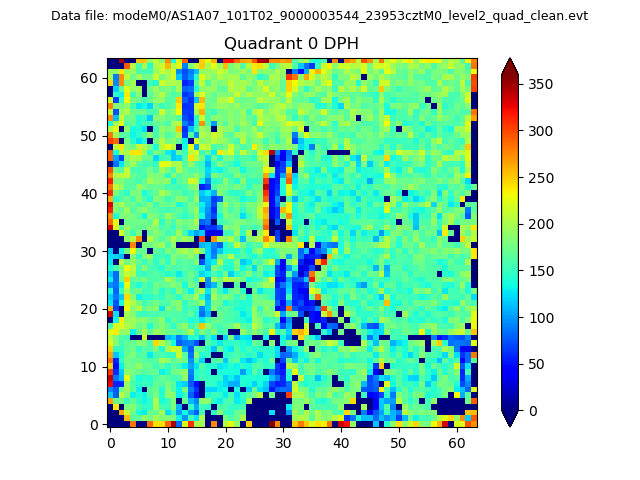 |
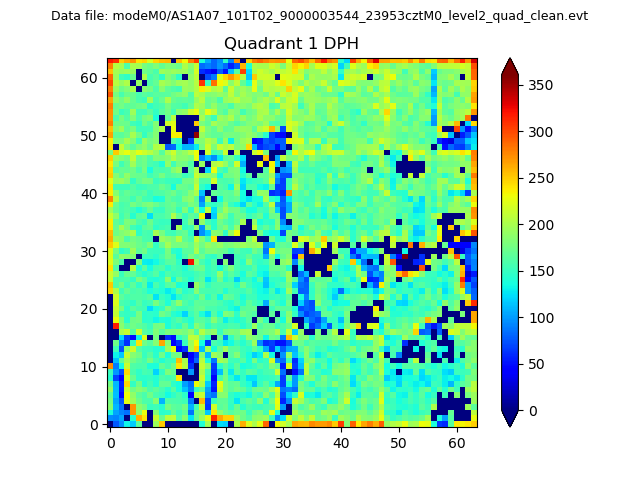 |
Quadrant B |
|---|---|---|---|
| Quadrant D | 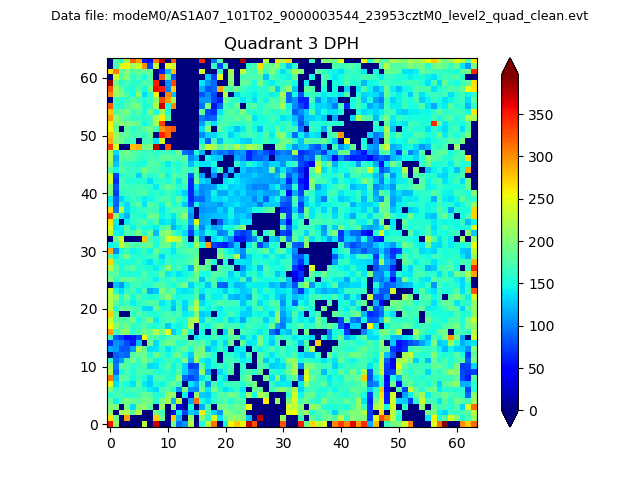 |
 |
Quadrant C |
| Plot type | Count rate plots | Images |
|---|---|---|
| Comparison with Poisson distribution Blue bars denote a histogram of data divided into 1 sec bins. Red curve is a Poisson curve with rate = median count rate of data. |
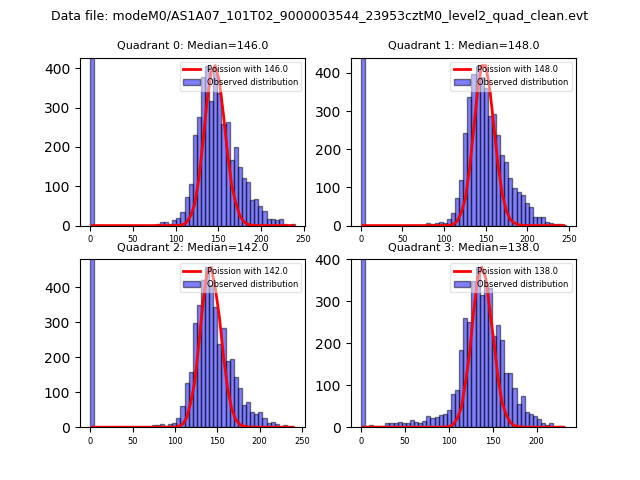 |
 |
| Quadrant-wise count rates Data is divided into 100 sec bins |
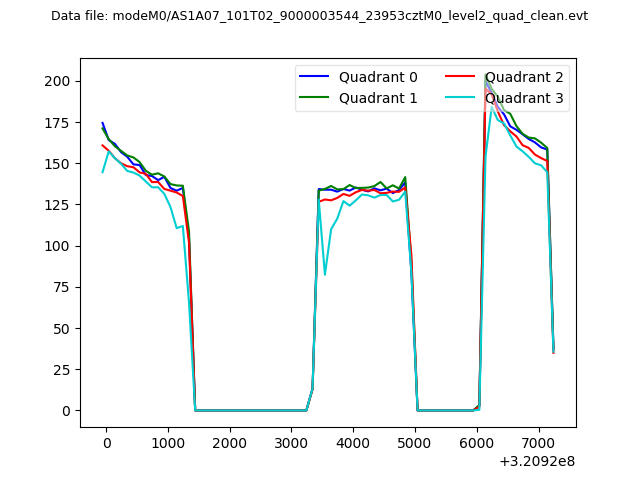 |
|
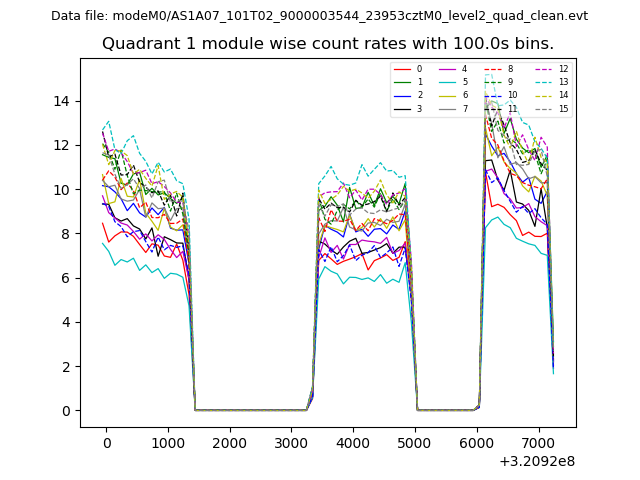
| Module-wise count rates for Quadrant A Data is divided into 100 sec bins |
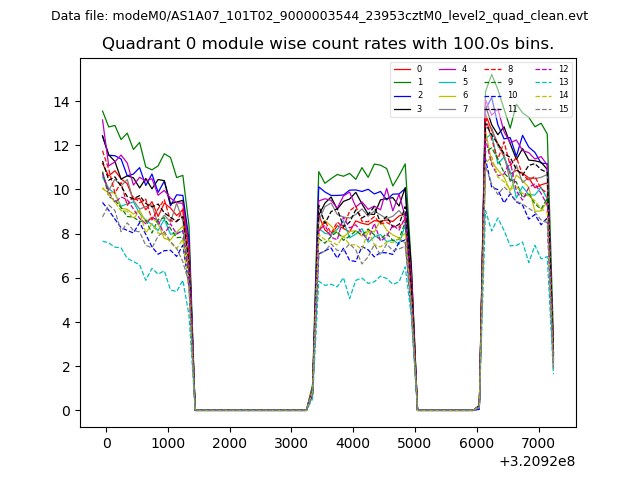 |
 |
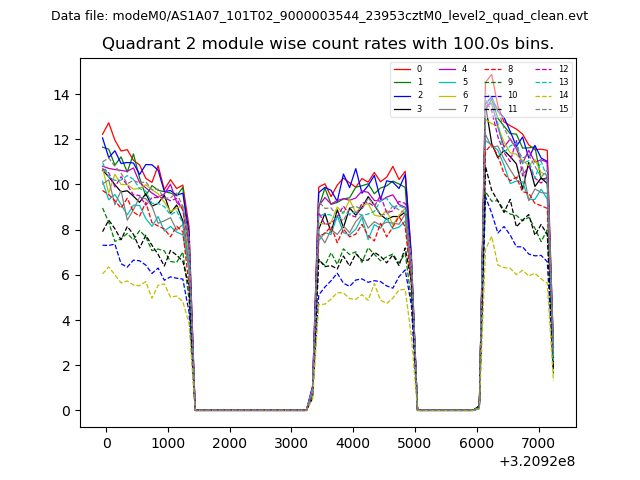
| Module-wise count rates for Quadrant B Data is divided into 100 sec bins |
 |
 |
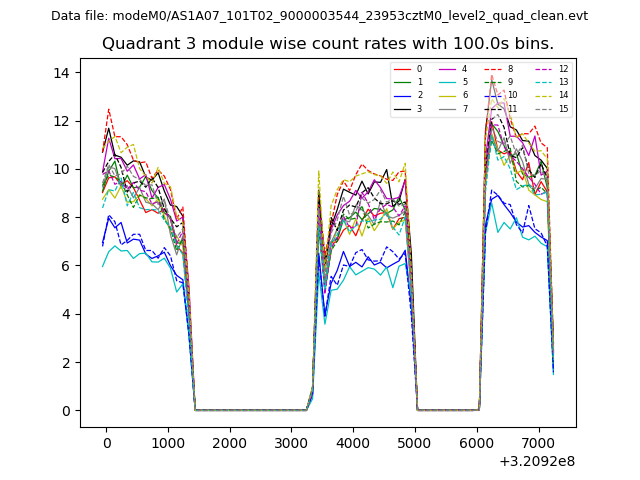
| Module-wise count rates for Quadrant C Data is divided into 100 sec bins |
 |
 |
| Module-wise count rates for Quadrant D Data is divided into 100 sec bins |
 |
 |
| Parameter | Plot |
|---|---|
| CZT HV Monitor | 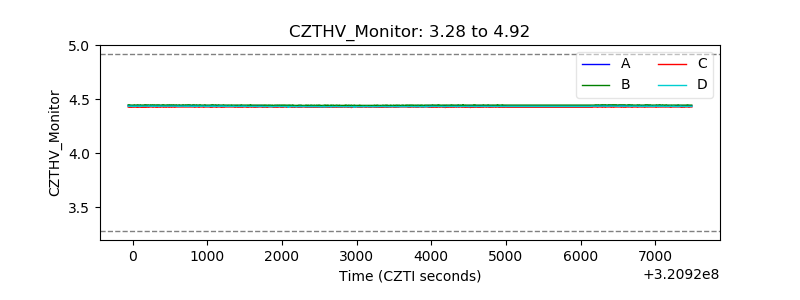 |
| D_VDD | 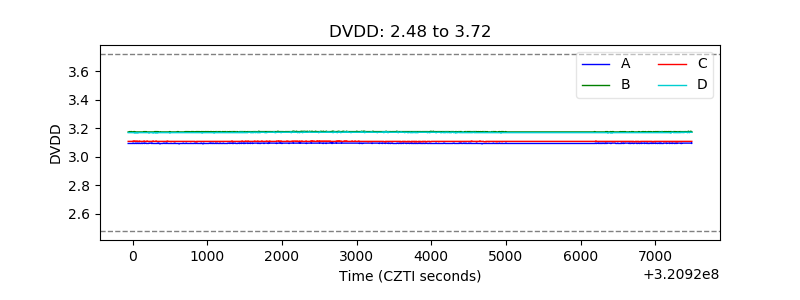 |
| Temperature 1 | 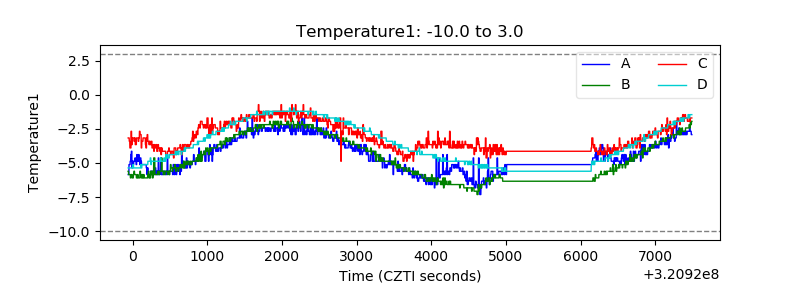 |
| Veto HV Monitor | 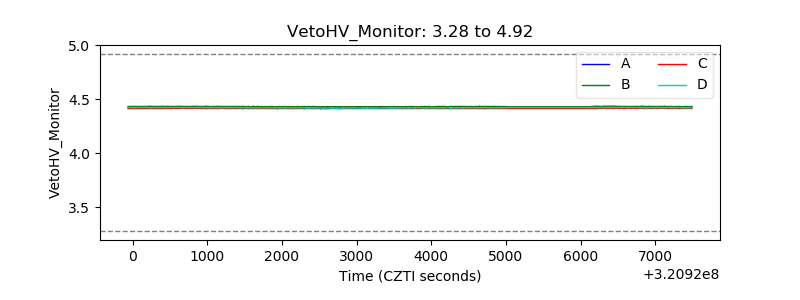 |
| Veto LLD | 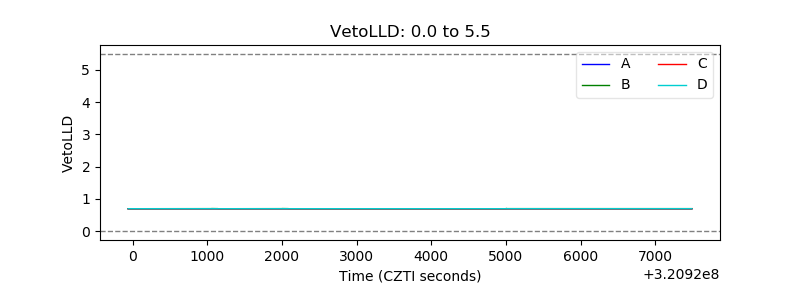 |
| Alpha Counter |  |
| _CPM_Rate |  |
| CZT Counter | 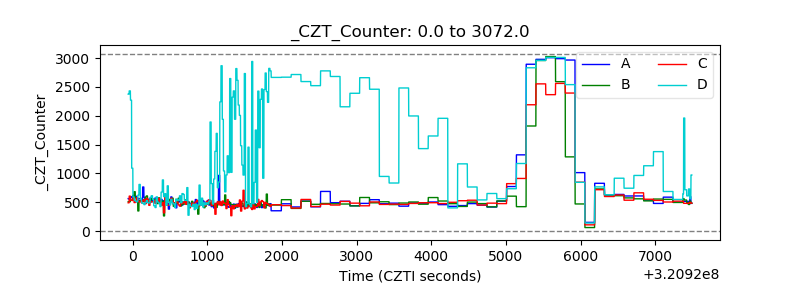 |
| +2.5 Volts monitor |  |
| +5 Volts monitor |  |
| _ROLL_ROT |  |
| _Roll_DEC | 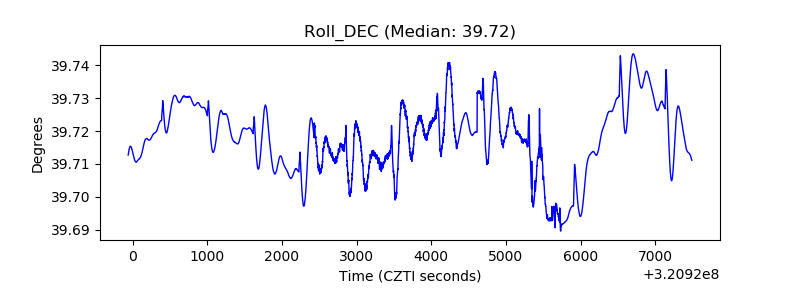 |
| _Roll_RA | 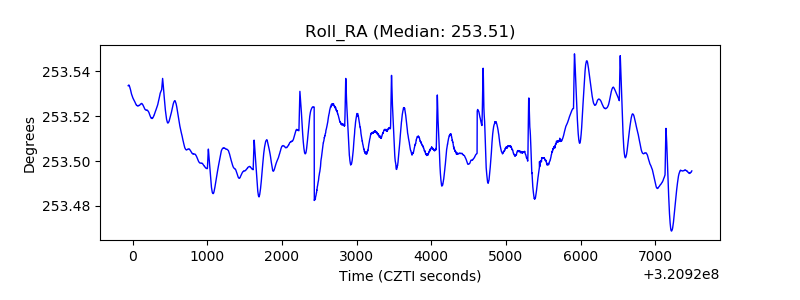 |
| Veto Counter | 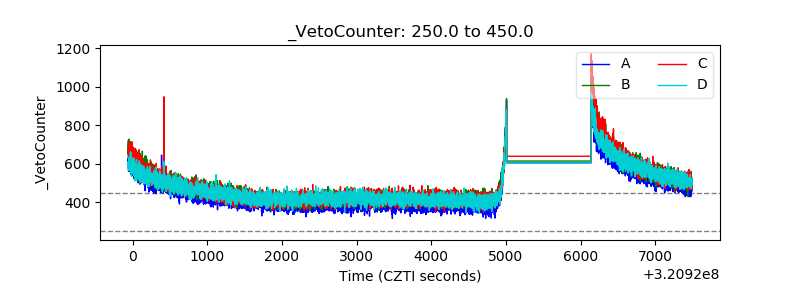 |