| Param | Original file | Final file |
|---|---|---|
| Filename | modeM0/AS1A07_101T02_9000003544_23954cztM0_level2.evt | modeM0/AS1A07_101T02_9000003544_23954cztM0_level2_quad_clean.evt |
| Size (bytes) | 545,794,560 | 89,328,960 |
| Size | 520.5 MB | 85.2 MB |
| Events in quadrant A | 3,253,996 | 580,231 |
| Events in quadrant B | 3,284,391 | 588,967 |
| Events in quadrant C | 3,278,285 | 563,014 |
| Events in quadrant D | 6,297,544 | 545,088 |
| Mode SS | |||
|---|---|---|---|
| Quadrant | BADHDUFLAG | Total packets | Discarded packets |
| A | 0 | 124 | 0 |
| B | 0 | 124 | 0 |
| C | 0 | 124 | 0 |
| D | 0 | 124 | 0 |
| Mode M0 | |||
|---|---|---|---|
| Quadrant | BADHDUFLAG | Total packets | Discarded packets |
| A | 0 | 13449 | 1 |
| B | 0 | 13490 | 1 |
| C | 0 | 13431 | 1 |
| D | 0 | 23125 | 1 |
| Mode M9 | |||
|---|---|---|---|
| Quadrant | BADHDUFLAG | Total packets | Discarded packets |
| A | 0 | 13 | 0 |
| B | 0 | 13 | 0 |
| C | 0 | 13 | 0 |
| D | 0 | 13 | 0 |
| Quadrant | Total seconds | Saturated seconds | Saturation percentage |
|---|---|---|---|
| A | 6131 | 67 | 1.092807% |
| B | 6131 | 62 | 1.011254% |
| C | 6131 | 99 | 1.614745% |
| D | 6131 | 831 | 13.554069% |
Noise dominated data is calculated using 1-second bins in cleaned event files. If a bin has >2000 counts, and if more than 50% of those come from <1% of pixels, then it is considered to be noise-dominated and hence unusable.
| Quadrant | # 1 sec bins | Bins with >0 counts | Bins with >2000 counts | High rate bins dominated by noise | Noise dominated (total time) | Noise dominated (detector-on time) | Marked lightcurve |
|---|---|---|---|---|---|---|---|
| A | 7366 | 6132 | 0 | 0 | 0.00% | 0.00% | 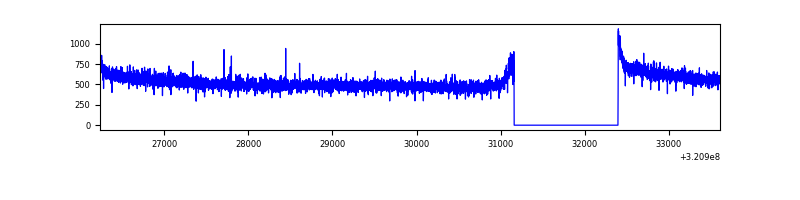 |
| B | 7366 | 6132 | 1 | 1 | 0.01% | 0.02% | 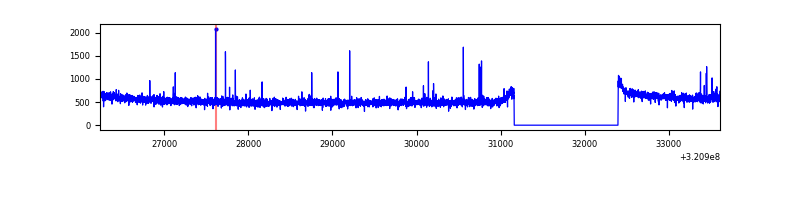 |
| C | 7366 | 6132 | 7 | 7 | 0.10% | 0.11% | 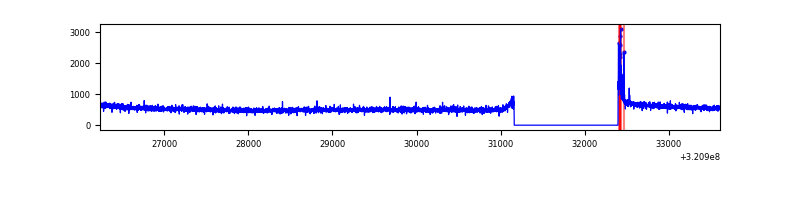 |
| D | 7366 | 6132 | 679 | 679 | 9.22% | 11.07% | 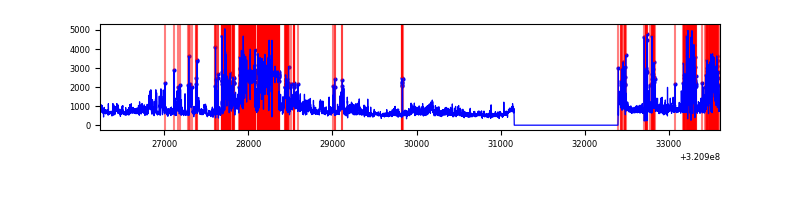 |
Top three noisy pixels from each quadrant. If the there are fewer than three noisy pixels in the level2.evt file, extra rows are filled as -1
| Pixel properties | Quadrant properties | ||||||
|---|---|---|---|---|---|---|---|
| Quadrant | DetID | PixID | Counts | Sigma | Mean | Median | Sigma |
| A | 13 | 254 | 9524 | 52.15 | 842 | 826 | 166.8 |
| A | 0 | 226 | 7295 | 38.79 | 842 | 826 | 166.8 |
| A | 14 | 111 | 7084 | 37.52 | 842 | 826 | 166.8 |
| B | 12 | 111 | 18220 | 113.15 | 824 | 806 | 153.9 |
| B | 3 | 64 | 16412 | 101.4 | 824 | 806 | 153.9 |
| B | 11 | 111 | 15836 | 97.66 | 824 | 806 | 153.9 |
| C | 14 | 238 | 129398 | 704.01 | 795 | 803 | 182.7 |
| C | 0 | 10 | 44824 | 241.0 | 795 | 803 | 182.7 |
| C | 13 | 61 | 5476 | 25.58 | 795 | 803 | 182.7 |
| D | 12 | 218 | 2109183 | 11558.26 | 759 | 738 | 182.4 |
| D | 8 | 195 | 1036381 | 5677.28 | 759 | 738 | 182.4 |
| D | 2 | 82 | 206217 | 1126.41 | 759 | 738 | 182.4 |
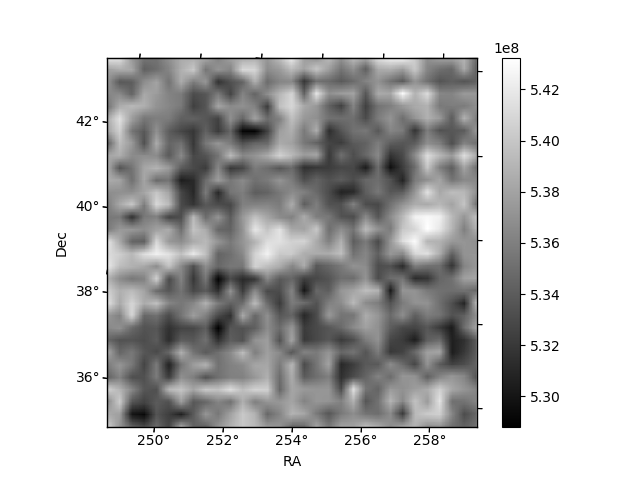
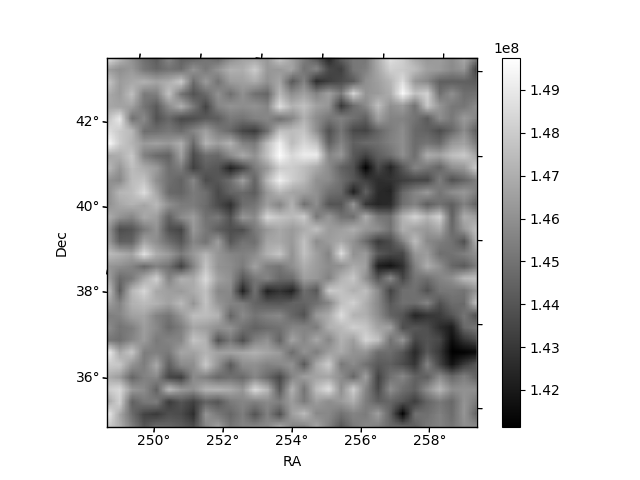
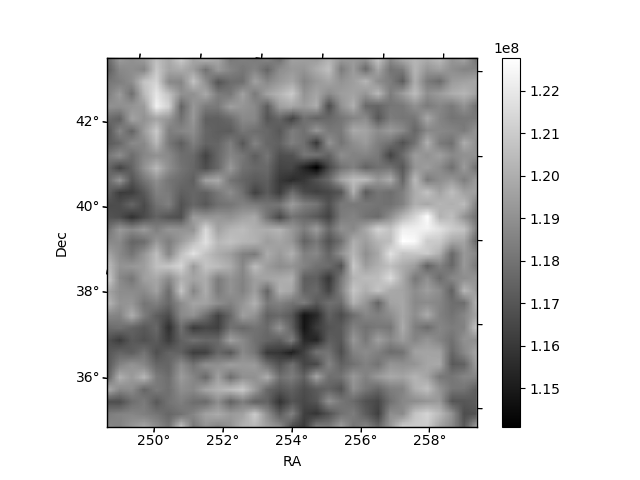
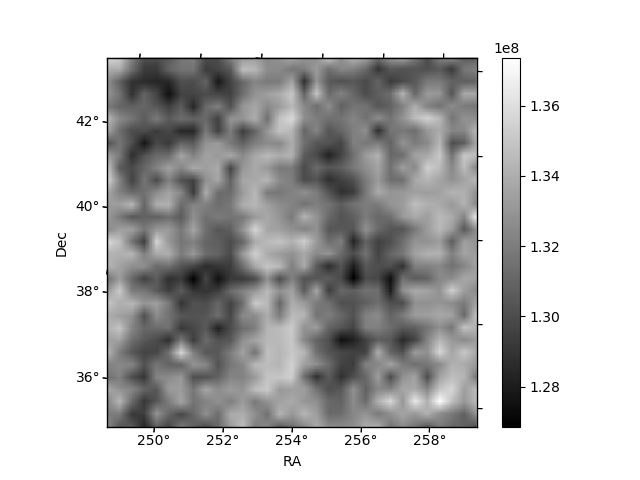
Histogram calculated using DETX and DETY for each event in the final _common_clean file
| Quadrant A | 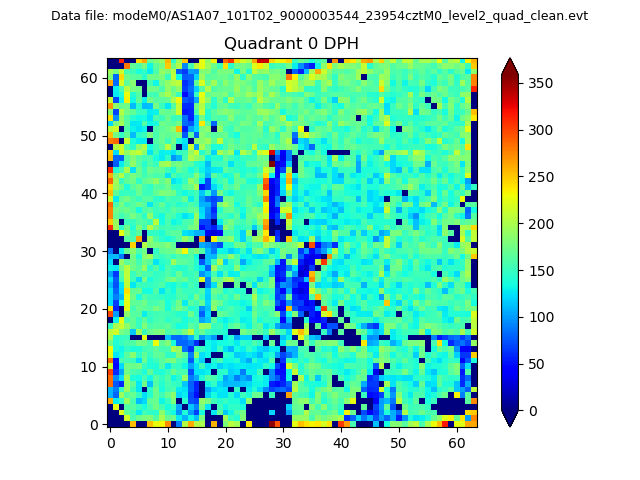 |
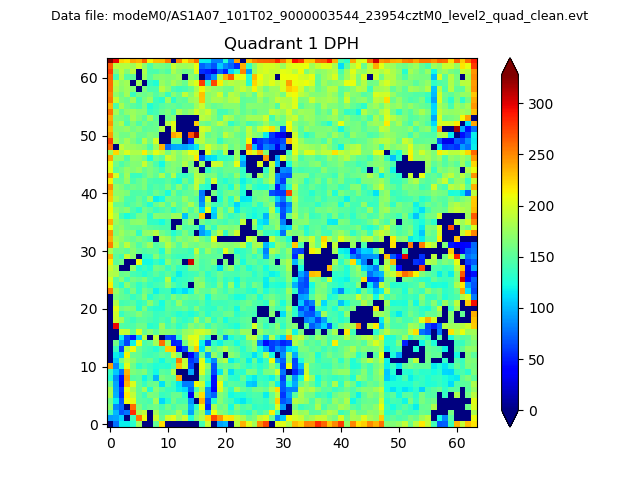 |
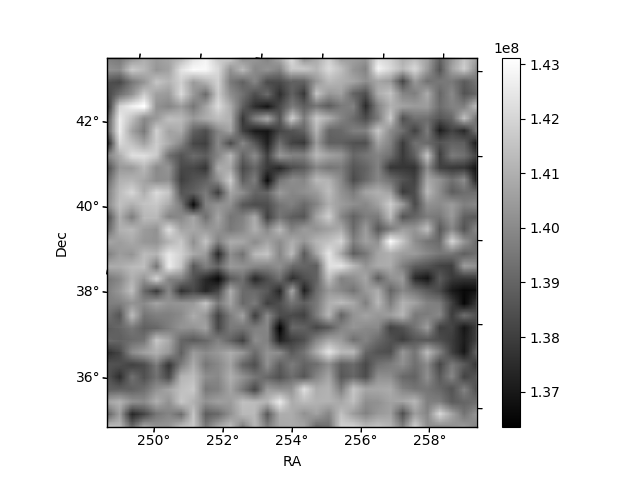
Quadrant B |
|---|---|---|---|
| Quadrant D |  |
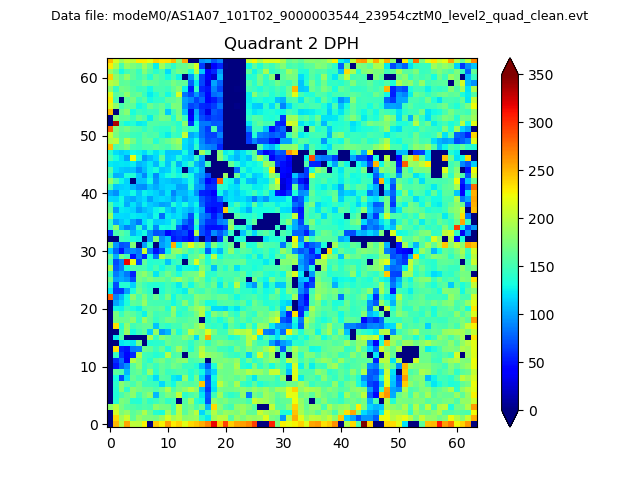 |
Quadrant C |
| Plot type | Count rate plots | Images |
|---|---|---|
| Comparison with Poisson distribution Blue bars denote a histogram of data divided into 1 sec bins. Red curve is a Poisson curve with rate = median count rate of data. |
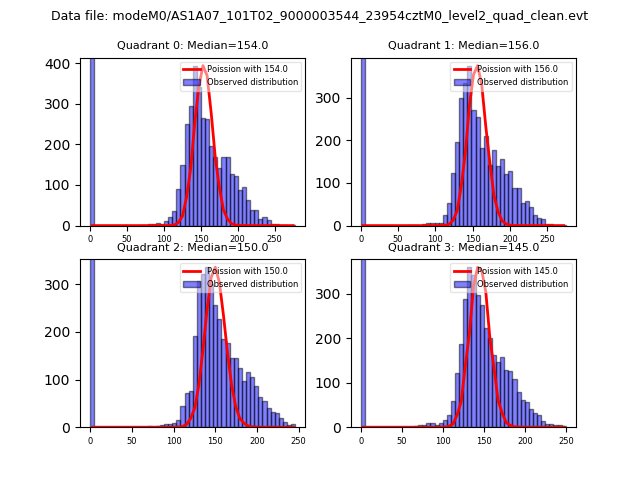 |
 |
| Quadrant-wise count rates Data is divided into 100 sec bins |
 |
|
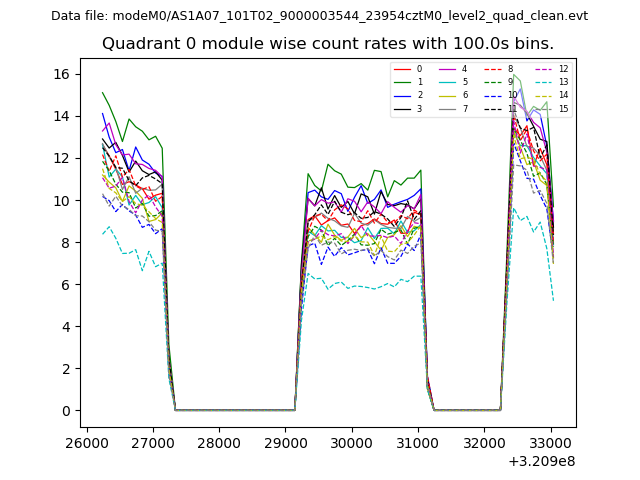
| Module-wise count rates for Quadrant A Data is divided into 100 sec bins |
 |
 |
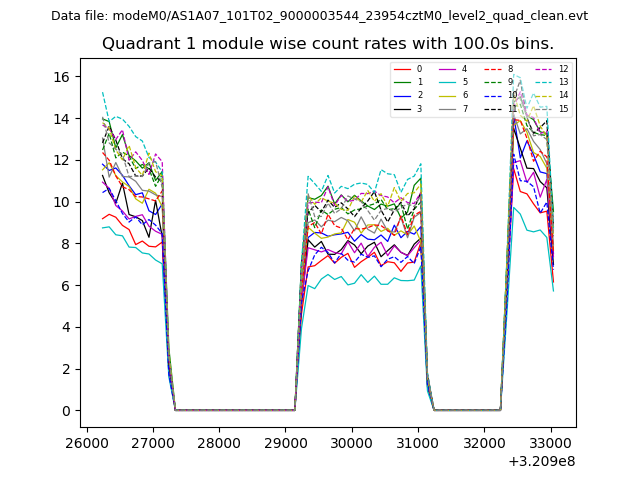
| Module-wise count rates for Quadrant B Data is divided into 100 sec bins |
 |
 |
| Module-wise count rates for Quadrant C Data is divided into 100 sec bins |
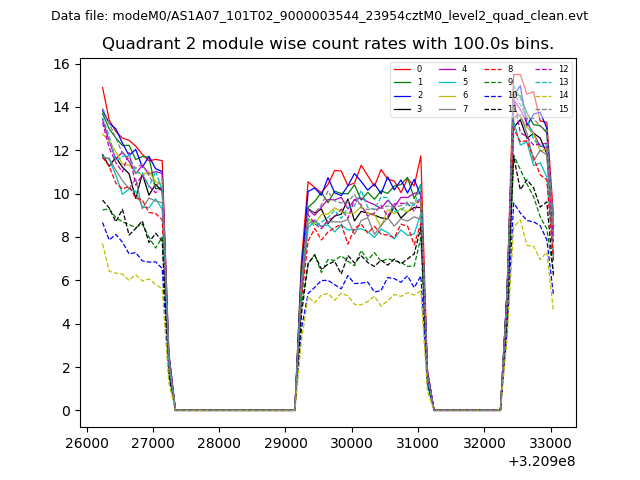 |
 |
| Module-wise count rates for Quadrant D Data is divided into 100 sec bins |
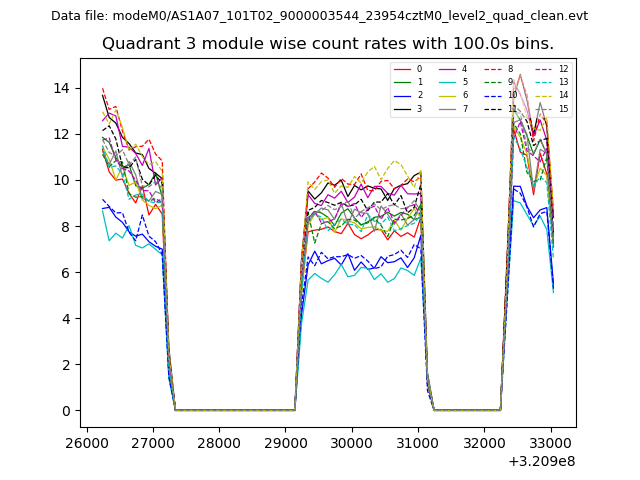 |
 |
| Parameter | Plot |
|---|---|
| CZT HV Monitor |  |
| D_VDD | 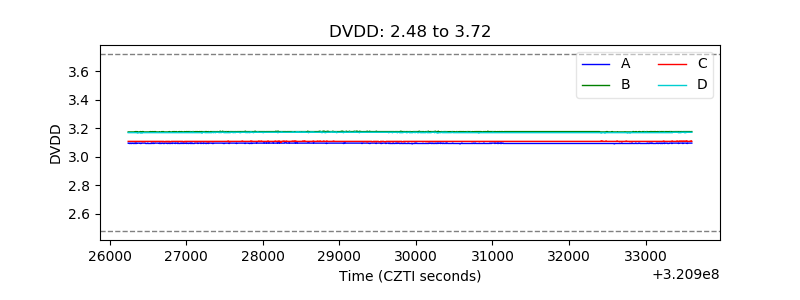 |
| Temperature 1 | 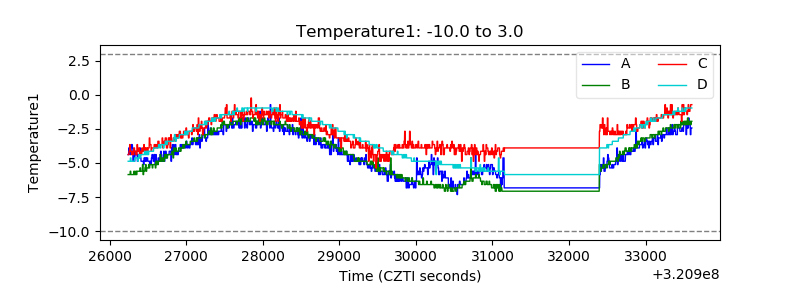 |
| Veto HV Monitor | 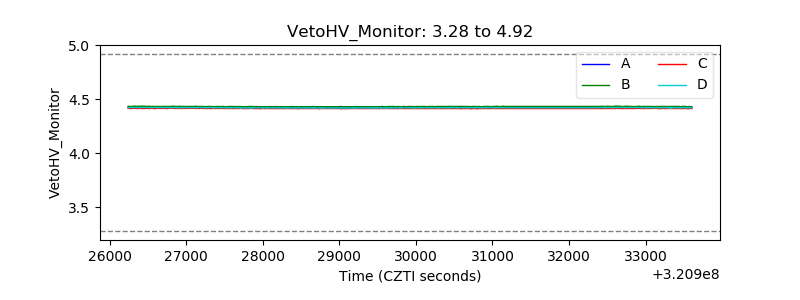 |
| Veto LLD | 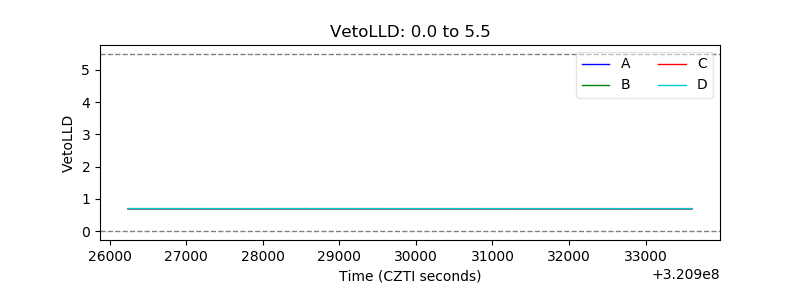 |
| Alpha Counter | 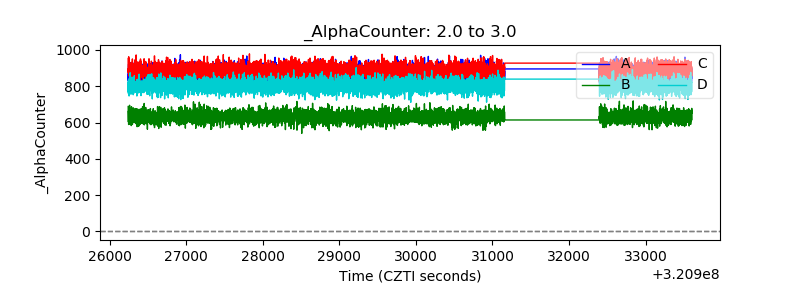 |
| _CPM_Rate | 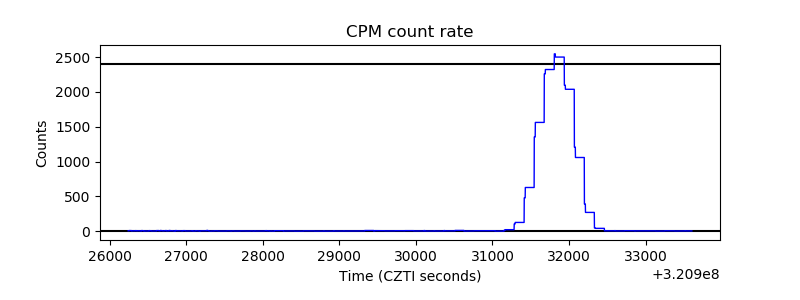 |
| CZT Counter | 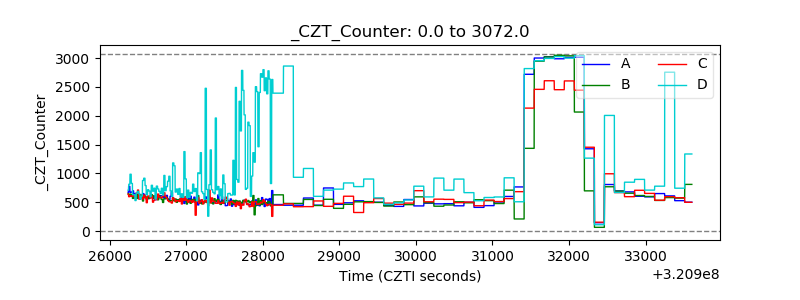 |
| +2.5 Volts monitor |  |
| +5 Volts monitor |  |
| _ROLL_ROT | 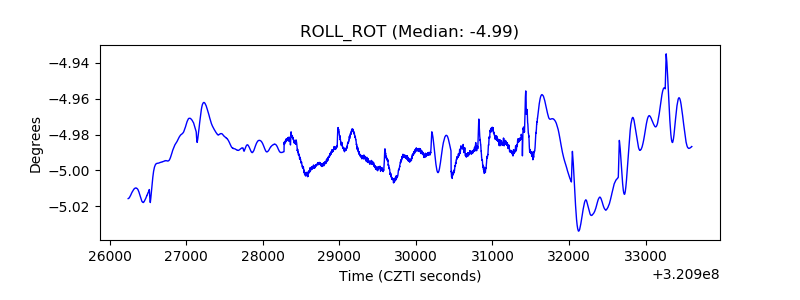 |
| _Roll_DEC | 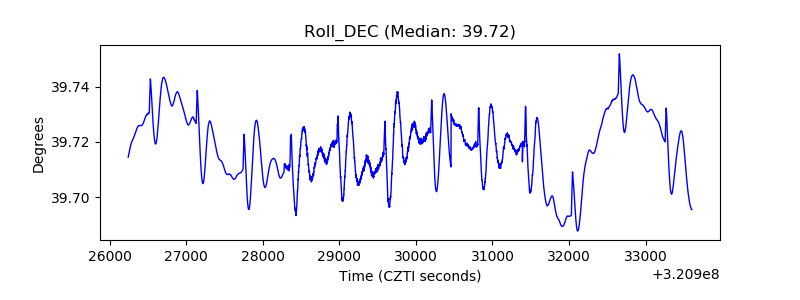 |
| _Roll_RA | 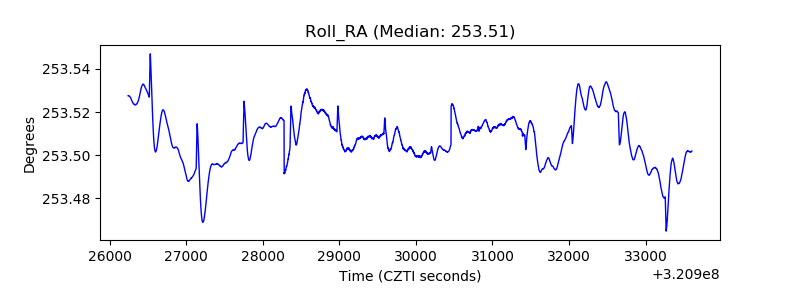 |
| Veto Counter | 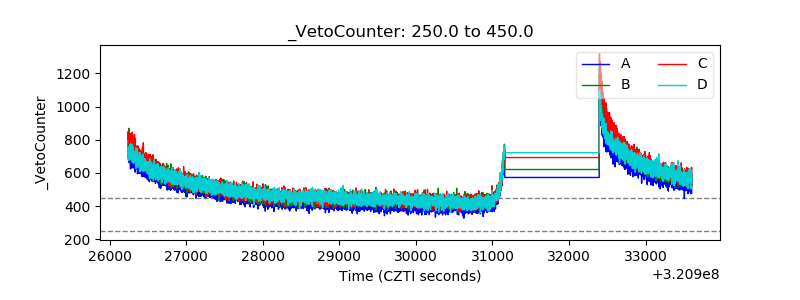 |