| Param | Original file | Final file |
|---|---|---|
| Filename | modeM0/AS1A07_101T02_9000003544_23956cztM0_level2.evt | modeM0/AS1A07_101T02_9000003544_23956cztM0_level2_quad_clean.evt |
| Size (bytes) | 567,601,920 | 63,961,920 |
| Size | 541.3 MB | 61.0 MB |
| Events in quadrant A | 3,283,850 | 385,367 |
| Events in quadrant B | 3,418,502 | 389,700 |
| Events in quadrant C | 3,428,329 | 379,058 |
| Events in quadrant D | 6,648,354 | 358,431 |
| Mode SS | |||
|---|---|---|---|
| Quadrant | BADHDUFLAG | Total packets | Discarded packets |
| A | 0 | 124 | 0 |
| B | 0 | 124 | 0 |
| C | 0 | 124 | 0 |
| D | 0 | 124 | 0 |
| Mode M0 | |||
|---|---|---|---|
| Quadrant | BADHDUFLAG | Total packets | Discarded packets |
| A | 0 | 13579 | 1 |
| B | 0 | 13990 | 1 |
| C | 0 | 14011 | 1 |
| D | 0 | 24166 | 1 |
| Mode M9 | |||
|---|---|---|---|
| Quadrant | BADHDUFLAG | Total packets | Discarded packets |
| A | 0 | 14 | 0 |
| B | 0 | 14 | 0 |
| C | 0 | 14 | 0 |
| D | 0 | 14 | 0 |
| Quadrant | Total seconds | Saturated seconds | Saturation percentage |
|---|---|---|---|
| A | 6066 | 79 | 1.302341% |
| B | 6067 | 106 | 1.747157% |
| C | 6067 | 131 | 2.159222% |
| D | 6067 | 770 | 12.691610% |
Noise dominated data is calculated using 1-second bins in cleaned event files. If a bin has >2000 counts, and if more than 50% of those come from <1% of pixels, then it is considered to be noise-dominated and hence unusable.
| Quadrant | # 1 sec bins | Bins with >0 counts | Bins with >2000 counts | High rate bins dominated by noise | Noise dominated (total time) | Noise dominated (detector-on time) | Marked lightcurve |
|---|---|---|---|---|---|---|---|
| A | 7431 | 6067 | 0 | 0 | 0.00% | 0.00% | 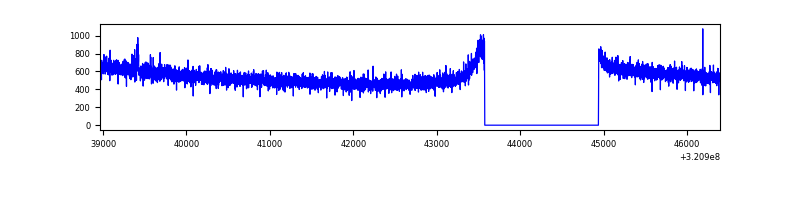 |
| B | 7432 | 6068 | 18 | 18 | 0.24% | 0.30% | 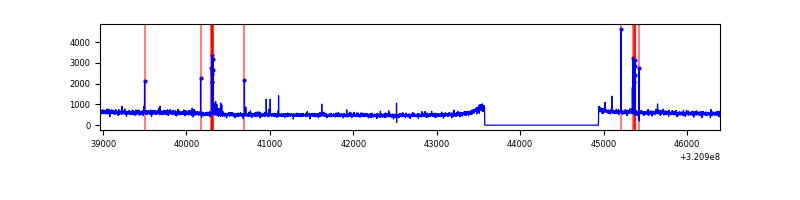 |
| C | 7432 | 6068 | 5 | 5 | 0.07% | 0.08% | 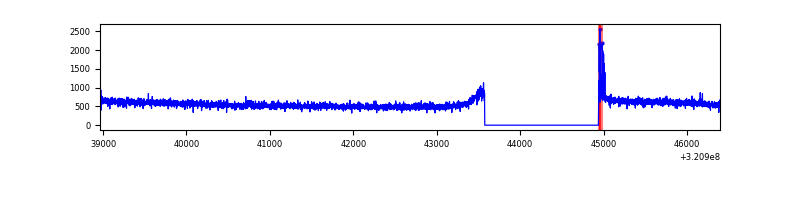 |
| D | 7432 | 6068 | 612 | 612 | 8.23% | 10.09% | 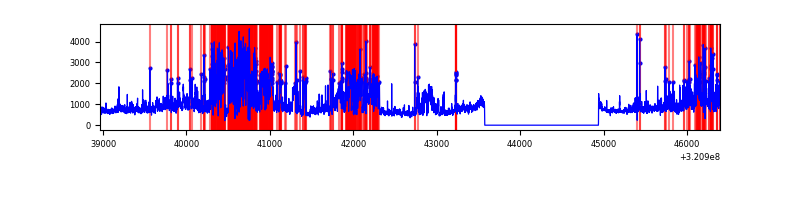 |
Top three noisy pixels from each quadrant. If the there are fewer than three noisy pixels in the level2.evt file, extra rows are filled as -1
| Pixel properties | Quadrant properties | ||||||
|---|---|---|---|---|---|---|---|
| Quadrant | DetID | PixID | Counts | Sigma | Mean | Median | Sigma |
| A | 13 | 254 | 10251 | 55.99 | 850 | 834 | 168.2 |
| A | 0 | 226 | 7555 | 39.96 | 850 | 834 | 168.2 |
| A | 15 | 174 | 7024 | 36.8 | 850 | 834 | 168.2 |
| B | 3 | 64 | 65798 | 419.83 | 835 | 818 | 154.8 |
| B | 0 | 189 | 27989 | 175.55 | 835 | 818 | 154.8 |
| B | 4 | 216 | 25323 | 158.32 | 835 | 818 | 154.8 |
| C | 14 | 238 | 133410 | 716.58 | 816 | 825 | 185.0 |
| C | 0 | 239 | 72307 | 386.34 | 816 | 825 | 185.0 |
| C | 0 | 10 | 34402 | 181.47 | 816 | 825 | 185.0 |
| D | 12 | 218 | 2004623 | 10552.41 | 790 | 767 | 189.9 |
| D | 8 | 195 | 977541 | 5143.74 | 790 | 767 | 189.9 |
| D | 2 | 82 | 216388 | 1135.47 | 790 | 767 | 189.9 |
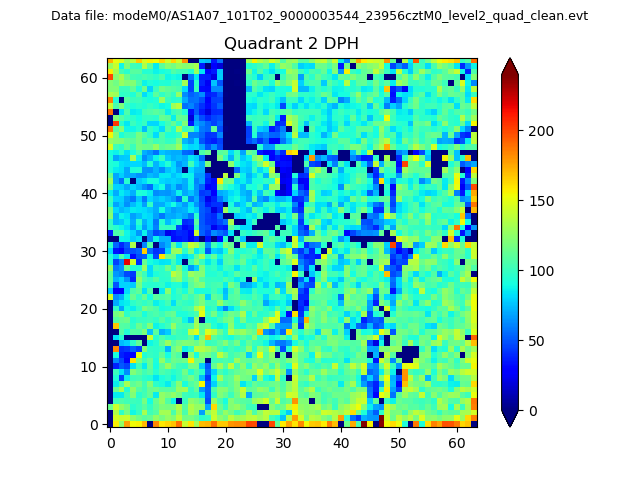
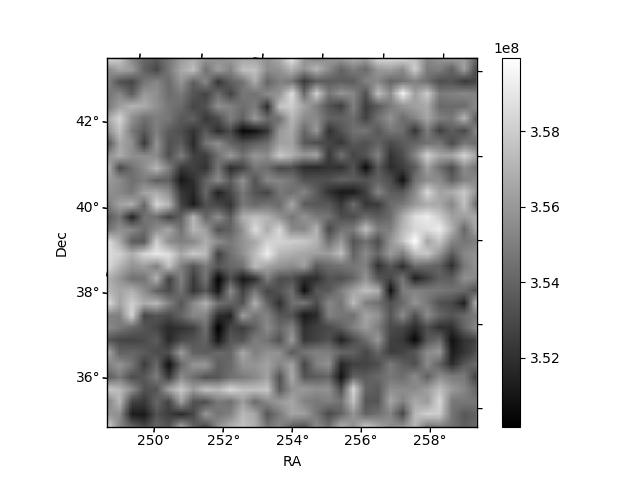
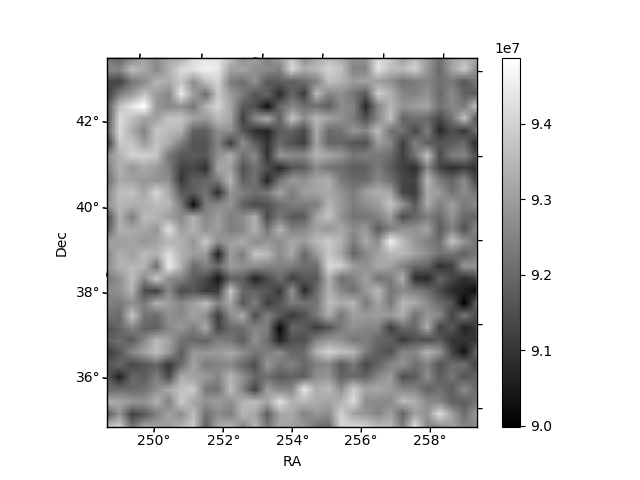
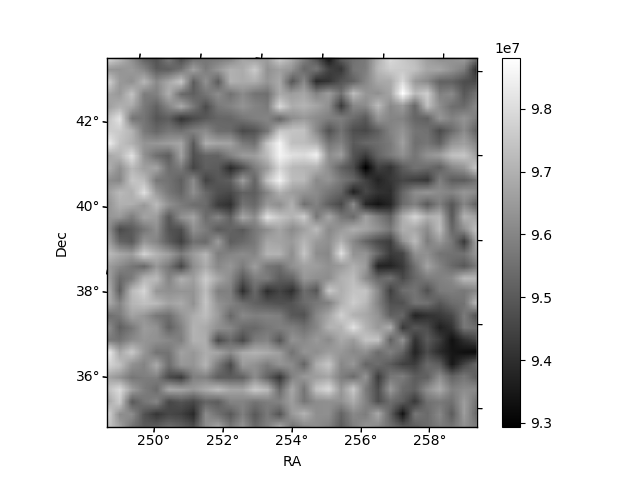
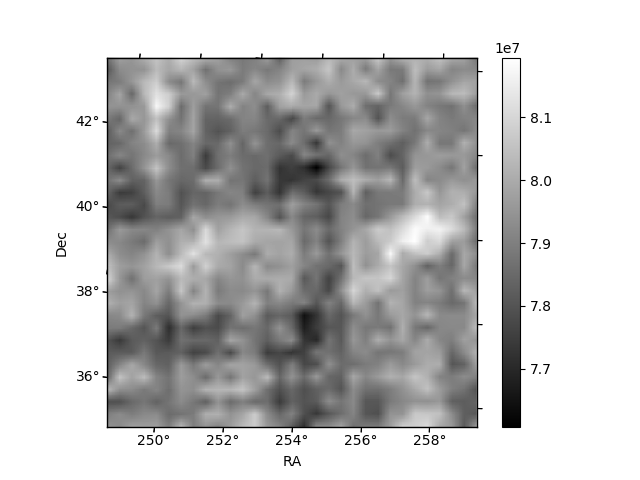
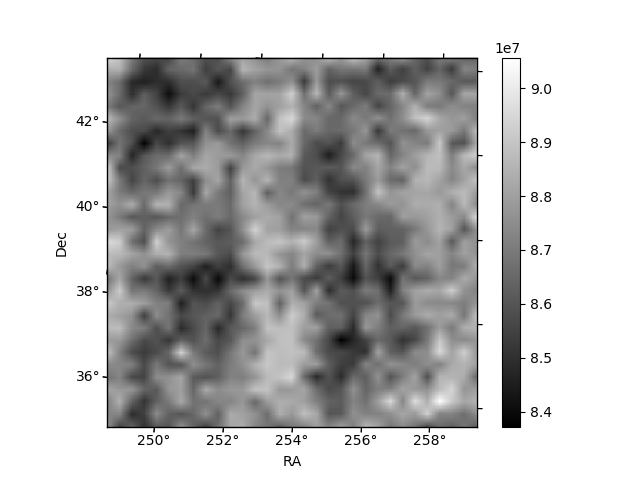
Histogram calculated using DETX and DETY for each event in the final _common_clean file
| Quadrant A | 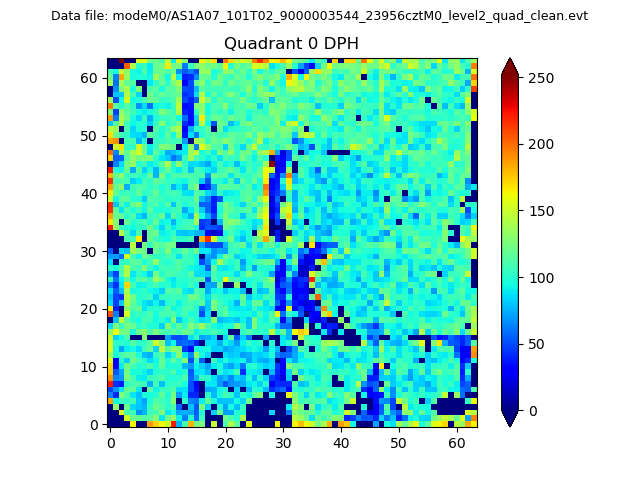 |
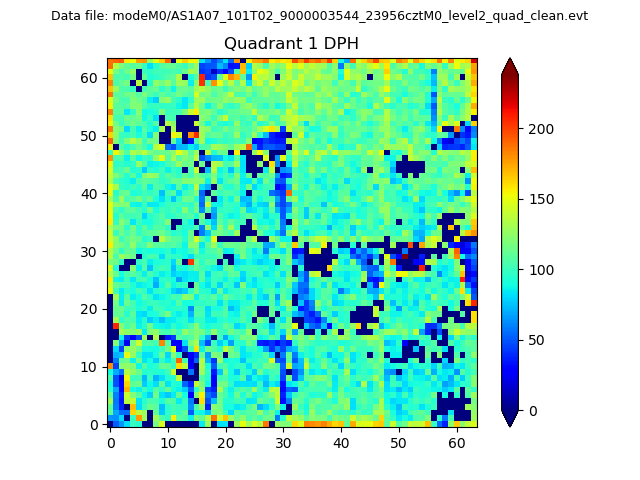 |
Quadrant B |
|---|---|---|---|
| Quadrant D | 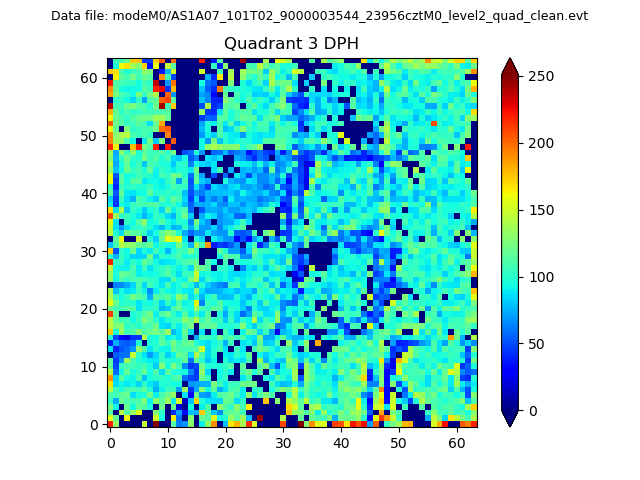 |
 |
Quadrant C |
| Plot type | Count rate plots | Images |
|---|---|---|
| Comparison with Poisson distribution Blue bars denote a histogram of data divided into 1 sec bins. Red curve is a Poisson curve with rate = median count rate of data. |
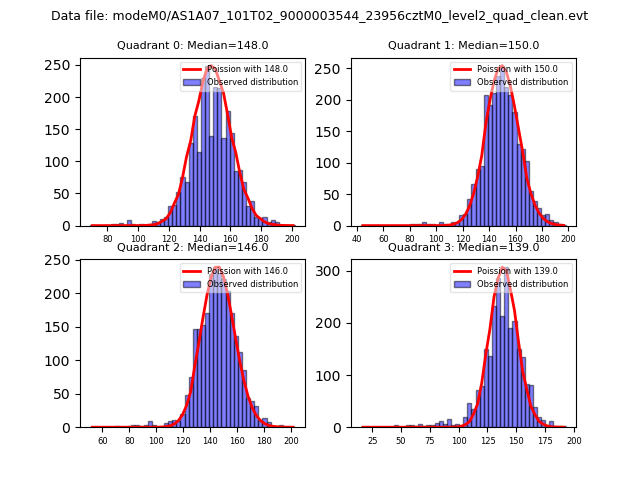 |
 |
| Quadrant-wise count rates Data is divided into 100 sec bins |
 |
|
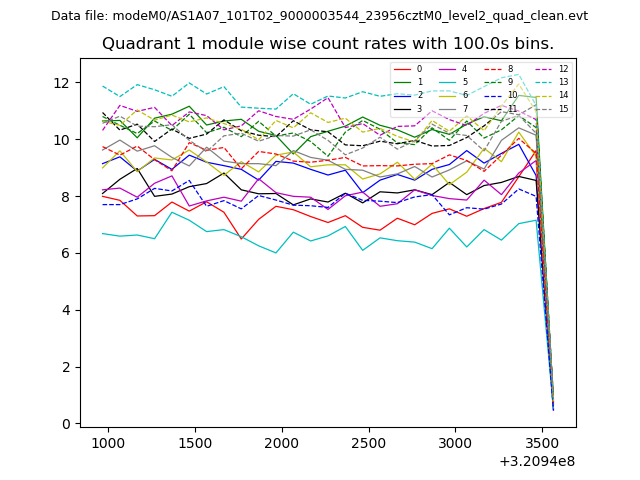
| Module-wise count rates for Quadrant A Data is divided into 100 sec bins |
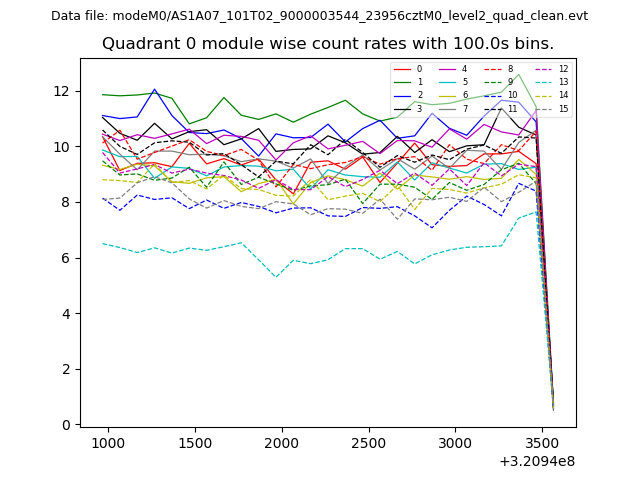 |
 |
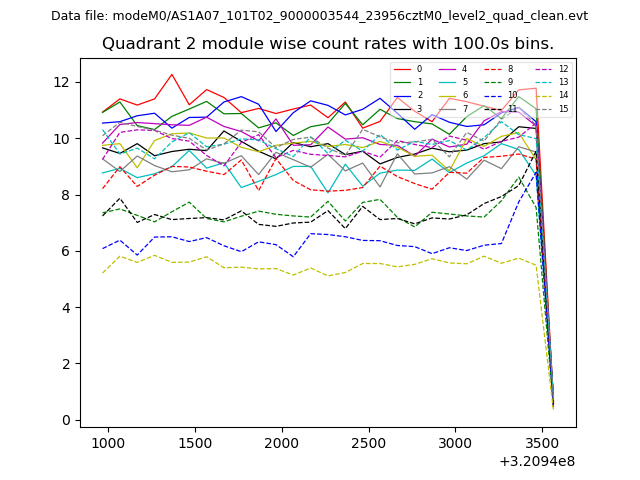
| Module-wise count rates for Quadrant B Data is divided into 100 sec bins |
 |
 |
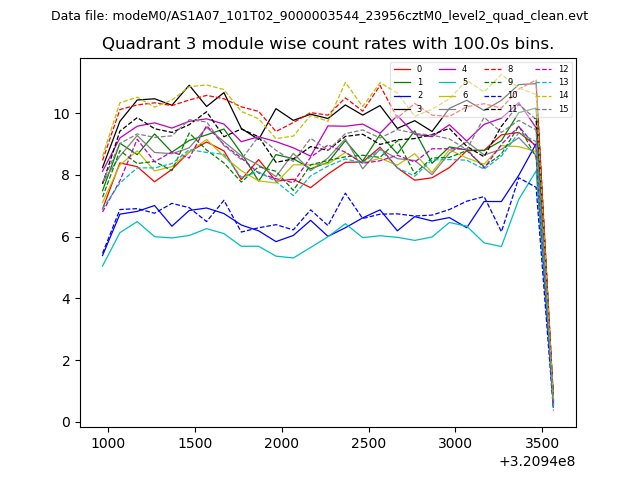
| Module-wise count rates for Quadrant C Data is divided into 100 sec bins |
 |
 |
| Module-wise count rates for Quadrant D Data is divided into 100 sec bins |
 |
 |
| Parameter | Plot |
|---|---|
| CZT HV Monitor | 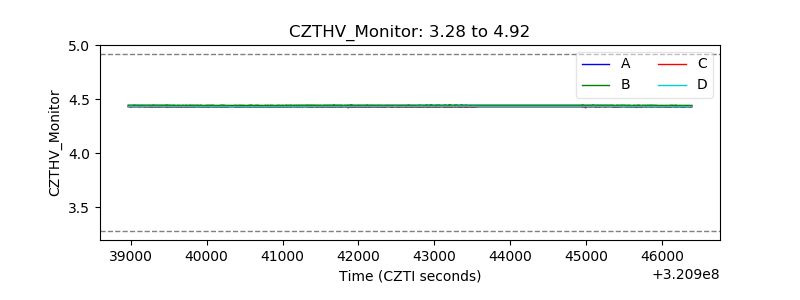 |
| D_VDD | 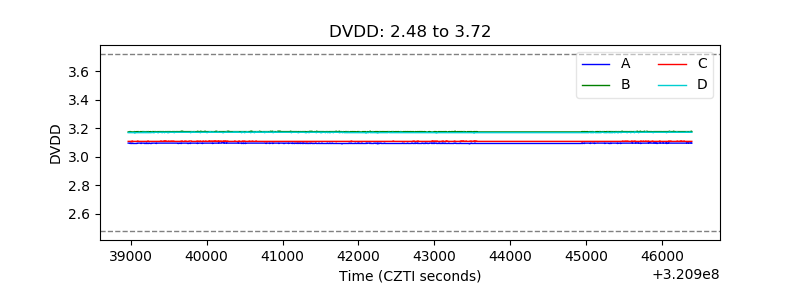 |
| Temperature 1 | 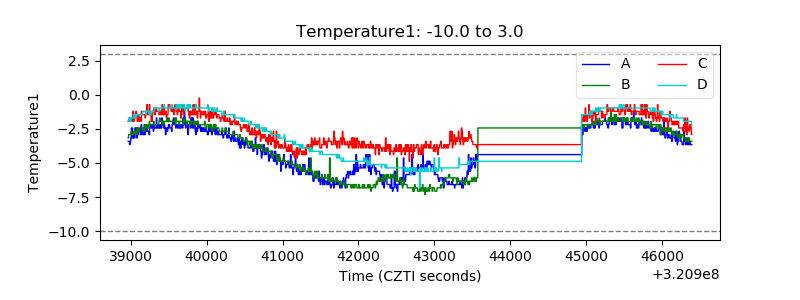 |
| Veto HV Monitor | 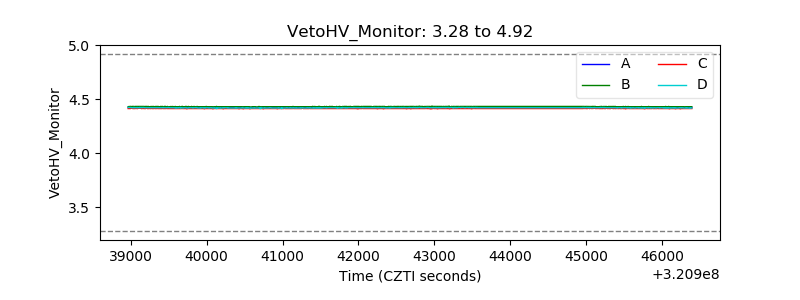 |
| Veto LLD | 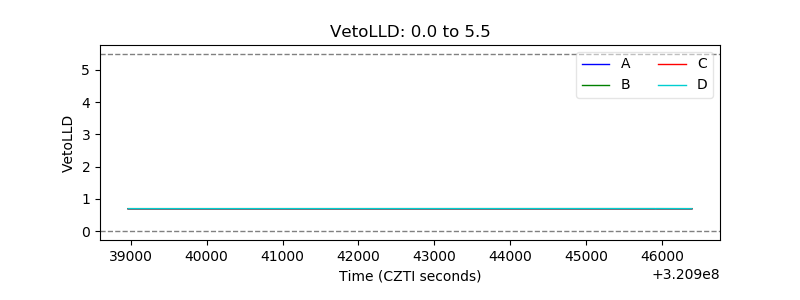 |
| Alpha Counter |  |
| _CPM_Rate | 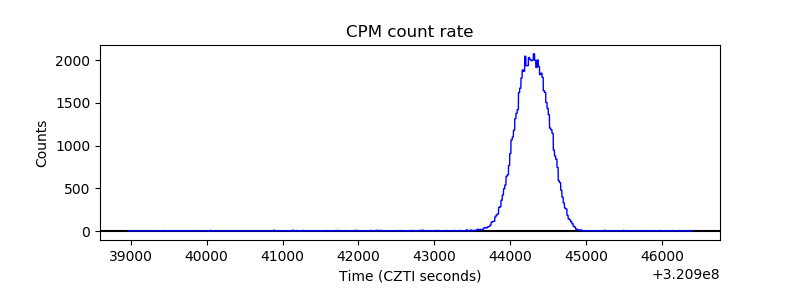 |
| CZT Counter | 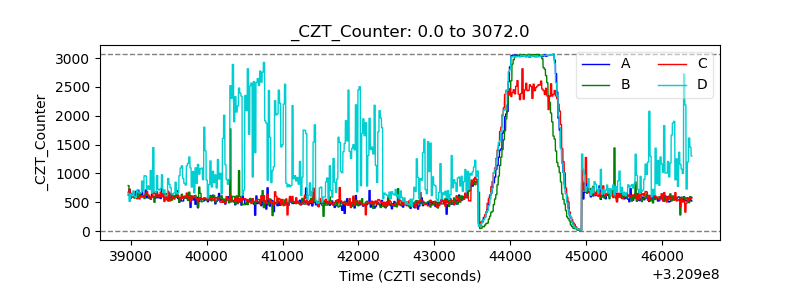 |
| +2.5 Volts monitor |  |
| +5 Volts monitor |  |
| _ROLL_ROT | 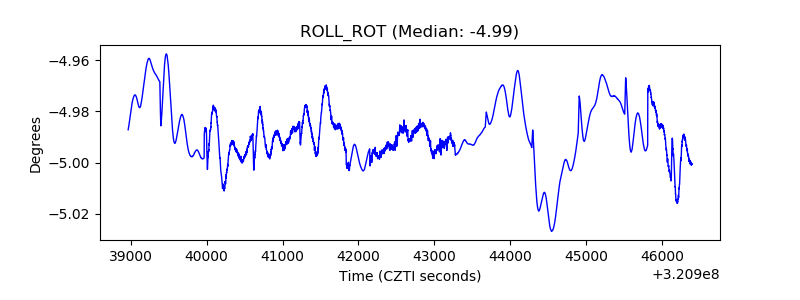 |
| _Roll_DEC |  |
| _Roll_RA | 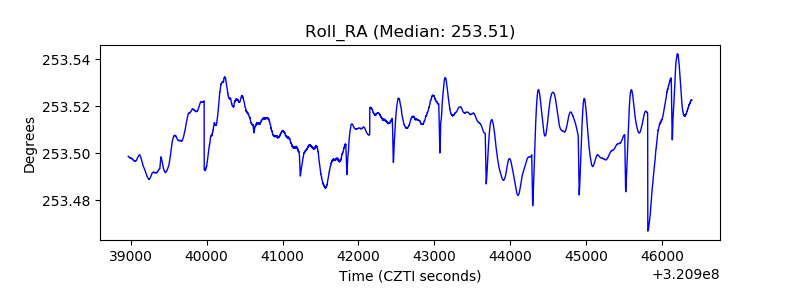 |
| Veto Counter | 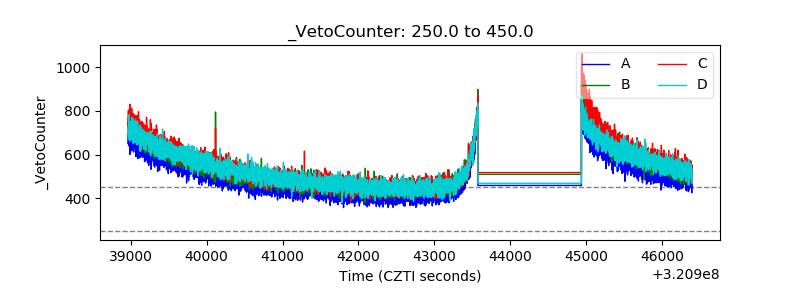 |