| Param | Original file | Final file |
|---|---|---|
| Filename | modeM0/AS1A07_101T02_9000003544_23957cztM0_level2.evt | modeM0/AS1A07_101T02_9000003544_23957cztM0_level2_quad_clean.evt |
| Size (bytes) | 582,289,920 | 73,641,600 |
| Size | 555.3 MB | 70.2 MB |
| Events in quadrant A | 3,407,885 | 452,760 |
| Events in quadrant B | 4,061,311 | 448,417 |
| Events in quadrant C | 3,610,119 | 447,369 |
| Events in quadrant D | 6,120,647 | 433,216 |
| Mode SS | |||
|---|---|---|---|
| Quadrant | BADHDUFLAG | Total packets | Discarded packets |
| A | 0 | 130 | 0 |
| B | 0 | 130 | 0 |
| C | 0 | 130 | 0 |
| D | 0 | 130 | 0 |
| Mode M0 | |||
|---|---|---|---|
| Quadrant | BADHDUFLAG | Total packets | Discarded packets |
| A | 0 | 14125 | 2 |
| B | 0 | 16110 | 2 |
| C | 0 | 14815 | 2 |
| D | 0 | 22828 | 7 |
| Mode M9 | |||
|---|---|---|---|
| Quadrant | BADHDUFLAG | Total packets | Discarded packets |
| A | 0 | 15 | 0 |
| B | 0 | 16 | 0 |
| C | 0 | 16 | 0 |
| D | 0 | 16 | 0 |
| Quadrant | Total seconds | Saturated seconds | Saturation percentage |
|---|---|---|---|
| A | 6421 | 104 | 1.619685% |
| B | 6421 | 276 | 4.298396% |
| C | 6421 | 197 | 3.068058% |
| D | 6420 | 803 | 12.507788% |
Noise dominated data is calculated using 1-second bins in cleaned event files. If a bin has >2000 counts, and if more than 50% of those come from <1% of pixels, then it is considered to be noise-dominated and hence unusable.
| Quadrant | # 1 sec bins | Bins with >0 counts | Bins with >2000 counts | High rate bins dominated by noise | Noise dominated (total time) | Noise dominated (detector-on time) | Marked lightcurve |
|---|---|---|---|---|---|---|---|
| A | 7641 | 6422 | 0 | 0 | 0.00% | 0.00% | 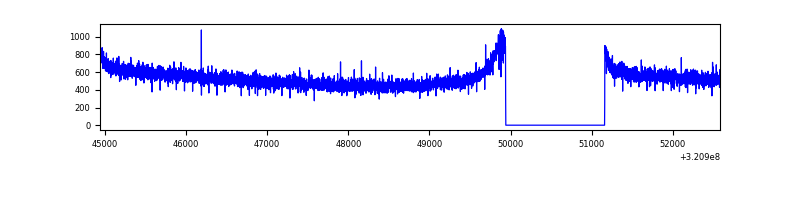 |
| B | 7641 | 6422 | 82 | 82 | 1.07% | 1.28% | 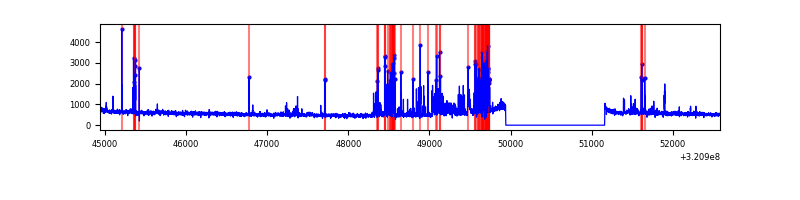 |
| C | 7641 | 6422 | 17 | 17 | 0.22% | 0.26% | 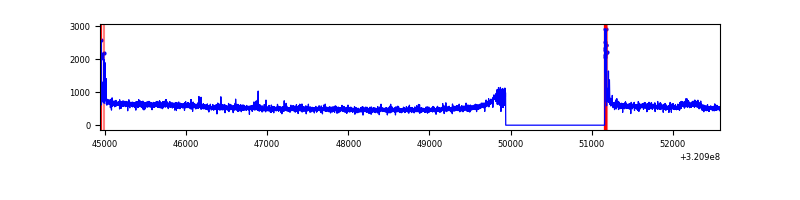 |
| D | 7640 | 6421 | 433 | 433 | 5.67% | 6.74% | 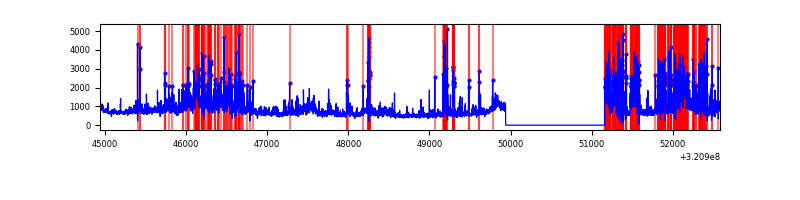 |
Top three noisy pixels from each quadrant. If the there are fewer than three noisy pixels in the level2.evt file, extra rows are filled as -1
| Pixel properties | Quadrant properties | ||||||
|---|---|---|---|---|---|---|---|
| Quadrant | DetID | PixID | Counts | Sigma | Mean | Median | Sigma |
| A | 13 | 254 | 10609 | 55.81 | 884 | 868 | 174.5 |
| A | 0 | 226 | 7706 | 39.18 | 884 | 868 | 174.5 |
| A | 3 | 137 | 7346 | 37.12 | 884 | 868 | 174.5 |
| B | 3 | 64 | 566994 | 3509.35 | 866 | 846 | 161.3 |
| B | 0 | 189 | 33700 | 203.65 | 866 | 846 | 161.3 |
| B | 4 | 216 | 21816 | 129.99 | 866 | 846 | 161.3 |
| C | 14 | 238 | 138350 | 706.51 | 851 | 858 | 194.6 |
| C | 0 | 10 | 82319 | 418.59 | 851 | 858 | 194.6 |
| C | 0 | 239 | 40405 | 203.21 | 851 | 858 | 194.6 |
| D | 12 | 218 | 1538888 | 7772.12 | 828 | 806 | 197.9 |
| D | 8 | 195 | 788329 | 3979.45 | 828 | 806 | 197.9 |
| D | 1 | 52 | 402359 | 2029.1 | 828 | 806 | 197.9 |
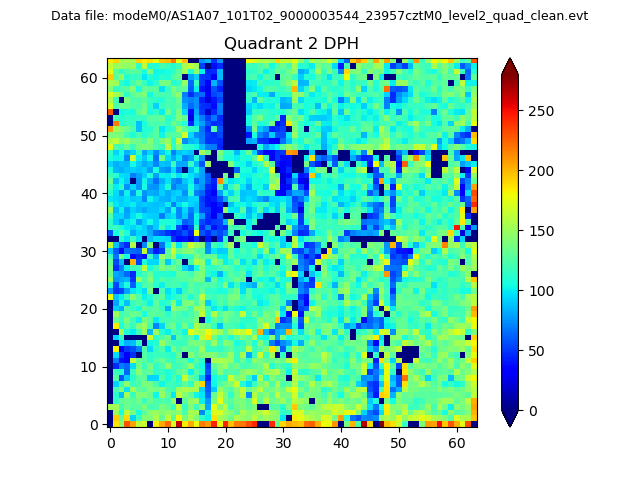
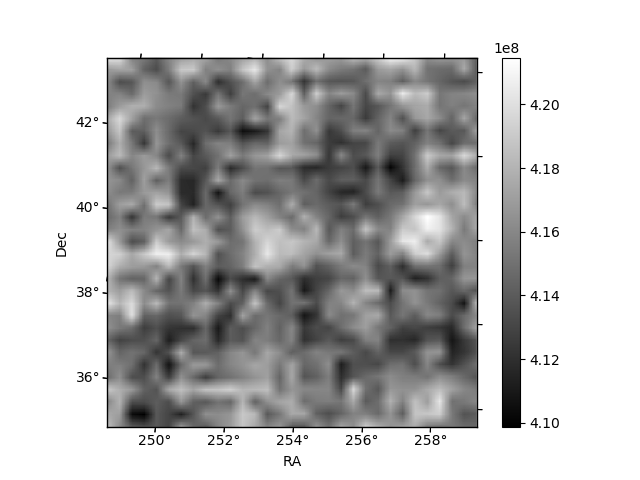
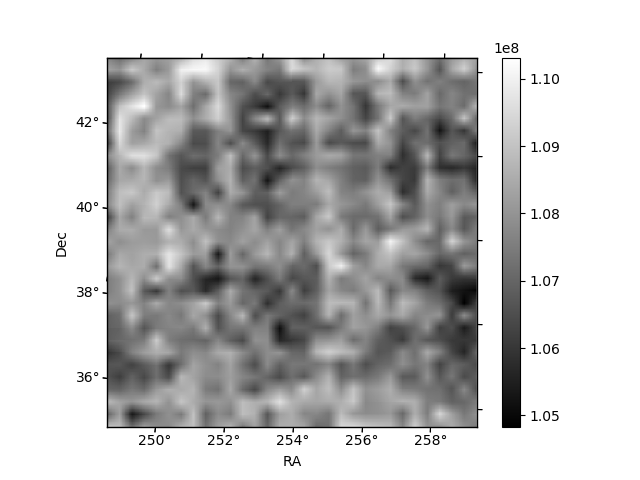
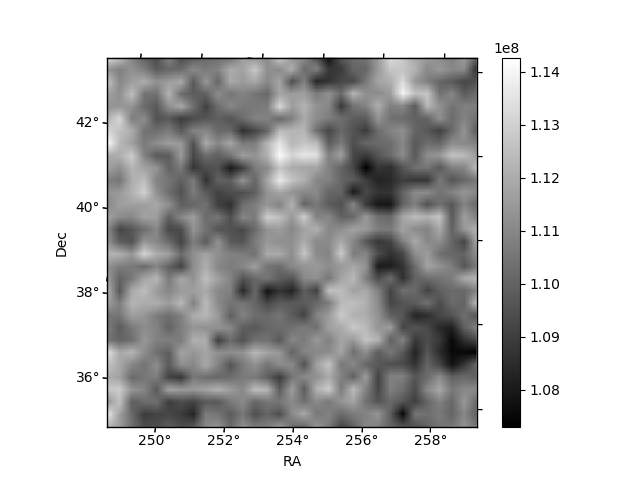
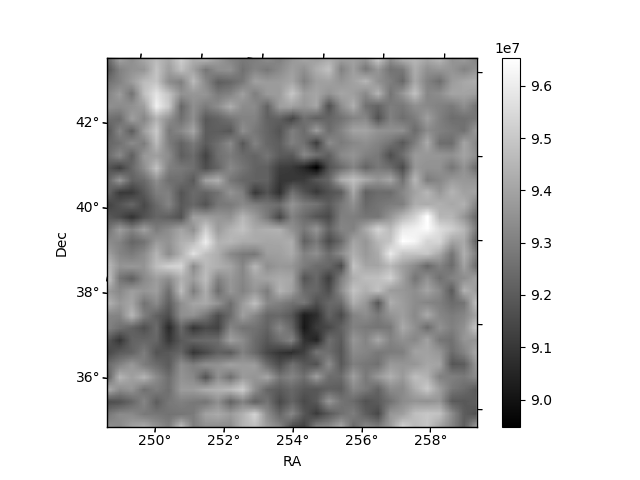
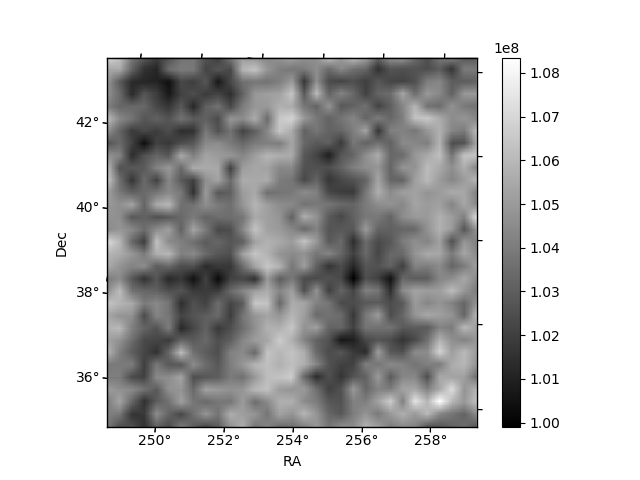
Histogram calculated using DETX and DETY for each event in the final _common_clean file
| Quadrant A | 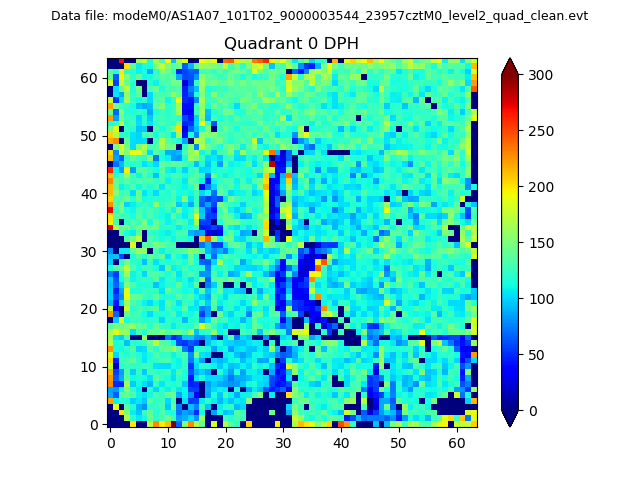 |
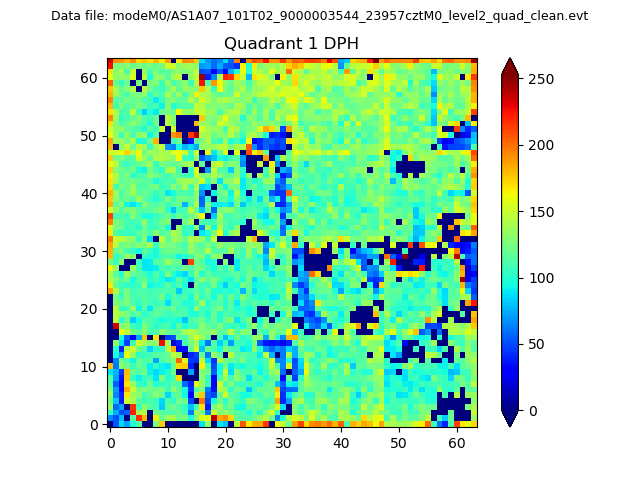 |
Quadrant B |
|---|---|---|---|
| Quadrant D | 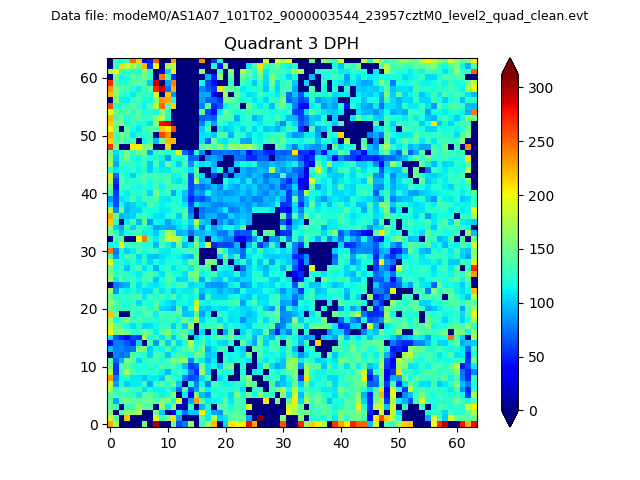 |
 |
Quadrant C |
| Plot type | Count rate plots | Images |
|---|---|---|
| Comparison with Poisson distribution Blue bars denote a histogram of data divided into 1 sec bins. Red curve is a Poisson curve with rate = median count rate of data. |
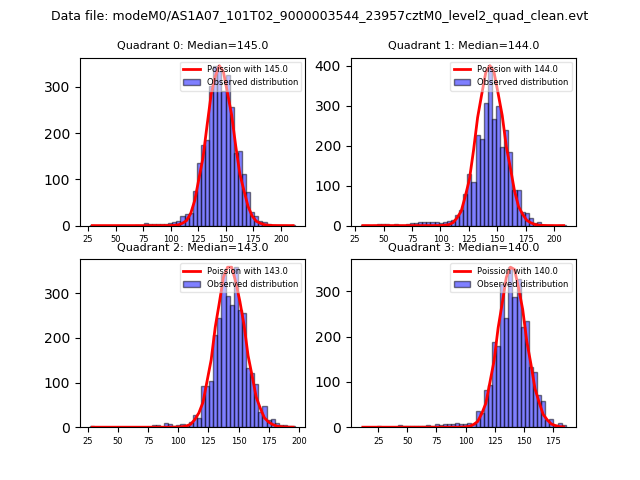 |
 |
| Quadrant-wise count rates Data is divided into 100 sec bins |
 |
|
| Module-wise count rates for Quadrant A Data is divided into 100 sec bins |
 |
 |
| Module-wise count rates for Quadrant B Data is divided into 100 sec bins |
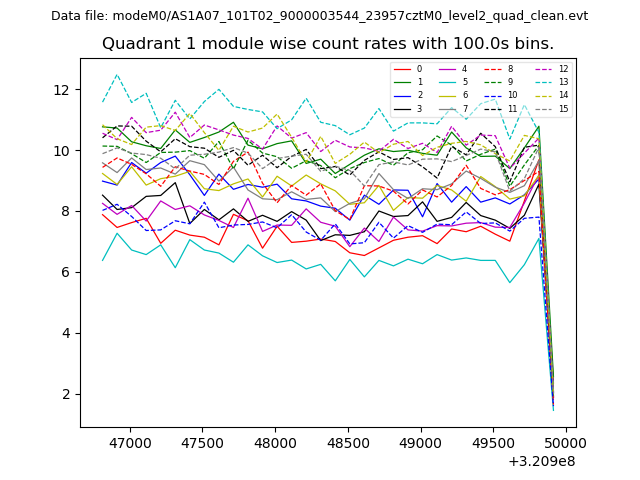 |
 |
| Module-wise count rates for Quadrant C Data is divided into 100 sec bins |
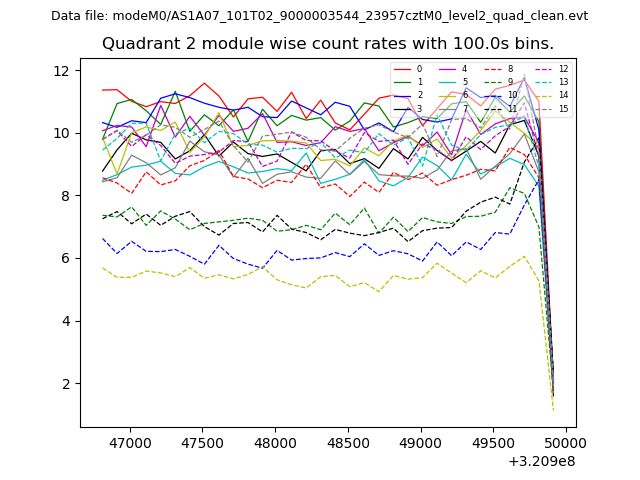 |
 |
| Module-wise count rates for Quadrant D Data is divided into 100 sec bins |
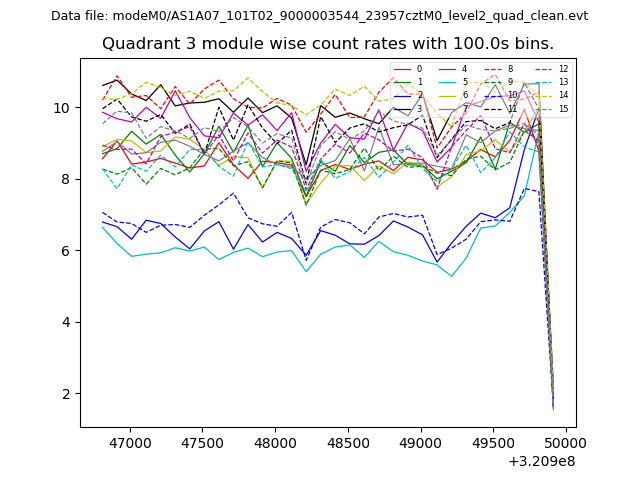 |
 |
| Parameter | Plot |
|---|---|
| CZT HV Monitor | 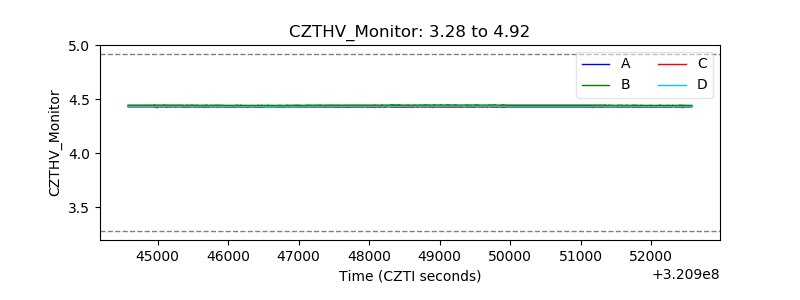 |
| D_VDD | 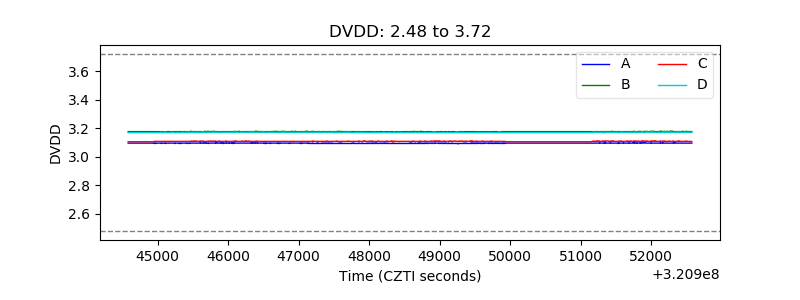 |
| Temperature 1 | 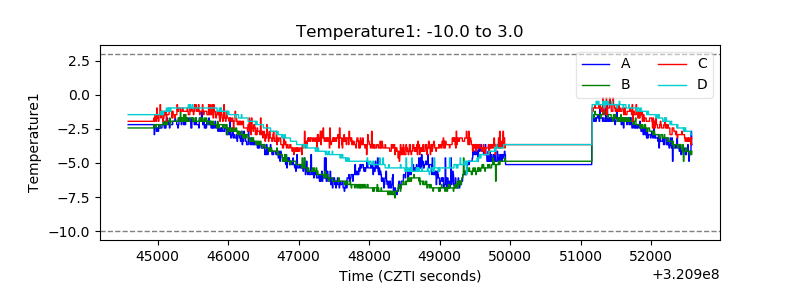 |
| Veto HV Monitor |  |
| Veto LLD | 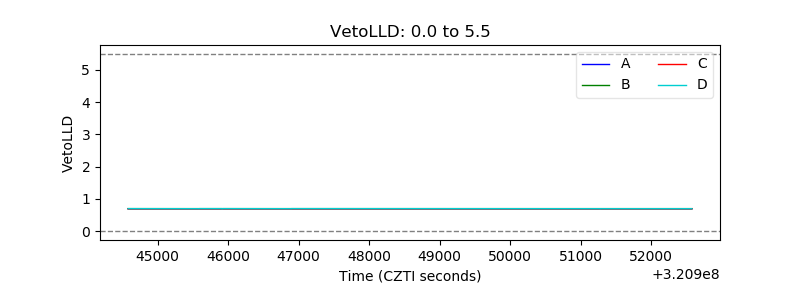 |
| Alpha Counter | 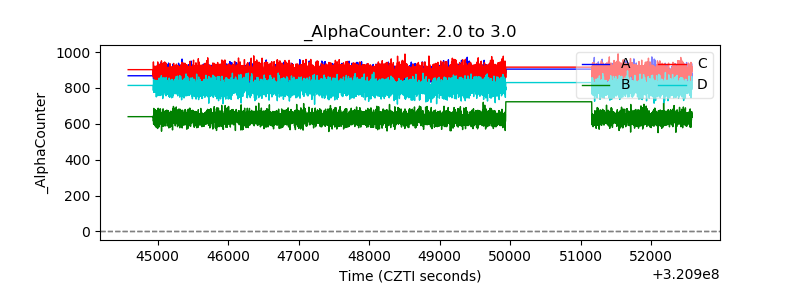 |
| _CPM_Rate | 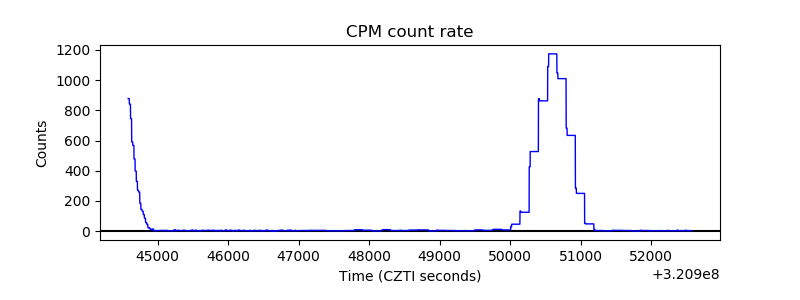 |
| CZT Counter | 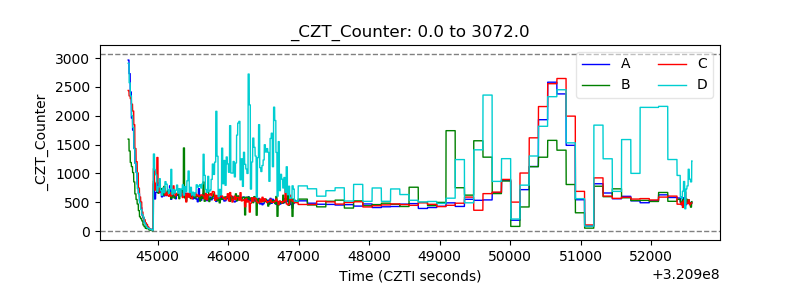 |
| +2.5 Volts monitor | 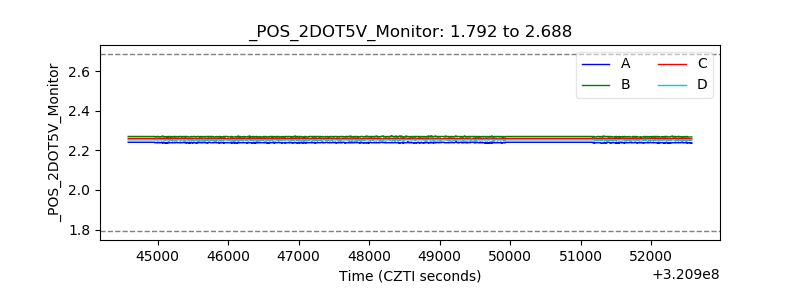 |
| +5 Volts monitor | 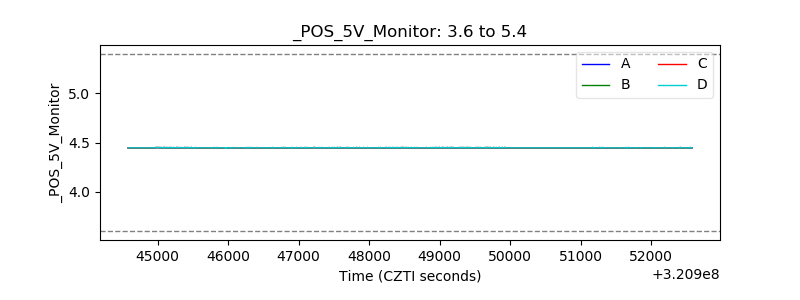 |
| _ROLL_ROT | 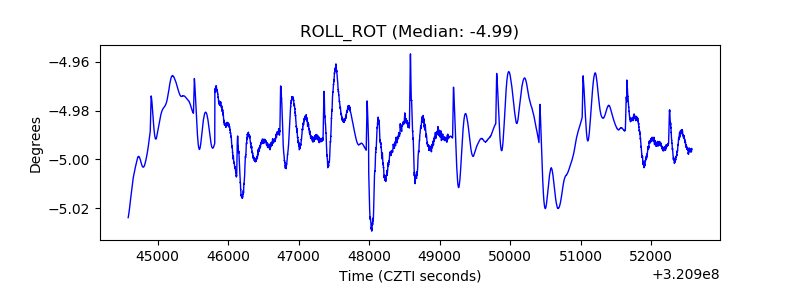 |
| _Roll_DEC | 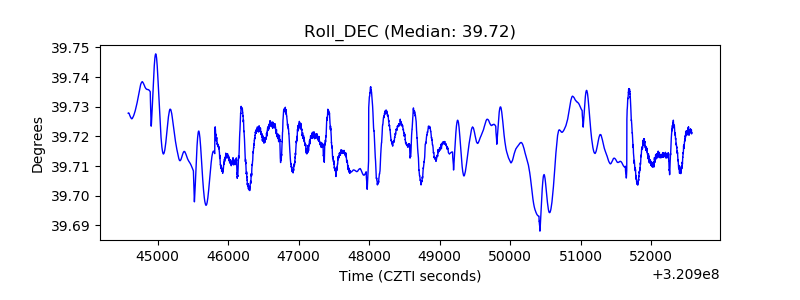 |
| _Roll_RA | 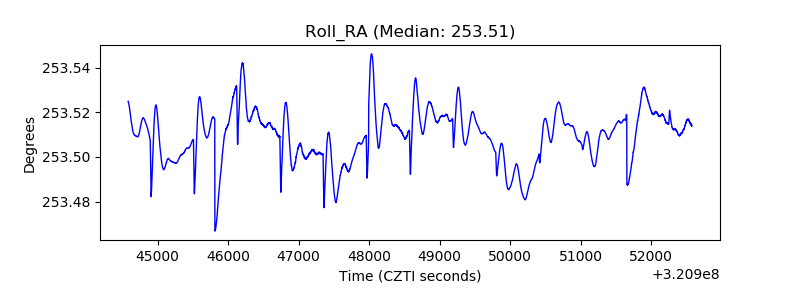 |
| Veto Counter |  |