| Param | Original file | Final file |
|---|---|---|
| Filename | modeM0/AS1A07_101T02_9000003544_23959cztM0_level2.evt | modeM0/AS1A07_101T02_9000003544_23959cztM0_level2_quad_clean.evt |
| Size (bytes) | 689,137,920 | 91,828,800 |
| Size | 657.2 MB | 87.6 MB |
| Events in quadrant A | 3,483,594 | 596,329 |
| Events in quadrant B | 3,616,534 | 603,335 |
| Events in quadrant C | 3,601,265 | 584,681 |
| Events in quadrant D | 9,685,585 | 499,164 |
| Mode SS | |||
|---|---|---|---|
| Quadrant | BADHDUFLAG | Total packets | Discarded packets |
| A | 0 | 148 | 0 |
| B | 0 | 148 | 0 |
| C | 0 | 148 | 0 |
| D | 0 | 148 | 0 |
| Mode M0 | |||
|---|---|---|---|
| Quadrant | BADHDUFLAG | Total packets | Discarded packets |
| A | 0 | 14909 | 2 |
| B | 0 | 15250 | 2 |
| C | 0 | 15111 | 2 |
| D | 0 | 33602 | 2 |
| Mode M9 | |||
|---|---|---|---|
| Quadrant | BADHDUFLAG | Total packets | Discarded packets |
| A | 0 | 14 | 0 |
| B | 0 | 14 | 0 |
| C | 0 | 14 | 0 |
| D | 0 | 14 | 0 |
| Quadrant | Total seconds | Saturated seconds | Saturation percentage |
|---|---|---|---|
| A | 7129 | 117 | 1.641184% |
| B | 7130 | 171 | 2.398317% |
| C | 7129 | 237 | 3.324449% |
| D | 7129 | 2484 | 34.843597% |
Noise dominated data is calculated using 1-second bins in cleaned event files. If a bin has >2000 counts, and if more than 50% of those come from <1% of pixels, then it is considered to be noise-dominated and hence unusable.
| Quadrant | # 1 sec bins | Bins with >0 counts | Bins with >2000 counts | High rate bins dominated by noise | Noise dominated (total time) | Noise dominated (detector-on time) | Marked lightcurve |
|---|---|---|---|---|---|---|---|
| A | 8639 | 7131 | 0 | 0 | 0.00% | 0.00% | 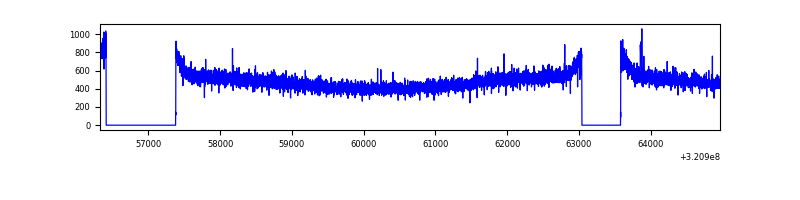 |
| B | 8640 | 7132 | 5 | 5 | 0.06% | 0.07% | 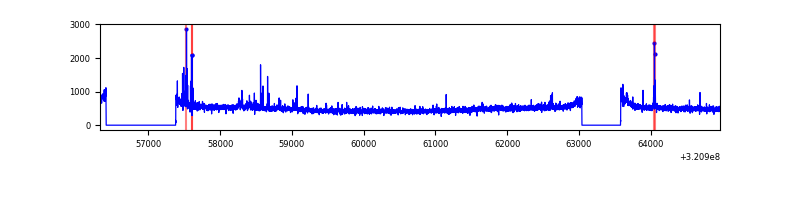 |
| C | 8639 | 7131 | 10 | 10 | 0.12% | 0.14% | 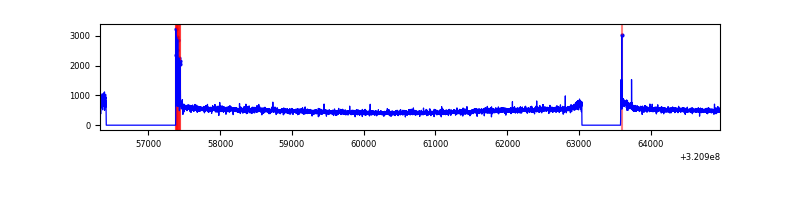 |
| D | 8639 | 7131 | 1838 | 1838 | 21.28% | 25.77% | 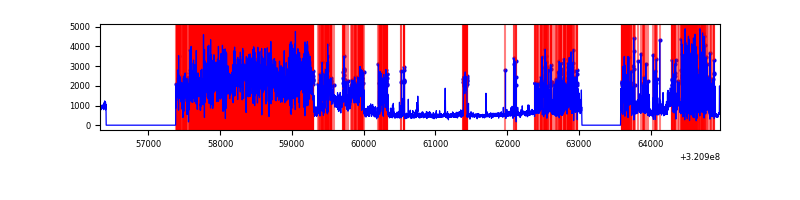 |
Top three noisy pixels from each quadrant. If the there are fewer than three noisy pixels in the level2.evt file, extra rows are filled as -1
| Pixel properties | Quadrant properties | ||||||
|---|---|---|---|---|---|---|---|
| Quadrant | DetID | PixID | Counts | Sigma | Mean | Median | Sigma |
| A | 13 | 254 | 11283 | 57.95 | 901 | 880 | 179.5 |
| A | 4 | 2 | 8156 | 40.53 | 901 | 880 | 179.5 |
| A | 3 | 137 | 8057 | 39.98 | 901 | 880 | 179.5 |
| B | 3 | 64 | 71592 | 414.65 | 896 | 874 | 170.5 |
| B | 12 | 111 | 20340 | 114.14 | 896 | 874 | 170.5 |
| B | 11 | 111 | 17969 | 100.23 | 896 | 874 | 170.5 |
| C | 14 | 238 | 137726 | 682.17 | 865 | 871 | 200.6 |
| C | 0 | 10 | 69497 | 342.07 | 865 | 871 | 200.6 |
| C | 0 | 239 | 14695 | 68.91 | 865 | 871 | 200.6 |
| D | 12 | 218 | 5588875 | 31566.23 | 729 | 708 | 177.0 |
| D | 8 | 195 | 673144 | 3798.43 | 729 | 708 | 177.0 |
| D | 12 | 250 | 321355 | 1811.26 | 729 | 708 | 177.0 |
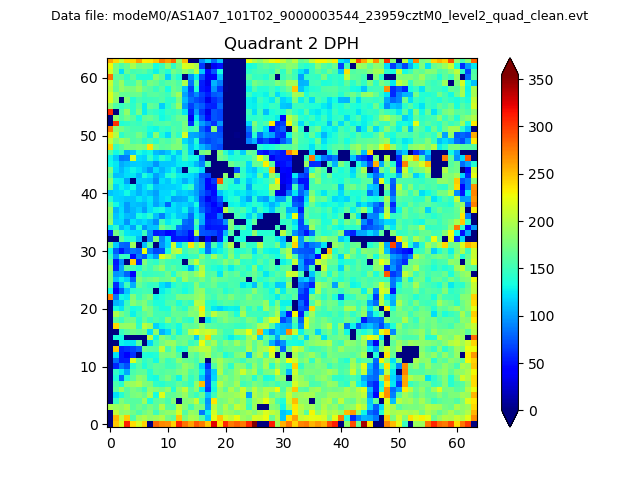
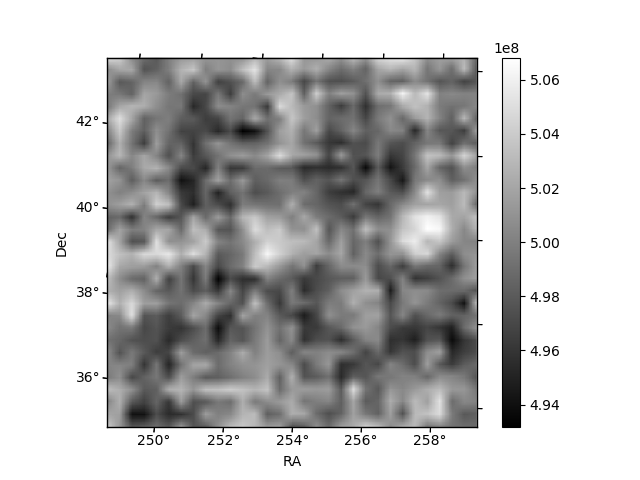
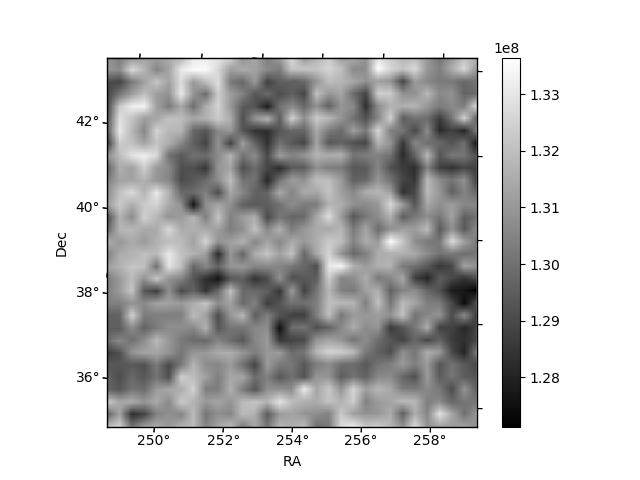
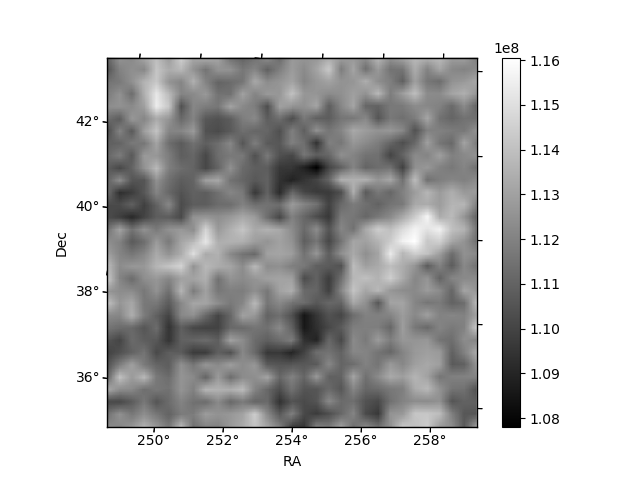
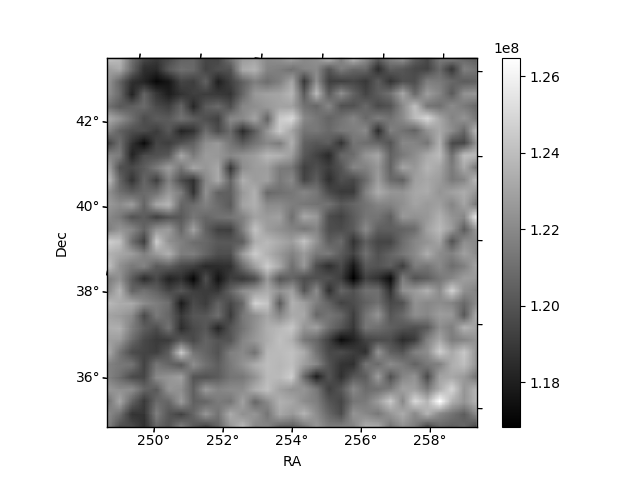
Histogram calculated using DETX and DETY for each event in the final _common_clean file
| Quadrant A | 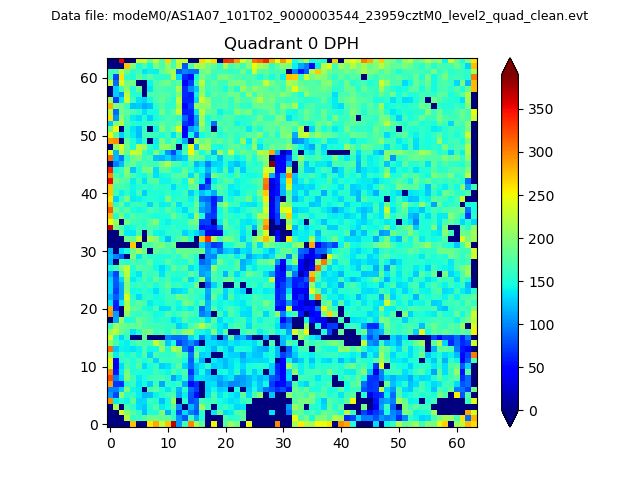 |
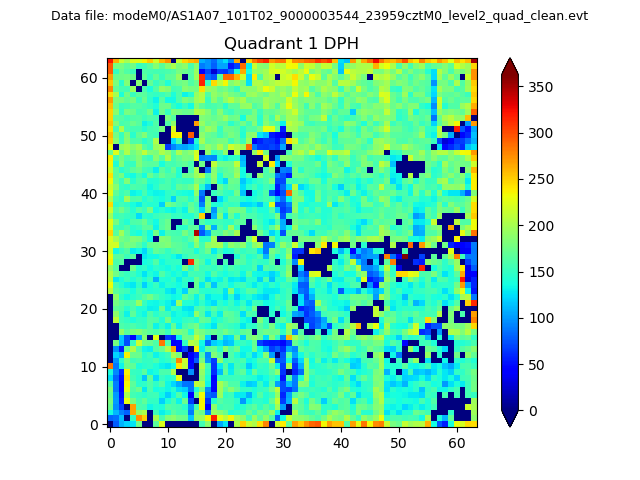 |
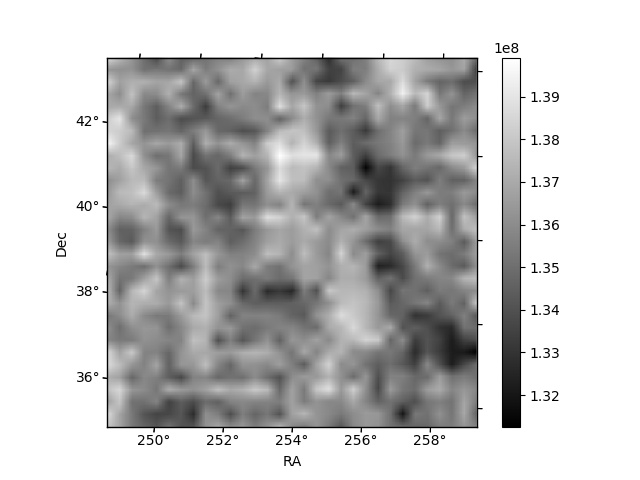
Quadrant B |
|---|---|---|---|
| Quadrant D | 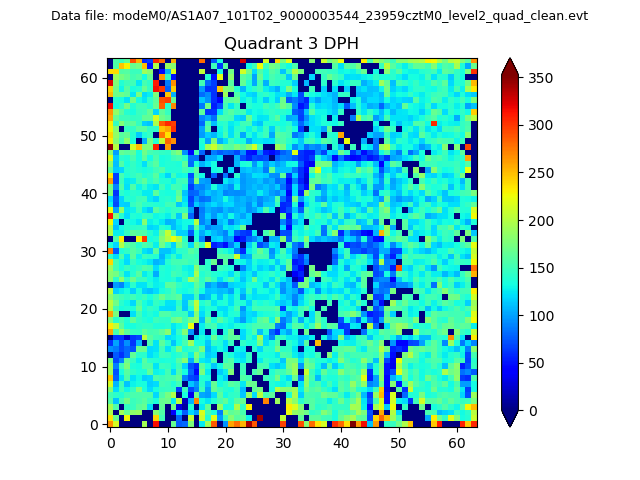 |
 |
Quadrant C |
| Plot type | Count rate plots | Images |
|---|---|---|
| Comparison with Poisson distribution Blue bars denote a histogram of data divided into 1 sec bins. Red curve is a Poisson curve with rate = median count rate of data. |
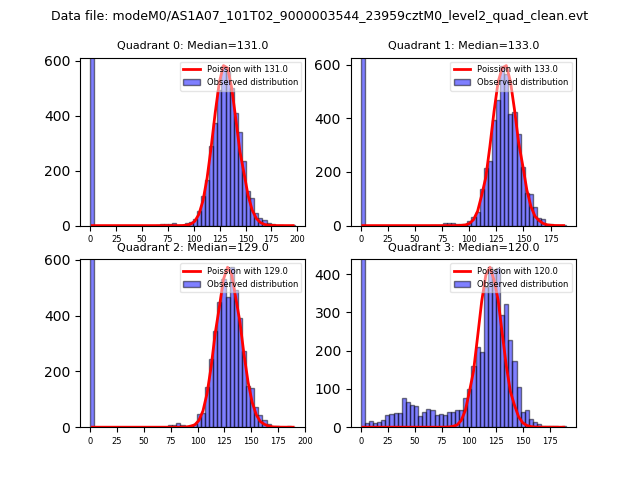 |
 |
| Quadrant-wise count rates Data is divided into 100 sec bins |
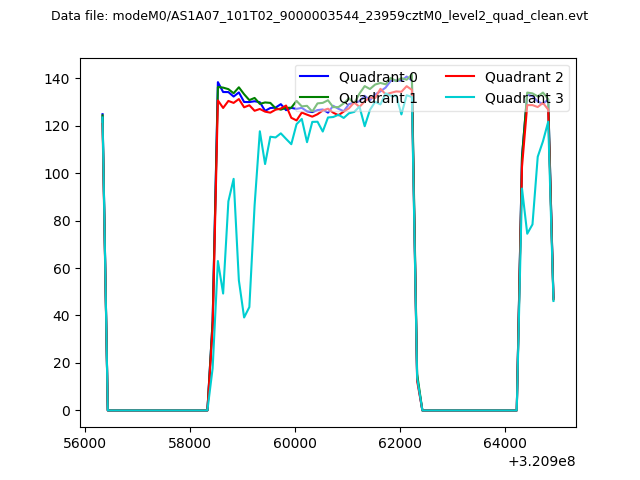 |
|
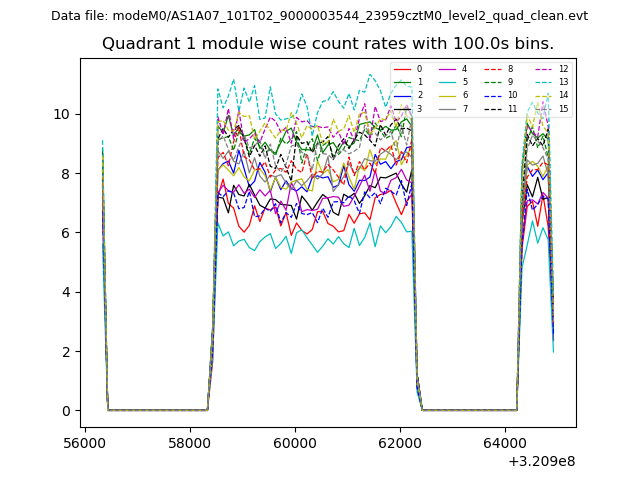
| Module-wise count rates for Quadrant A Data is divided into 100 sec bins |
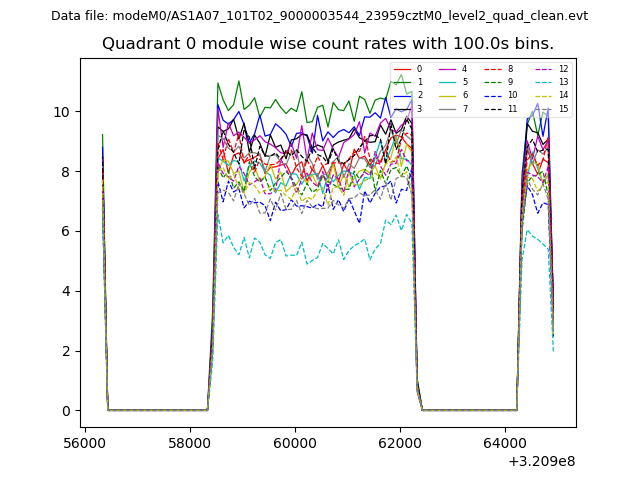 |
 |
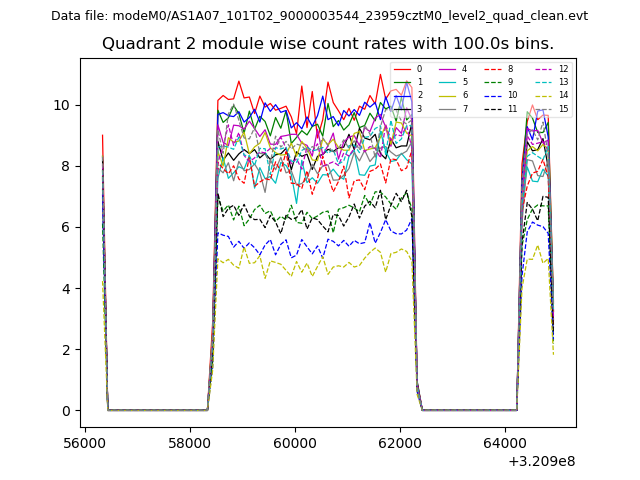
| Module-wise count rates for Quadrant B Data is divided into 100 sec bins |
 |
 |
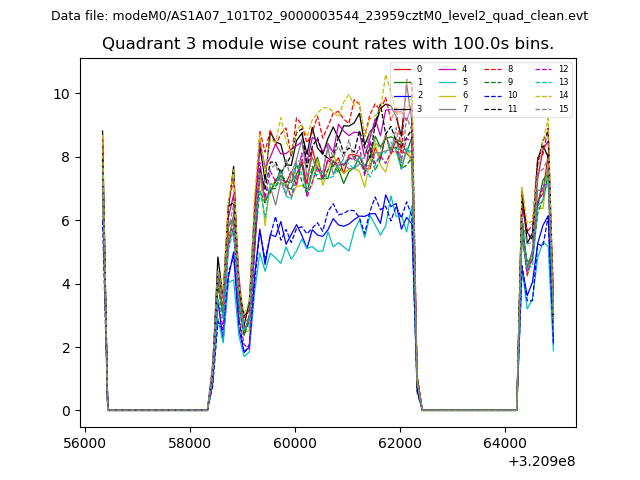
| Module-wise count rates for Quadrant C Data is divided into 100 sec bins |
 |
 |
| Module-wise count rates for Quadrant D Data is divided into 100 sec bins |
 |
 |
| Parameter | Plot |
|---|---|
| CZT HV Monitor |  |
| D_VDD | 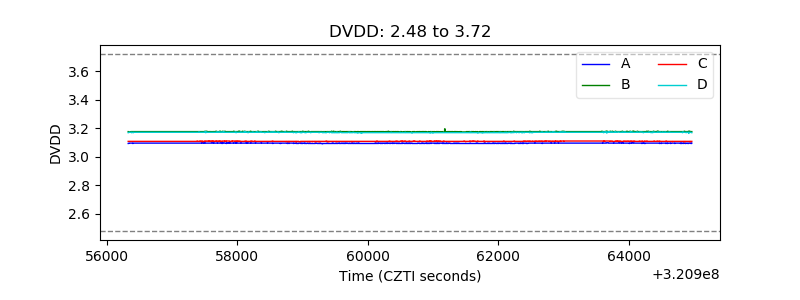 |
| Temperature 1 | 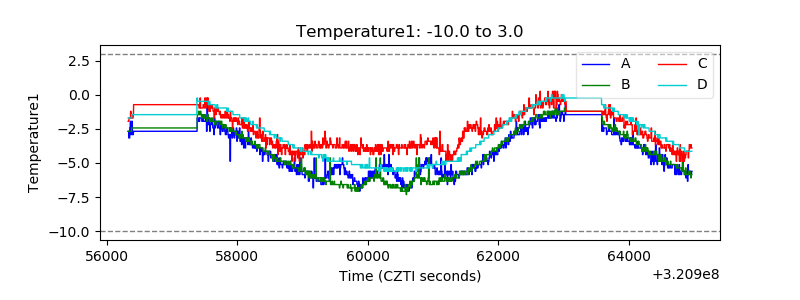 |
| Veto HV Monitor | 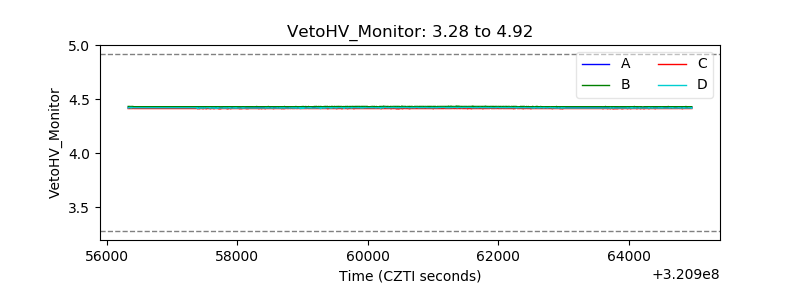 |
| Veto LLD | 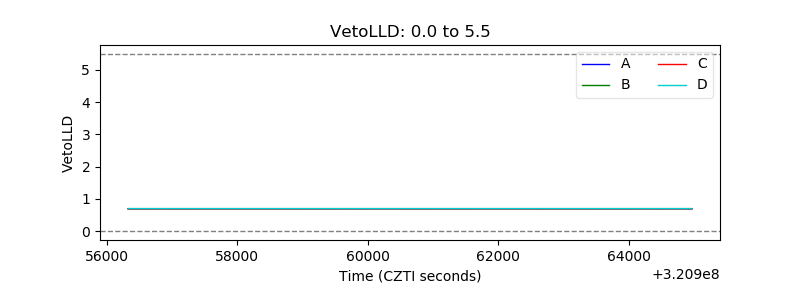 |
| Alpha Counter | 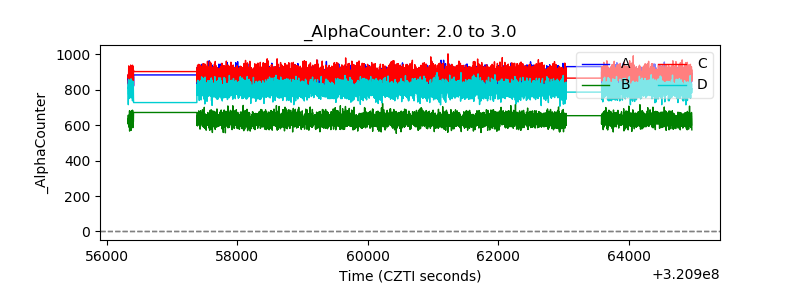 |
| _CPM_Rate | 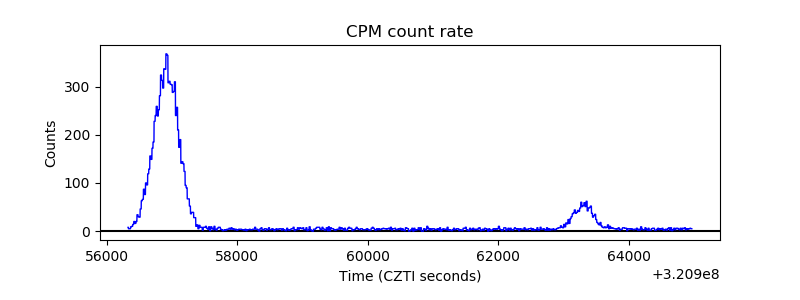 |
| CZT Counter | 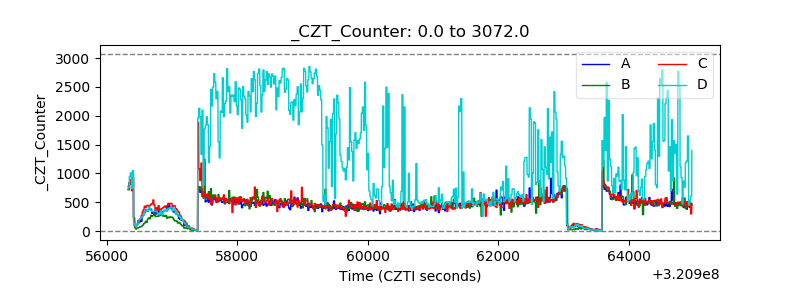 |
| +2.5 Volts monitor |  |
| +5 Volts monitor |  |
| _ROLL_ROT | 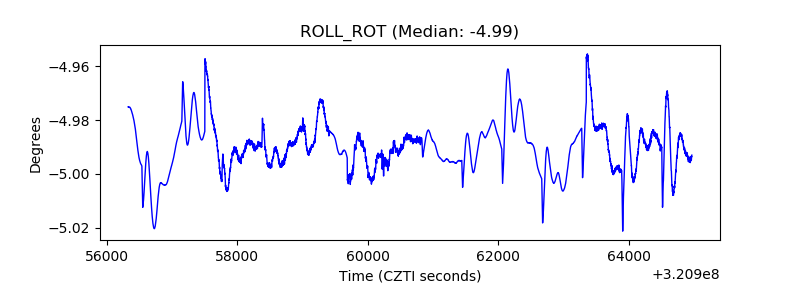 |
| _Roll_DEC | 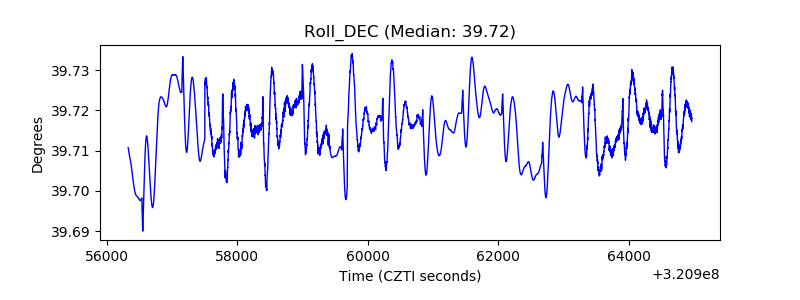 |
| _Roll_RA | 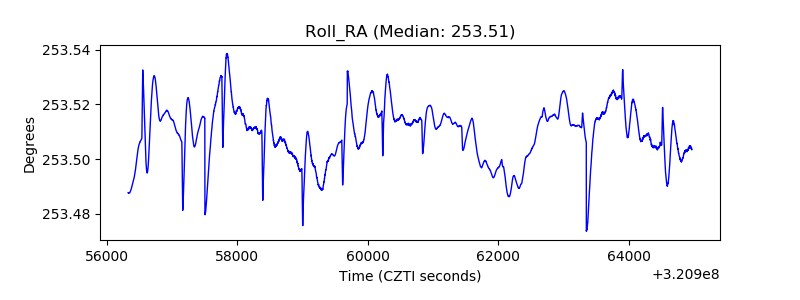 |
| Veto Counter | 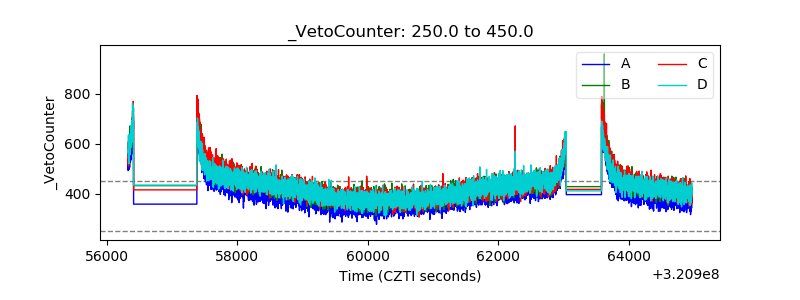 |