| Param | Original file | Final file |
|---|---|---|
| Filename | modeM0/AS1A07_101T02_9000003544_23960cztM0_level2.evt | modeM0/AS1A07_101T02_9000003544_23960cztM0_level2_quad_clean.evt |
| Size (bytes) | 641,338,560 | 99,601,920 |
| Size | 611.6 MB | 95.0 MB |
| Events in quadrant A | 3,735,262 | 631,035 |
| Events in quadrant B | 5,255,072 | 627,889 |
| Events in quadrant C | 3,899,742 | 624,634 |
| Events in quadrant D | 6,007,251 | 593,114 |
| Mode SS | |||
|---|---|---|---|
| Quadrant | BADHDUFLAG | Total packets | Discarded packets |
| A | 0 | 160 | 0 |
| B | 0 | 160 | 0 |
| C | 0 | 160 | 0 |
| D | 0 | 160 | 0 |
| Mode M0 | |||
|---|---|---|---|
| Quadrant | BADHDUFLAG | Total packets | Discarded packets |
| A | 0 | 16176 | 2 |
| B | 0 | 20655 | 2 |
| C | 0 | 16475 | 2 |
| D | 0 | 23224 | 2 |
| Mode M9 | |||
|---|---|---|---|
| Quadrant | BADHDUFLAG | Total packets | Discarded packets |
| A | 0 | 8 | 0 |
| B | 0 | 8 | 0 |
| C | 0 | 8 | 0 |
| D | 0 | 8 | 0 |
| Quadrant | Total seconds | Saturated seconds | Saturation percentage |
|---|---|---|---|
| A | 7754 | 88 | 1.134898% |
| B | 7755 | 407 | 5.248227% |
| C | 7755 | 227 | 2.927144% |
| D | 7755 | 768 | 9.903288% |
Noise dominated data is calculated using 1-second bins in cleaned event files. If a bin has >2000 counts, and if more than 50% of those come from <1% of pixels, then it is considered to be noise-dominated and hence unusable.
| Quadrant | # 1 sec bins | Bins with >0 counts | Bins with >2000 counts | High rate bins dominated by noise | Noise dominated (total time) | Noise dominated (detector-on time) | Marked lightcurve |
|---|---|---|---|---|---|---|---|
| A | 8634 | 7756 | 0 | 0 | 0.00% | 0.00% | 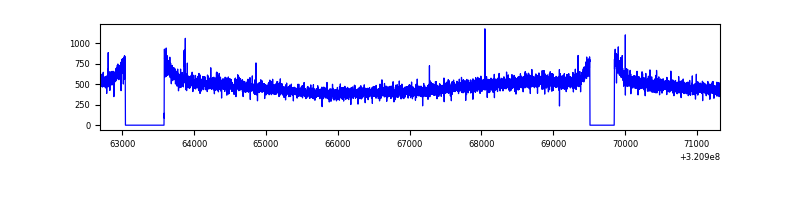 |
| B | 8635 | 7757 | 219 | 219 | 2.54% | 2.82% | 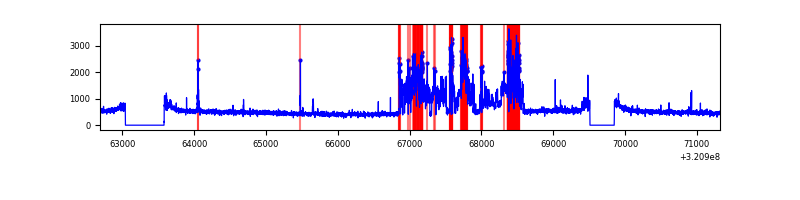 |
| C | 8635 | 7757 | 10 | 10 | 0.12% | 0.13% | 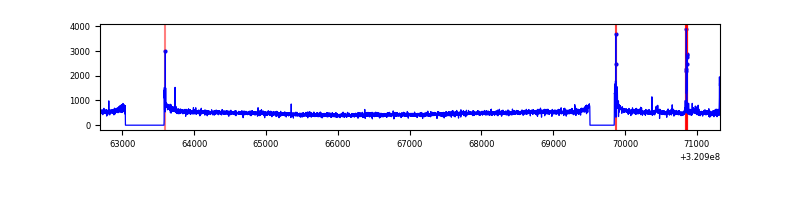 |
| D | 8635 | 7757 | 419 | 419 | 4.85% | 5.40% | 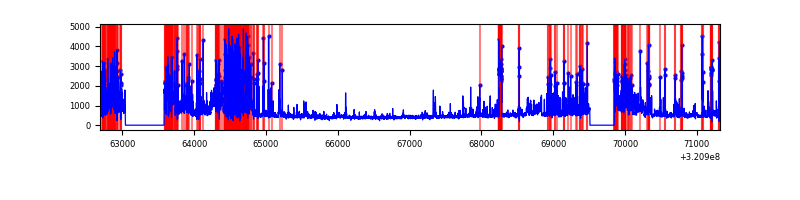 |
Top three noisy pixels from each quadrant. If the there are fewer than three noisy pixels in the level2.evt file, extra rows are filled as -1
| Pixel properties | Quadrant properties | ||||||
|---|---|---|---|---|---|---|---|
| Quadrant | DetID | PixID | Counts | Sigma | Mean | Median | Sigma |
| A | 13 | 254 | 12568 | 59.63 | 967 | 946 | 194.9 |
| A | 3 | 137 | 8715 | 39.86 | 967 | 946 | 194.9 |
| A | 4 | 2 | 8322 | 37.84 | 967 | 946 | 194.9 |
| B | 3 | 64 | 1459678 | 8005.58 | 952 | 927 | 182.2 |
| B | 12 | 111 | 21749 | 114.27 | 952 | 927 | 182.2 |
| B | 4 | 52 | 19852 | 103.86 | 952 | 927 | 182.2 |
| C | 14 | 238 | 148704 | 683.36 | 928 | 932 | 216.2 |
| C | 0 | 10 | 93014 | 425.83 | 928 | 932 | 216.2 |
| C | 0 | 239 | 21766 | 96.35 | 928 | 932 | 216.2 |
| D | 12 | 218 | 2023953 | 9192.15 | 901 | 870 | 220.1 |
| D | 8 | 195 | 239887 | 1086.0 | 901 | 870 | 220.1 |
| D | 2 | 82 | 156796 | 708.47 | 901 | 870 | 220.1 |
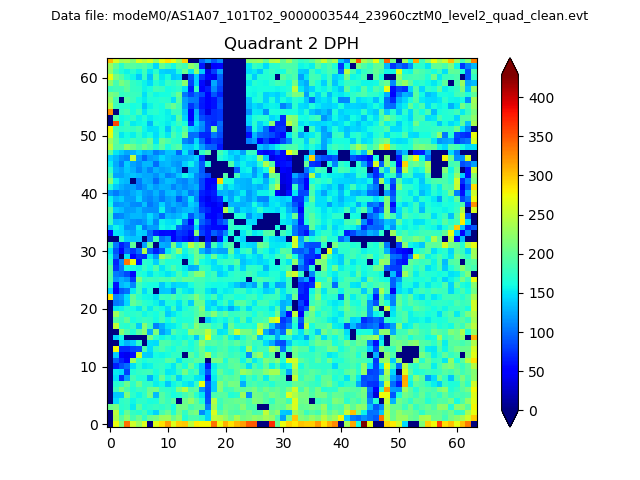
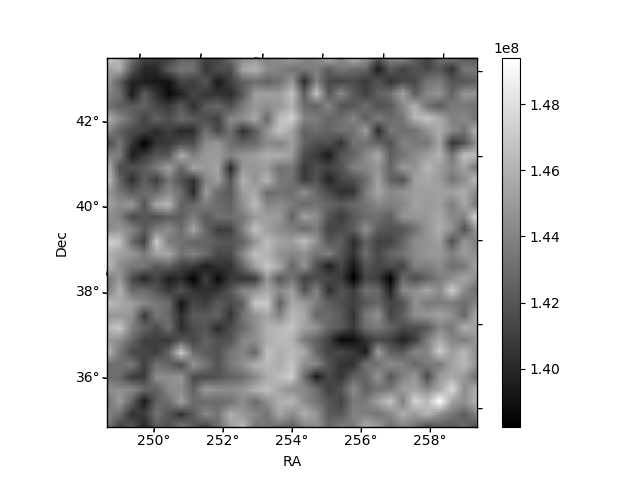
Histogram calculated using DETX and DETY for each event in the final _common_clean file
| Quadrant A | 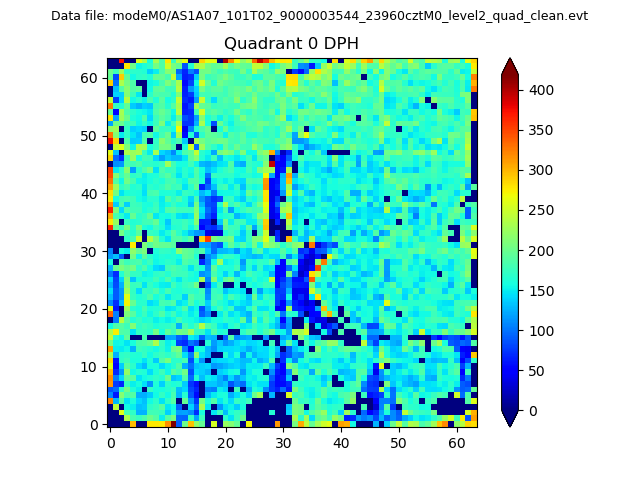 |
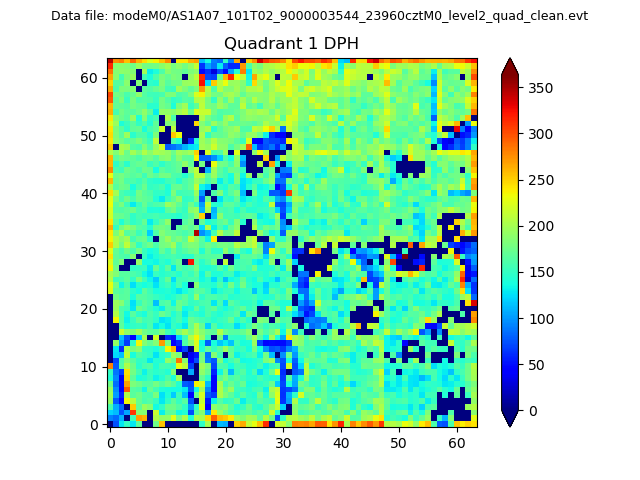 |
Quadrant B |
|---|---|---|---|
| Quadrant D | 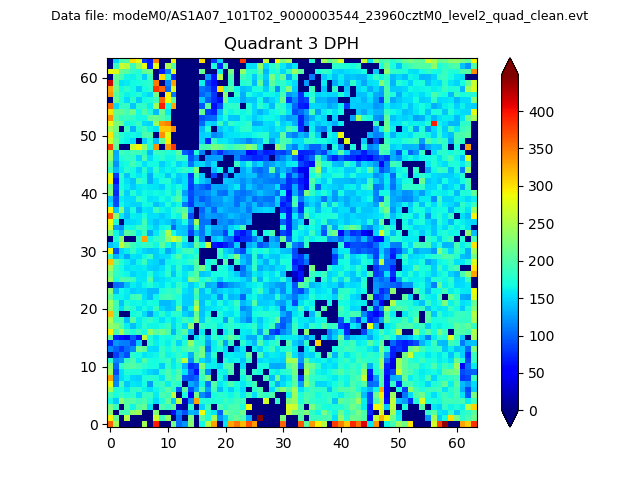 |
 |
Quadrant C |
| Plot type | Count rate plots | Images |
|---|---|---|
| Comparison with Poisson distribution Blue bars denote a histogram of data divided into 1 sec bins. Red curve is a Poisson curve with rate = median count rate of data. |
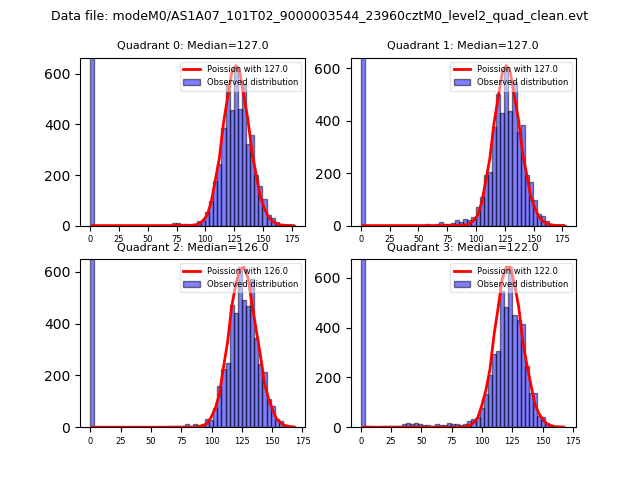 |
 |
| Quadrant-wise count rates Data is divided into 100 sec bins |
 |
|
| Module-wise count rates for Quadrant A Data is divided into 100 sec bins |
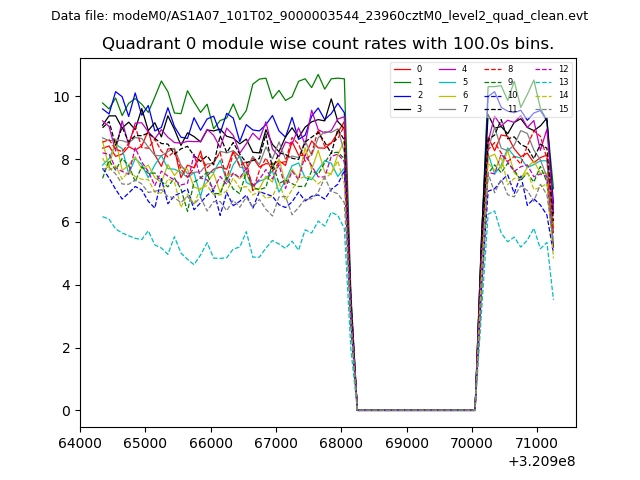 |
 |
| Module-wise count rates for Quadrant B Data is divided into 100 sec bins |
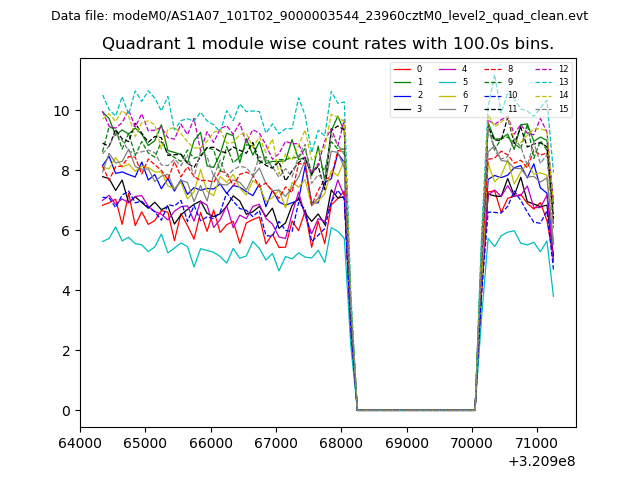 |
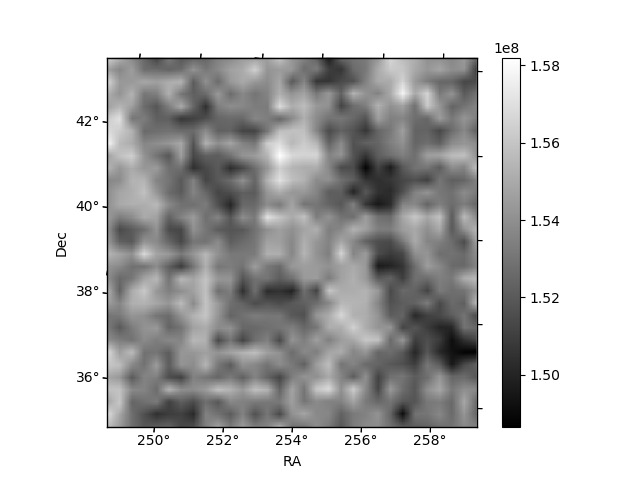 |
| Module-wise count rates for Quadrant C Data is divided into 100 sec bins |
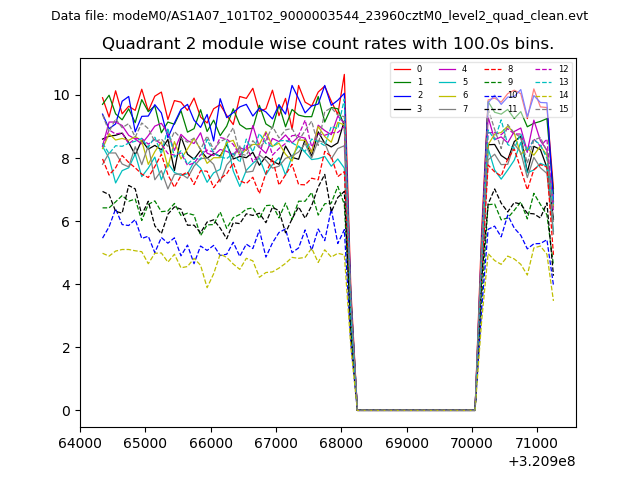 |
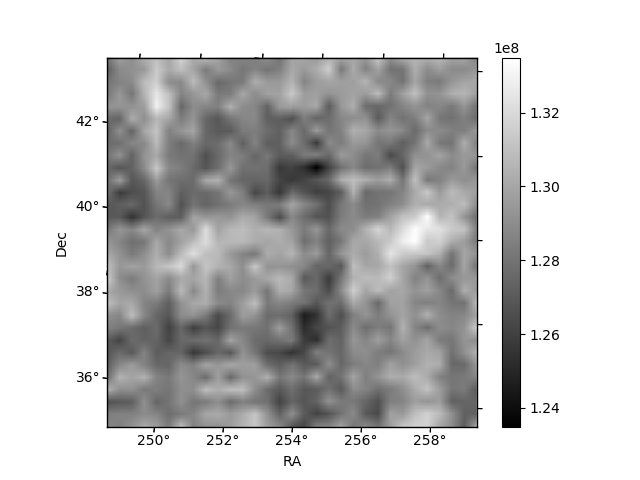 |
| Module-wise count rates for Quadrant D Data is divided into 100 sec bins |
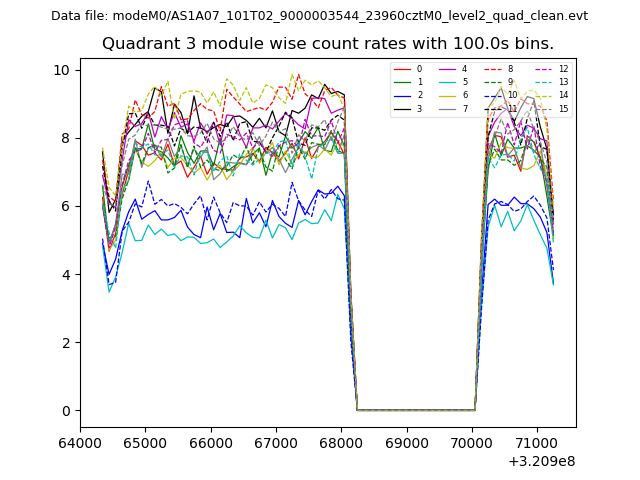 |
 |
| Parameter | Plot |
|---|---|
| CZT HV Monitor | 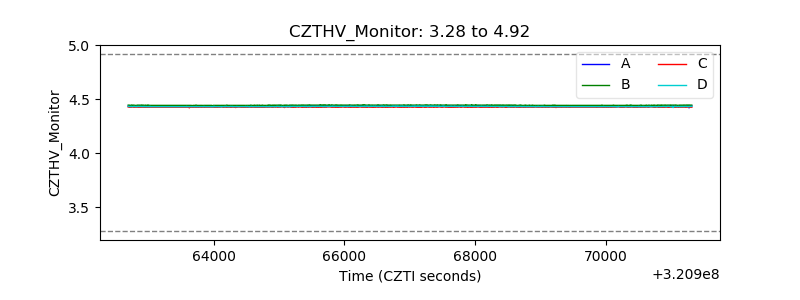 |
| D_VDD | 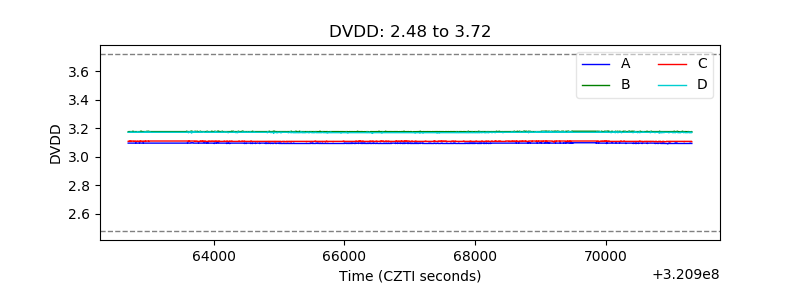 |
| Temperature 1 | 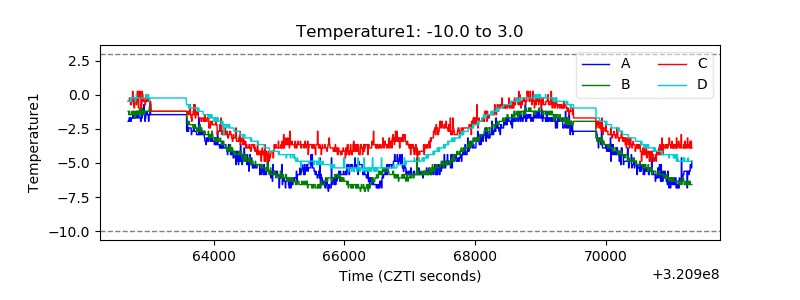 |
| Veto HV Monitor | 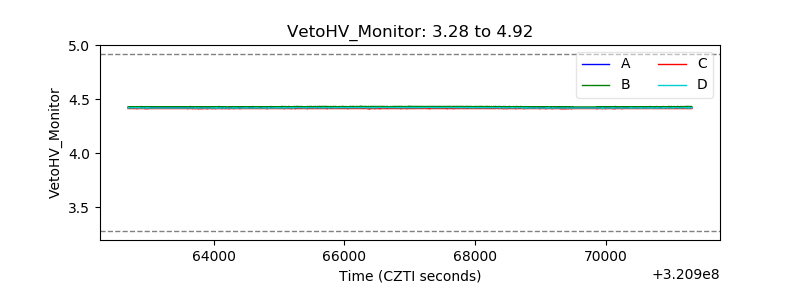 |
| Veto LLD | 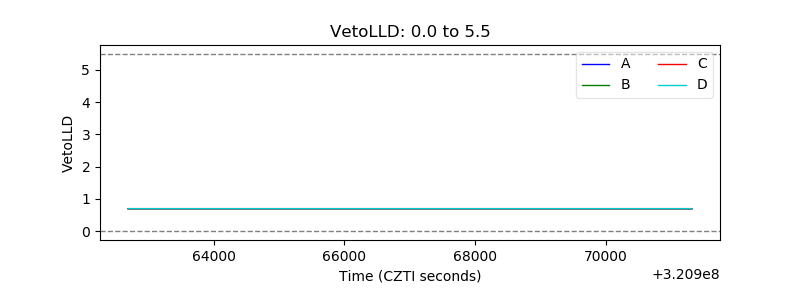 |
| Alpha Counter |  |
| _CPM_Rate | 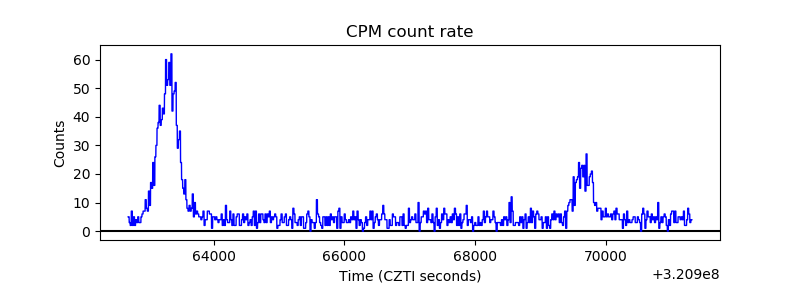 |
| CZT Counter | 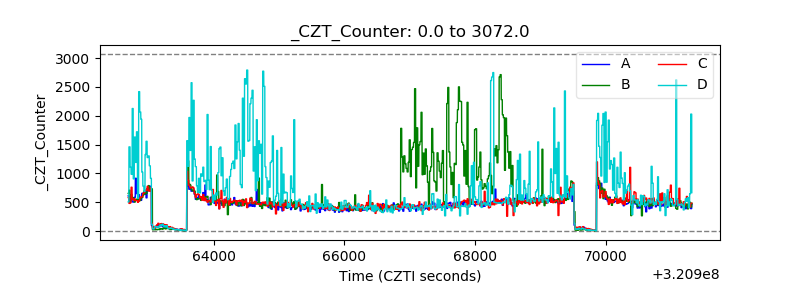 |
| +2.5 Volts monitor |  |
| +5 Volts monitor |  |
| _ROLL_ROT | 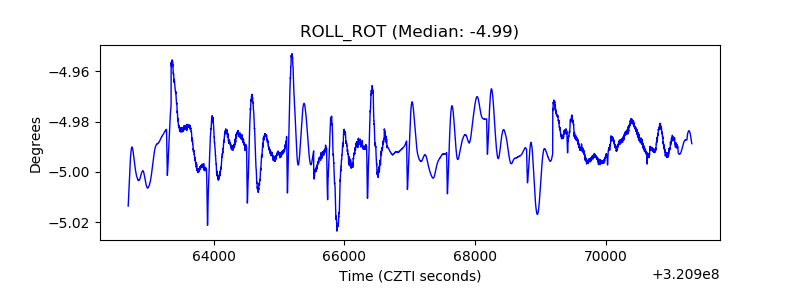 |
| _Roll_DEC | 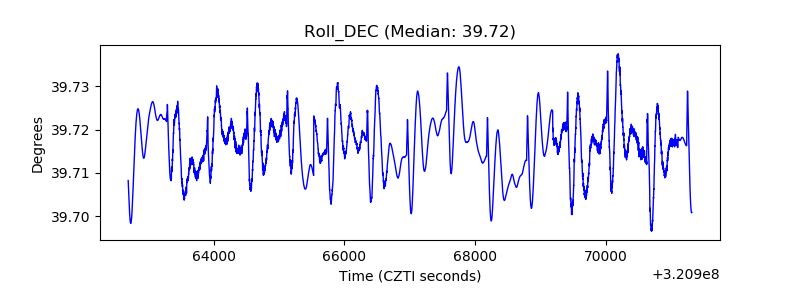 |
| _Roll_RA | 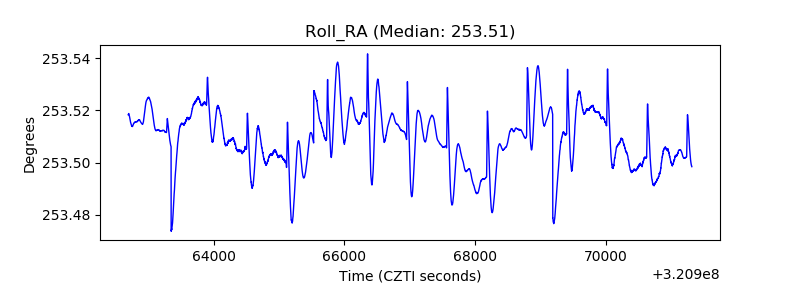 |
| Veto Counter | 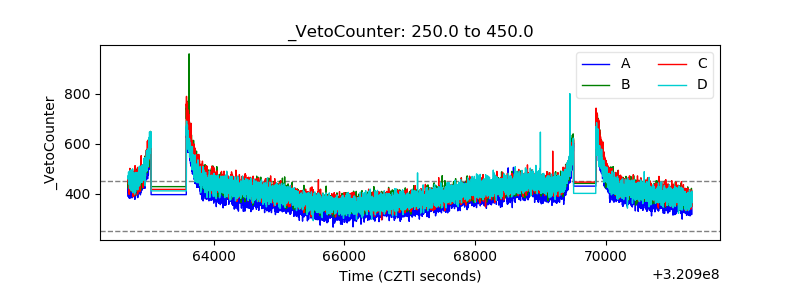 |