| Param | Original file | Final file |
|---|---|---|
| Filename | modeM0/AS1A07_101T02_9000003544_23961cztM0_level2.evt | modeM0/AS1A07_101T02_9000003544_23961cztM0_level2_quad_clean.evt |
| Size (bytes) | 629,801,280 | 106,476,480 |
| Size | 600.6 MB | 101.5 MB |
| Events in quadrant A | 3,700,639 | 685,000 |
| Events in quadrant B | 4,495,036 | 691,270 |
| Events in quadrant C | 4,264,860 | 674,434 |
| Events in quadrant D | 6,084,274 | 631,374 |
| Mode SS | |||
|---|---|---|---|
| Quadrant | BADHDUFLAG | Total packets | Discarded packets |
| A | 0 | 160 | 0 |
| B | 0 | 160 | 0 |
| C | 0 | 160 | 0 |
| D | 0 | 160 | 0 |
| Mode M0 | |||
|---|---|---|---|
| Quadrant | BADHDUFLAG | Total packets | Discarded packets |
| A | 0 | 16230 | 2 |
| B | 0 | 18668 | 2 |
| C | 0 | 17699 | 2 |
| D | 0 | 23520 | 2 |
| Mode M9 | |||
|---|---|---|---|
| Quadrant | BADHDUFLAG | Total packets | Discarded packets |
| A | 0 | 6 | 0 |
| B | 0 | 6 | 0 |
| C | 0 | 6 | 0 |
| D | 0 | 6 | 0 |
| Quadrant | Total seconds | Saturated seconds | Saturation percentage |
|---|---|---|---|
| A | 7802 | 50 | 0.640861% |
| B | 7803 | 266 | 3.408945% |
| C | 7803 | 256 | 3.280789% |
| D | 7803 | 709 | 9.086249% |
Noise dominated data is calculated using 1-second bins in cleaned event files. If a bin has >2000 counts, and if more than 50% of those come from <1% of pixels, then it is considered to be noise-dominated and hence unusable.
| Quadrant | # 1 sec bins | Bins with >0 counts | Bins with >2000 counts | High rate bins dominated by noise | Noise dominated (total time) | Noise dominated (detector-on time) | Marked lightcurve |
|---|---|---|---|---|---|---|---|
| A | 8467 | 7804 | 0 | 0 | 0.00% | 0.00% | 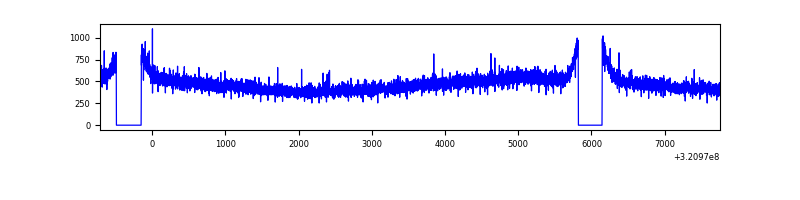 |
| B | 8468 | 7805 | 77 | 77 | 0.91% | 0.99% | 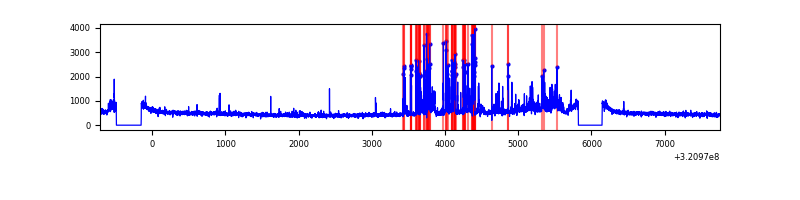 |
| C | 8468 | 7805 | 70 | 70 | 0.83% | 0.90% | 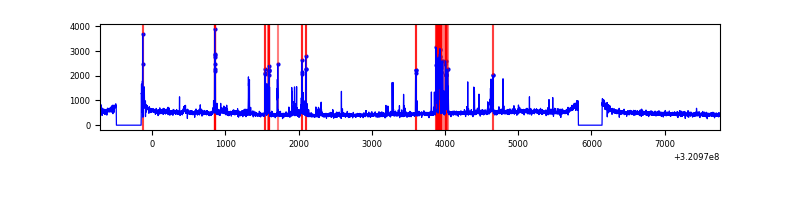 |
| D | 8468 | 7805 | 486 | 486 | 5.74% | 6.23% | 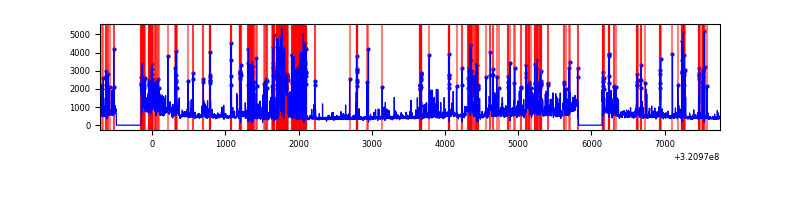 |
Top three noisy pixels from each quadrant. If the there are fewer than three noisy pixels in the level2.evt file, extra rows are filled as -1
| Pixel properties | Quadrant properties | ||||||
|---|---|---|---|---|---|---|---|
| Quadrant | DetID | PixID | Counts | Sigma | Mean | Median | Sigma |
| A | 13 | 254 | 13382 | 64.24 | 959 | 936 | 193.8 |
| A | 3 | 137 | 8740 | 40.28 | 959 | 936 | 193.8 |
| A | 0 | 226 | 8144 | 37.2 | 959 | 936 | 193.8 |
| B | 3 | 64 | 701714 | 3834.96 | 952 | 927 | 182.7 |
| B | 12 | 111 | 22429 | 117.66 | 952 | 927 | 182.7 |
| B | 15 | 33 | 19968 | 104.2 | 952 | 927 | 182.7 |
| C | 0 | 10 | 473533 | 2206.59 | 921 | 928 | 214.2 |
| C | 14 | 238 | 145575 | 675.36 | 921 | 928 | 214.2 |
| C | 7 | 221 | 30392 | 137.57 | 921 | 928 | 214.2 |
| D | 12 | 218 | 1473894 | 6762.77 | 898 | 872 | 217.8 |
| D | 1 | 52 | 582523 | 2670.41 | 898 | 872 | 217.8 |
| D | 2 | 82 | 416183 | 1906.73 | 898 | 872 | 217.8 |
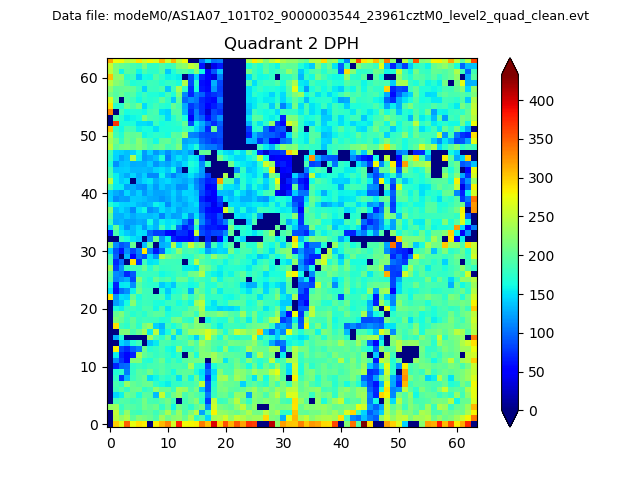
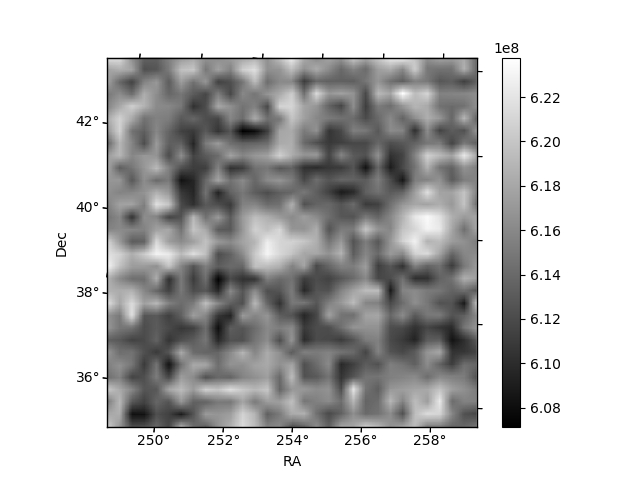
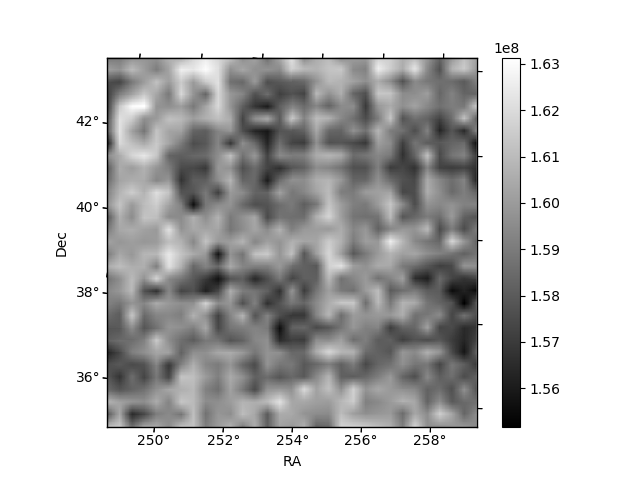
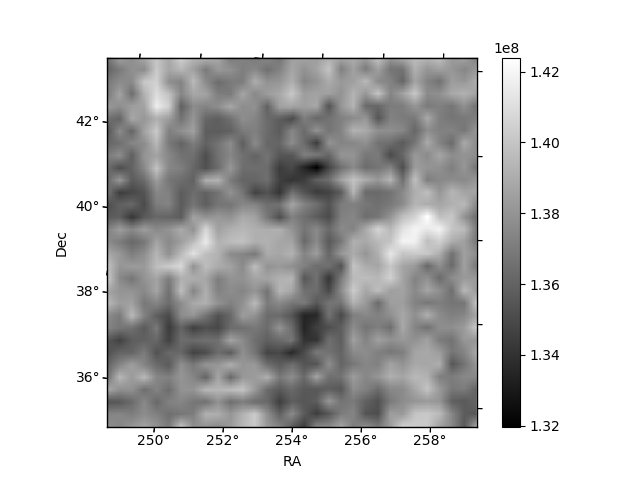
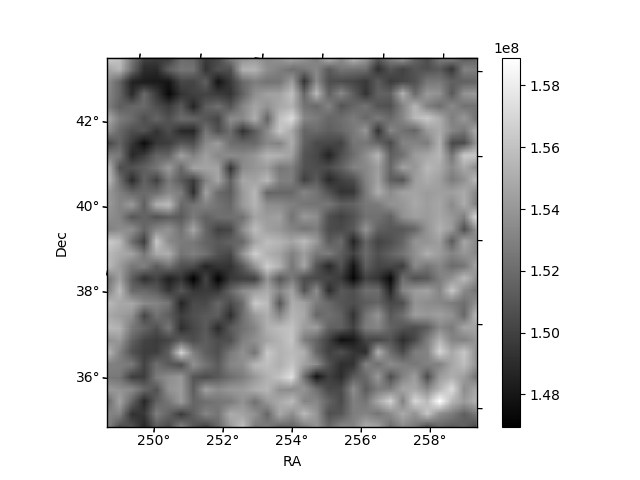
Histogram calculated using DETX and DETY for each event in the final _common_clean file
| Quadrant A | 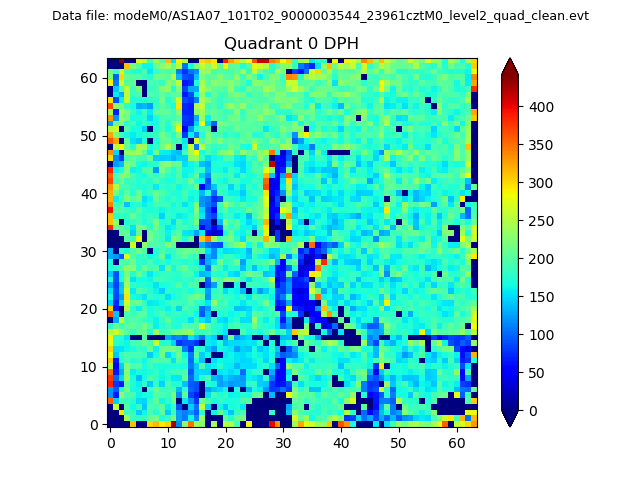 |
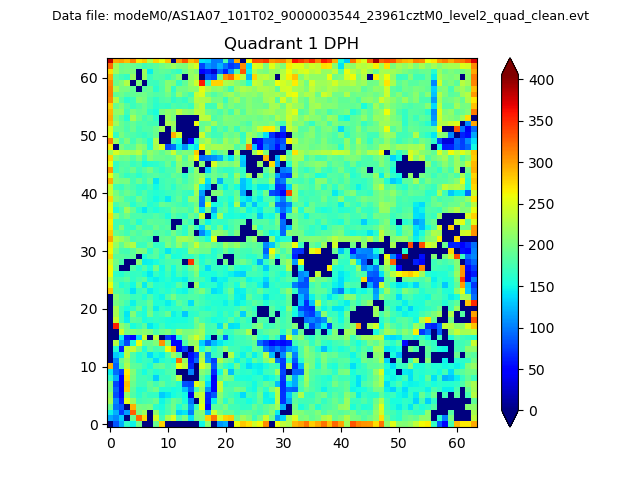 |
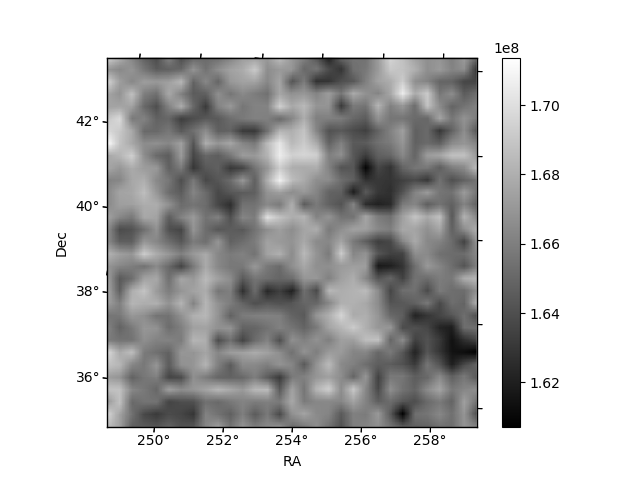
Quadrant B |
|---|---|---|---|
| Quadrant D | 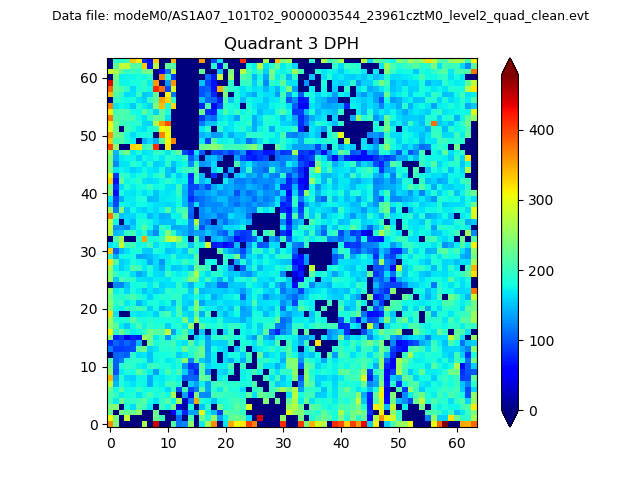 |
 |
Quadrant C |
| Plot type | Count rate plots | Images |
|---|---|---|
| Comparison with Poisson distribution Blue bars denote a histogram of data divided into 1 sec bins. Red curve is a Poisson curve with rate = median count rate of data. |
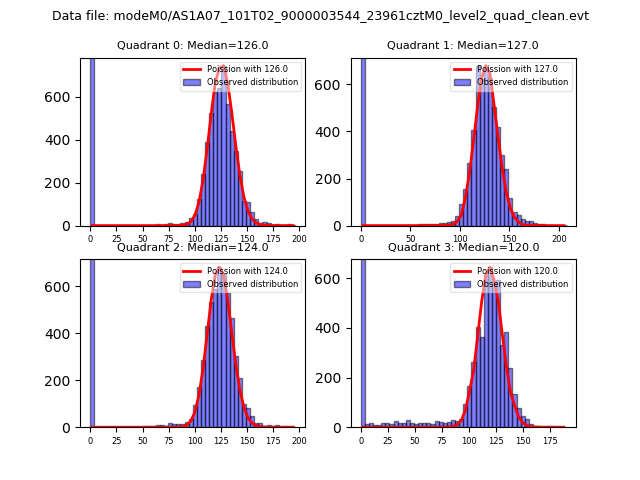 |
 |
| Quadrant-wise count rates Data is divided into 100 sec bins |
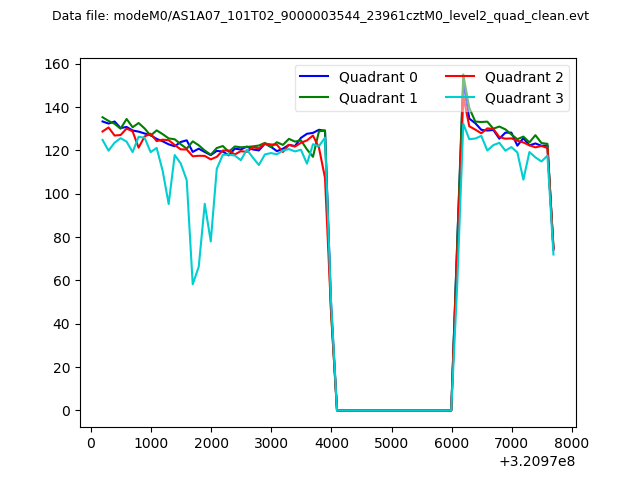 |
|
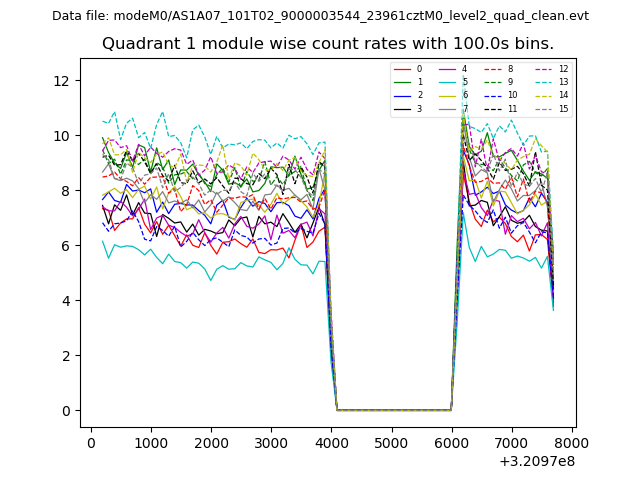
| Module-wise count rates for Quadrant A Data is divided into 100 sec bins |
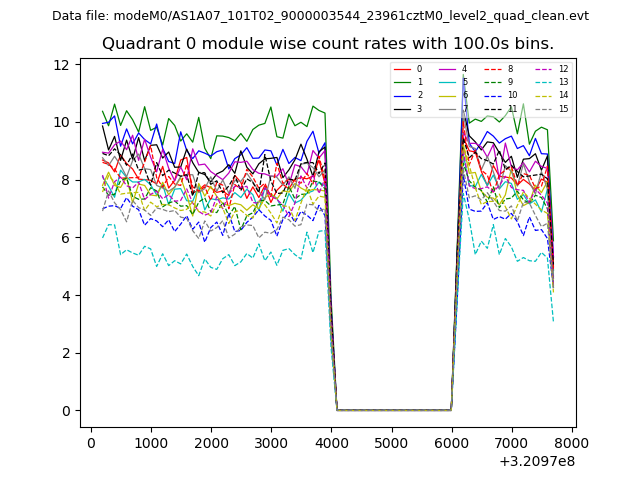 |
 |
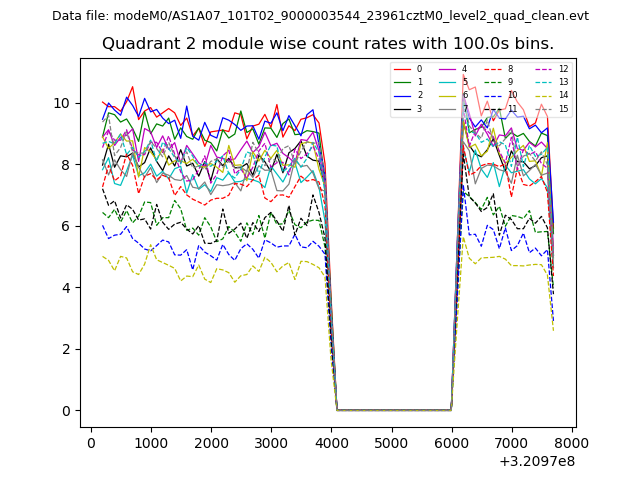
| Module-wise count rates for Quadrant B Data is divided into 100 sec bins |
 |
 |
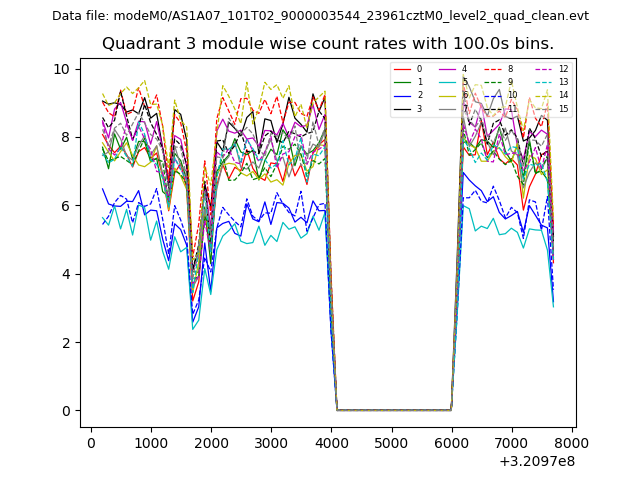
| Module-wise count rates for Quadrant C Data is divided into 100 sec bins |
 |
 |
| Module-wise count rates for Quadrant D Data is divided into 100 sec bins |
 |
 |
| Parameter | Plot |
|---|---|
| CZT HV Monitor | 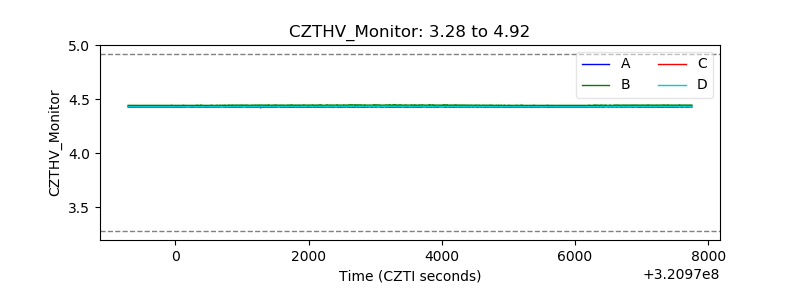 |
| D_VDD | 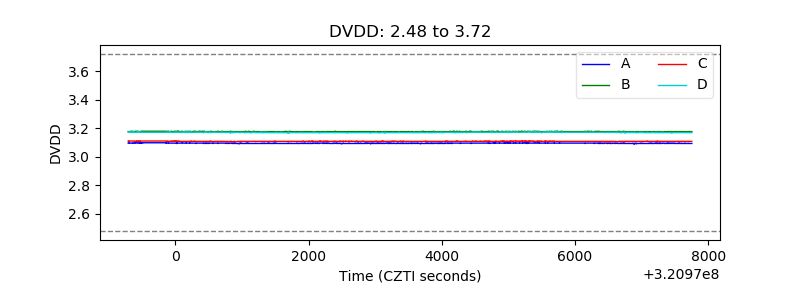 |
| Temperature 1 | 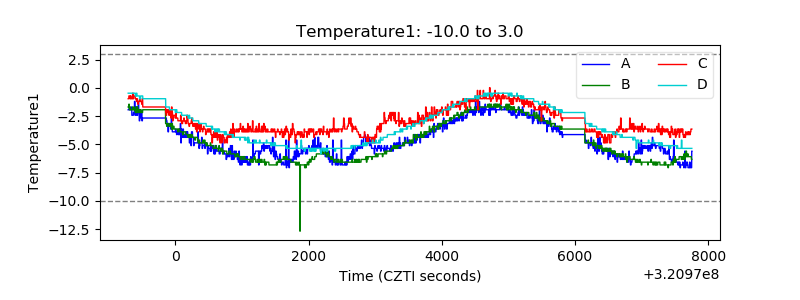 |
| Veto HV Monitor |  |
| Veto LLD | 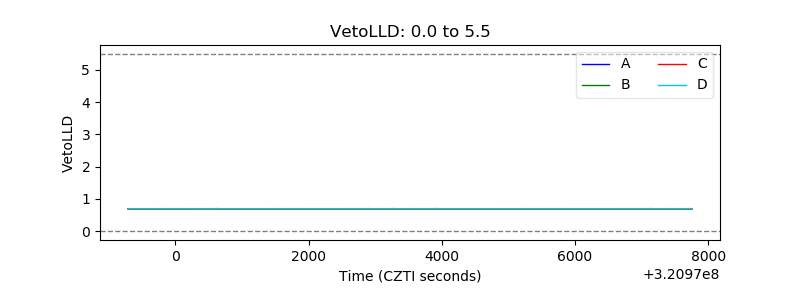 |
| Alpha Counter | 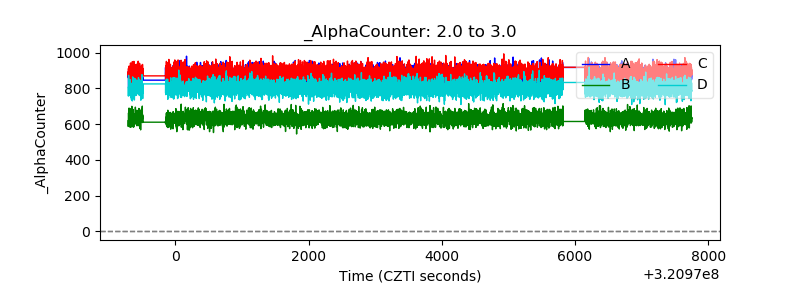 |
| _CPM_Rate | 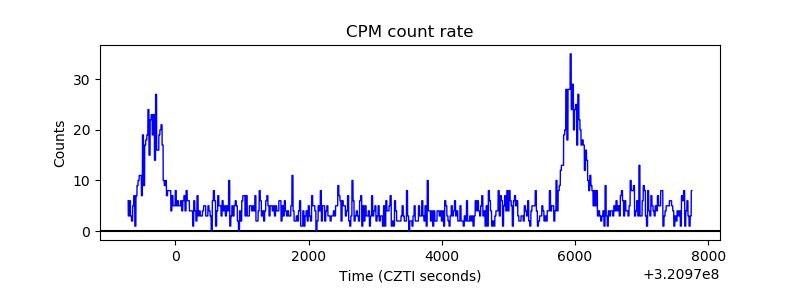 |
| CZT Counter | 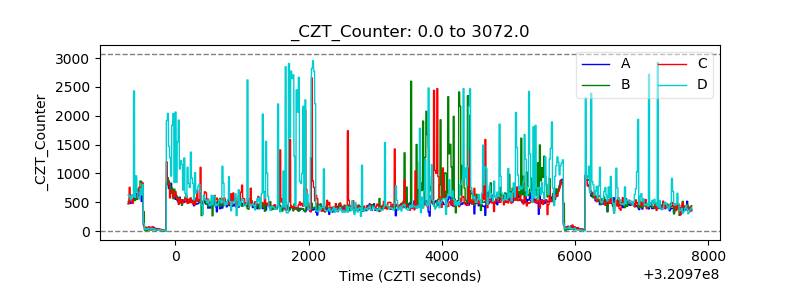 |
| +2.5 Volts monitor | 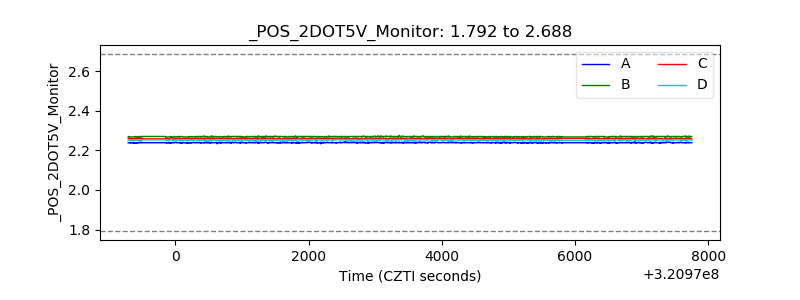 |
| +5 Volts monitor |  |
| _ROLL_ROT | 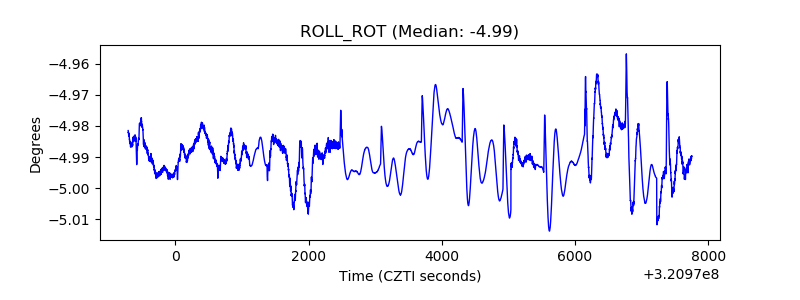 |
| _Roll_DEC | 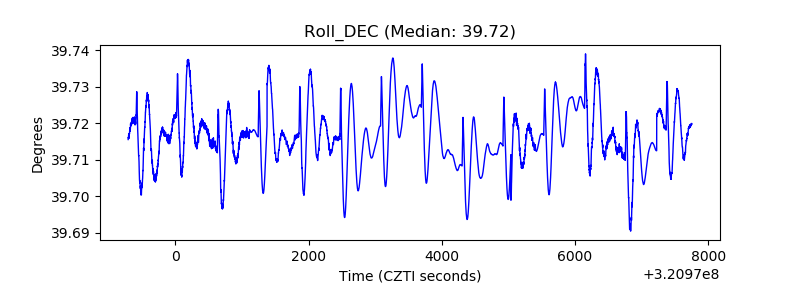 |
| _Roll_RA | 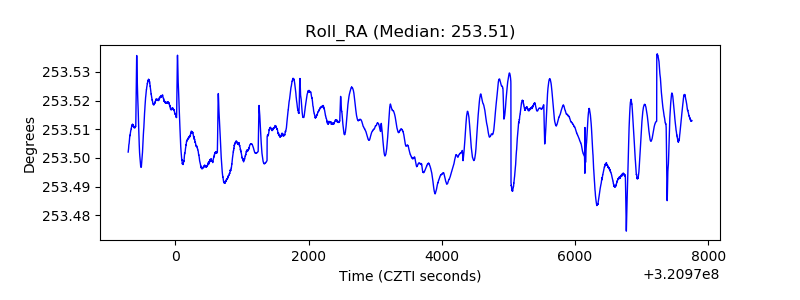 |
| Veto Counter | 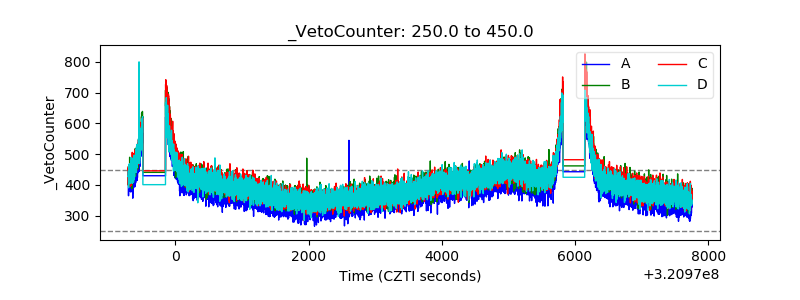 |