| Param | Original file | Final file |
|---|---|---|
| Filename | modeM0/AS1C05_002T07_9000003542cztM0_level2.fits | modeM0/AS1C05_002T07_9000003542cztM0_level2_quad_clean.evt |
| Size (bytes) | 80,637,120 | 68,417,280 |
| Size | 76.9 MB | 65.2 MB |
| Events in quadrant A | 497,780 | 390,382 |
| Events in quadrant B | 475,060 | 395,028 |
| Events in quadrant C | 480,768 | 376,207 |
| Events in quadrant D | 386,330 | 307,458 |
| Mode M9 | |||
|---|---|---|---|
| Quadrant | BADHDUFLAG | Total packets | Discarded packets |
| A | 0 | 6 | 0 |
| B | 0 | 6 | 0 |
| C | 0 | 6 | 0 |
| D | 0 | 6 | 0 |
| Mode SS | |||
|---|---|---|---|
| Quadrant | BADHDUFLAG | Total packets | Discarded packets |
| A | 0 | 176 | 0 |
| B | 0 | 176 | 0 |
| C | 0 | 176 | 0 |
| D | 0 | 176 | 0 |
| Mode M0 | |||
|---|---|---|---|
| Quadrant | BADHDUFLAG | Total packets | Discarded packets |
| A | 0 | 17520 | 0 |
| B | 0 | 17787 | 0 |
| C | 0 | 18016 | 0 |
| D | 0 | 27247 | 0 |
| Quadrant | Total seconds | Saturated seconds | Saturation percentage |
|---|---|---|---|
| A | 8669 | 50 | 0.576768% |
| B | 8669 | 68 | 0.784404% |
| C | 8669 | 122 | 1.407313% |
| D | 8669 | 1105 | 12.746568% |
Noise dominated data is calculated using 1-second bins in cleaned event files. If a bin has >2000 counts, and if more than 50% of those come from <1% of pixels, then it is considered to be noise-dominated and hence unusable.
| Quadrant | # 1 sec bins | Bins with >0 counts | Bins with >2000 counts | High rate bins dominated by noise | Noise dominated (total time) | Noise dominated (detector-on time) | Marked lightcurve |
|---|---|---|---|---|---|---|---|
| A | 9269 | 8669 | 0 | 0 | 0.00% | 0.00% |  |
| B | 9269 | 8669 | 0 | 0 | 0.00% | 0.00% |  |
| C | 9269 | 8669 | 0 | 0 | 0.00% | 0.00% |  |
| D | 9269 | 8521 | 0 | 0 | 0.00% | 0.00% |  |
Top three noisy pixels from each quadrant. If the there are fewer than three noisy pixels in the level2.evt file, extra rows are filled as -1
| Pixel properties | Quadrant properties | ||||||
|---|---|---|---|---|---|---|---|
| Quadrant | DetID | PixID | Counts | Sigma | Mean | Median | Sigma |
| A | 0 | 29 | 492 | 10.9 | 129 | 121 | 34.0 |
| A | 7 | 110 | 388 | 7.84 | 129 | 121 | 34.0 |
| A | 0 | 30 | 378 | 7.55 | 129 | 121 | 34.0 |
| B | 2 | 9 | 419 | 10.8 | 125 | 120 | 27.7 |
| B | 2 | 8 | 389 | 9.72 | 125 | 120 | 27.7 |
| B | 14 | 254 | 330 | 7.59 | 125 | 120 | 27.7 |
| C | 1 | 81 | 387 | 7.75 | 126 | 118 | 34.7 |
| C | 1 | 80 | 386 | 7.73 | 126 | 118 | 34.7 |
| C | 12 | 241 | 340 | 6.4 | 126 | 118 | 34.7 |
| D | 15 | 46 | 300 | 6.35 | 110 | 99 | 31.6 |
| D | 3 | 14 | 292 | 6.1 | 110 | 99 | 31.6 |
| D | 6 | 231 | 274 | 5.53 | 110 | 99 | 31.6 |
Histogram calculated using DETX and DETY for each event in the final _common_clean file
| Quadrant A |  |
 |
Quadrant B |
|---|---|---|---|
| Quadrant D | 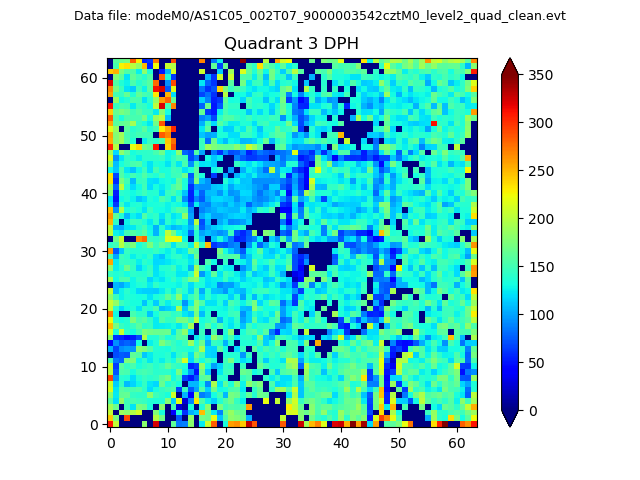 |
 |
Quadrant C |
| Plot type | Count rate plots | Images |
|---|---|---|
| Comparison with Poisson distribution Blue bars denote a histogram of data divided into 1 sec bins. Red curve is a Poisson curve with rate = median count rate of data. |
 |
 |
| Quadrant-wise count rates Data is divided into 100 sec bins |
 |
|
| Module-wise count rates for Quadrant A Data is divided into 100 sec bins |
 |
 |
| Module-wise count rates for Quadrant B Data is divided into 100 sec bins |
 |
 |
| Module-wise count rates for Quadrant C Data is divided into 100 sec bins |
 |
 |
| Module-wise count rates for Quadrant D Data is divided into 100 sec bins |
 |
 |
| Parameter | Plot |
|---|---|
| CZT HV Monitor |  |
| D_VDD |  |
| Temperature 1 |  |
| Veto HV Monitor |  |
| Veto LLD |  |
| Alpha Counter |  |
| _CPM_Rate |  |
| CZT Counter |  |
| +2.5 Volts monitor |  |
| +5 Volts monitor |  |
| _ROLL_ROT |  |
| _Roll_DEC |  |
| _Roll_RA |  |
| Veto Counter |  |