| Param | Original file | Final file |
|---|---|---|
| Filename | modeM0/AS1C05_002T07_9000003542_23935cztM0_level2.evt | modeM0/AS1C05_002T07_9000003542_23935cztM0_level2_quad_clean.evt |
| Size (bytes) | 662,169,600 | 92,347,200 |
| Size | 631.5 MB | 88.1 MB |
| Events in quadrant A | 4,007,655 | 565,550 |
| Events in quadrant B | 4,147,609 | 576,691 |
| Events in quadrant C | 4,179,909 | 552,332 |
| Events in quadrant D | 7,130,707 | 499,609 |
| Mode M9 | |||
|---|---|---|---|
| Quadrant | BADHDUFLAG | Total packets | Discarded packets |
| A | 0 | 6 | 0 |
| B | 0 | 6 | 0 |
| C | 0 | 6 | 0 |
| D | 0 | 6 | 0 |
| Mode SS | |||
|---|---|---|---|
| Quadrant | BADHDUFLAG | Total packets | Discarded packets |
| A | 0 | 176 | 0 |
| B | 0 | 176 | 0 |
| C | 0 | 176 | 0 |
| D | 0 | 176 | 0 |
| Mode M0 | |||
|---|---|---|---|
| Quadrant | BADHDUFLAG | Total packets | Discarded packets |
| A | 0 | 17521 | 1 |
| B | 0 | 17788 | 1 |
| C | 0 | 18017 | 1 |
| D | 0 | 27248 | 1 |
| Quadrant | Total seconds | Saturated seconds | Saturation percentage |
|---|---|---|---|
| A | 8669 | 50 | 0.576768% |
| B | 8669 | 68 | 0.784404% |
| C | 8669 | 122 | 1.407313% |
| D | 8669 | 1105 | 12.746568% |
Noise dominated data is calculated using 1-second bins in cleaned event files. If a bin has >2000 counts, and if more than 50% of those come from <1% of pixels, then it is considered to be noise-dominated and hence unusable.
| Quadrant | # 1 sec bins | Bins with >0 counts | Bins with >2000 counts | High rate bins dominated by noise | Noise dominated (total time) | Noise dominated (detector-on time) | Marked lightcurve |
|---|---|---|---|---|---|---|---|
| A | 9269 | 8670 | 0 | 0 | 0.00% | 0.00% | 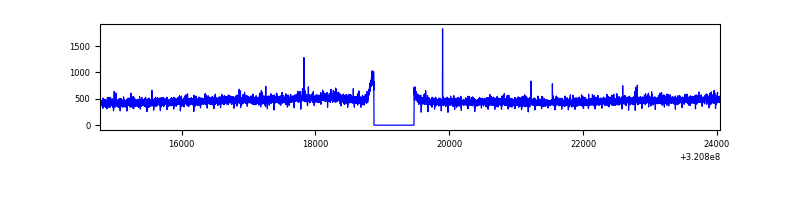 |
| B | 9269 | 8670 | 4 | 4 | 0.04% | 0.05% | 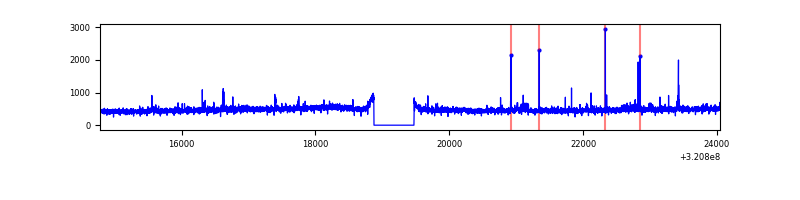 |
| C | 9269 | 8670 | 19 | 19 | 0.20% | 0.22% | 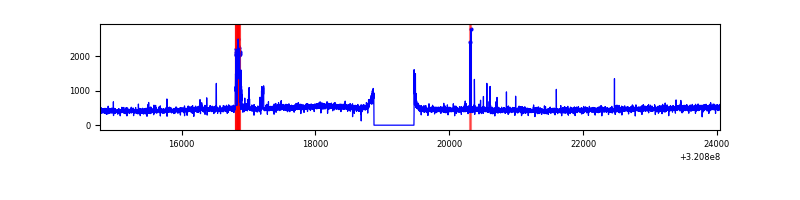 |
| D | 9269 | 8669 | 519 | 519 | 5.60% | 5.99% | 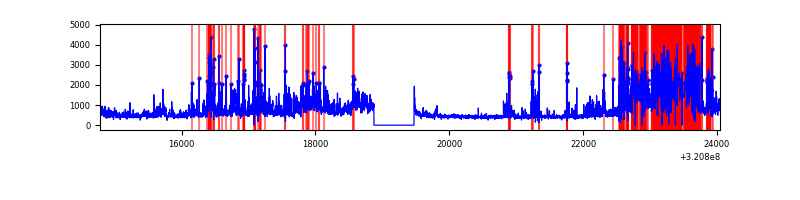 |
Top three noisy pixels from each quadrant. If the there are fewer than three noisy pixels in the level2.evt file, extra rows are filled as -1
| Pixel properties | Quadrant properties | ||||||
|---|---|---|---|---|---|---|---|
| Quadrant | DetID | PixID | Counts | Sigma | Mean | Median | Sigma |
| A | 13 | 254 | 11894 | 51.95 | 1037 | 1017 | 209.4 |
| A | 3 | 137 | 9608 | 41.03 | 1037 | 1017 | 209.4 |
| A | 0 | 226 | 8884 | 37.58 | 1037 | 1017 | 209.4 |
| B | 0 | 190 | 35947 | 177.09 | 1029 | 1002 | 197.3 |
| B | 12 | 111 | 24261 | 117.87 | 1029 | 1002 | 197.3 |
| B | 3 | 64 | 22980 | 111.38 | 1029 | 1002 | 197.3 |
| C | 14 | 238 | 156586 | 675.84 | 985 | 990 | 230.2 |
| C | 3 | 233 | 136462 | 588.43 | 985 | 990 | 230.2 |
| C | 0 | 10 | 33837 | 142.67 | 985 | 990 | 230.2 |
| D | 12 | 218 | 1572575 | 6972.78 | 923 | 896 | 225.4 |
| D | 8 | 195 | 1090203 | 4832.73 | 923 | 896 | 225.4 |
| D | 1 | 52 | 365875 | 1619.24 | 923 | 896 | 225.4 |
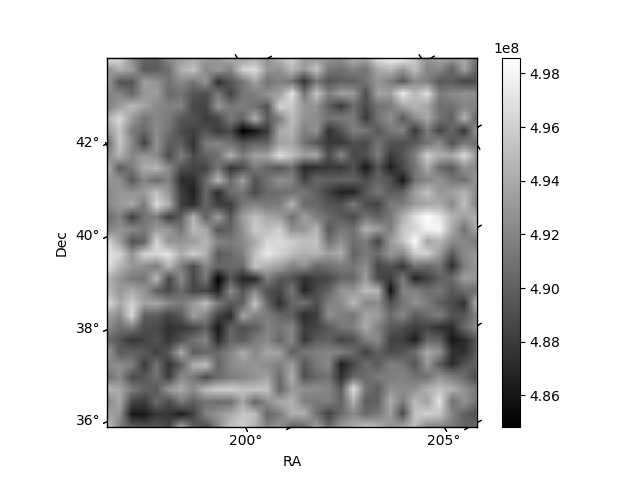
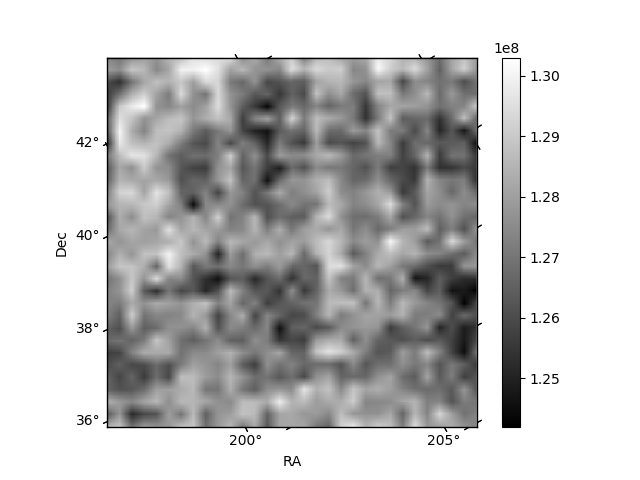
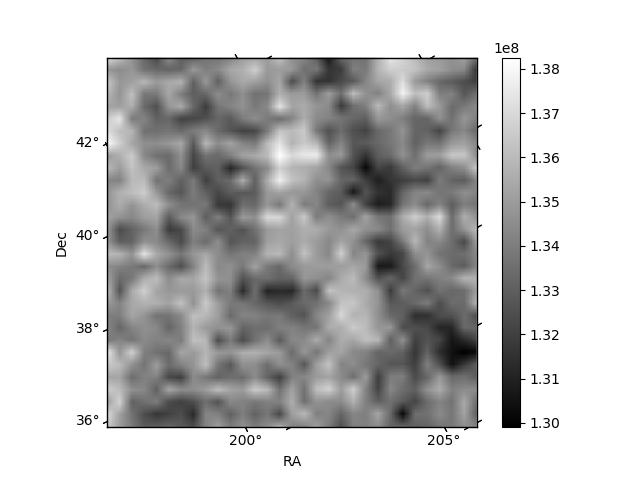
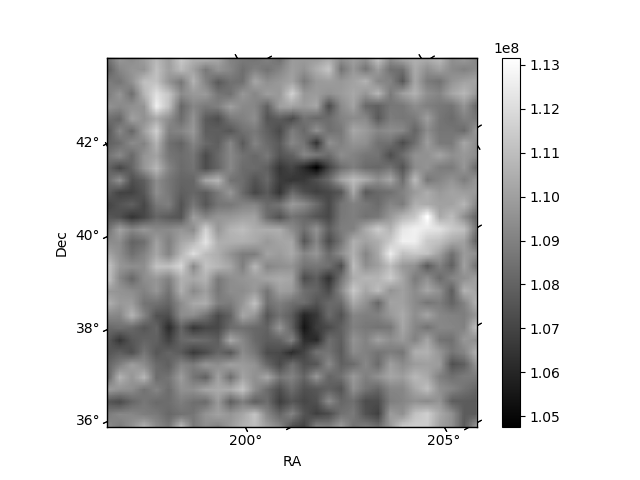
Histogram calculated using DETX and DETY for each event in the final _common_clean file
| Quadrant A | 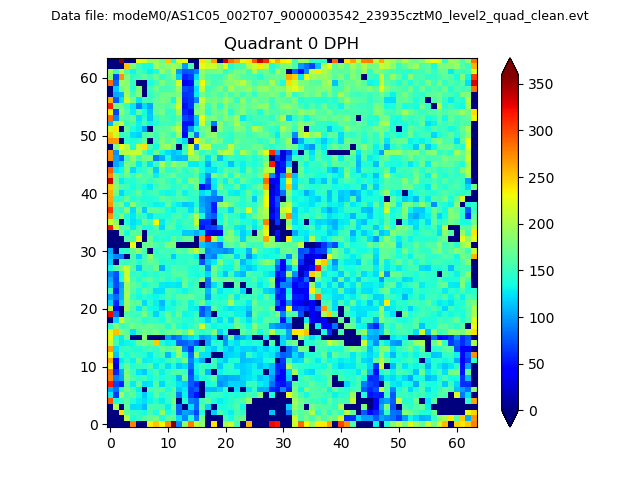 |
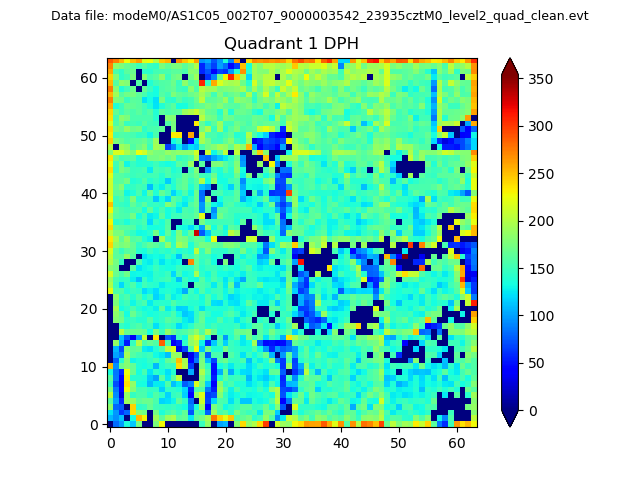 |
Quadrant B |
|---|---|---|---|
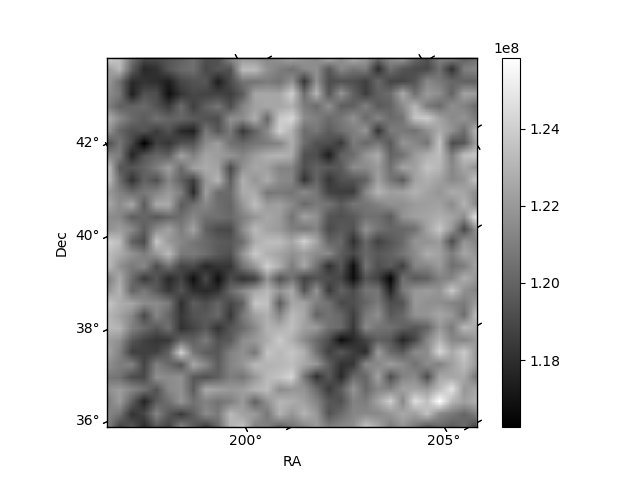
| Quadrant D |  |
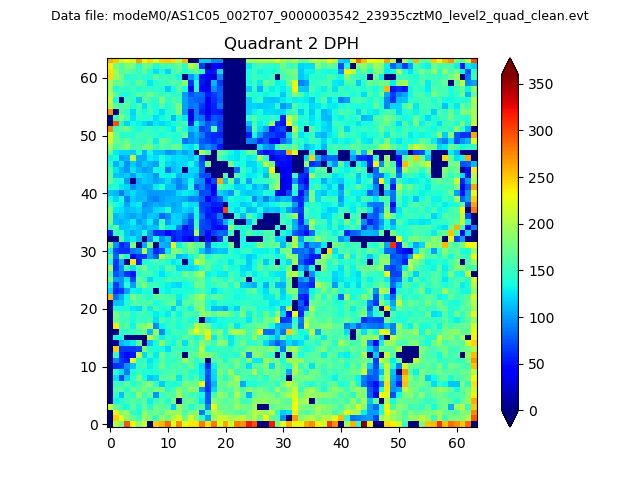 |
Quadrant C |
| Plot type | Count rate plots | Images |
|---|---|---|
| Comparison with Poisson distribution Blue bars denote a histogram of data divided into 1 sec bins. Red curve is a Poisson curve with rate = median count rate of data. |
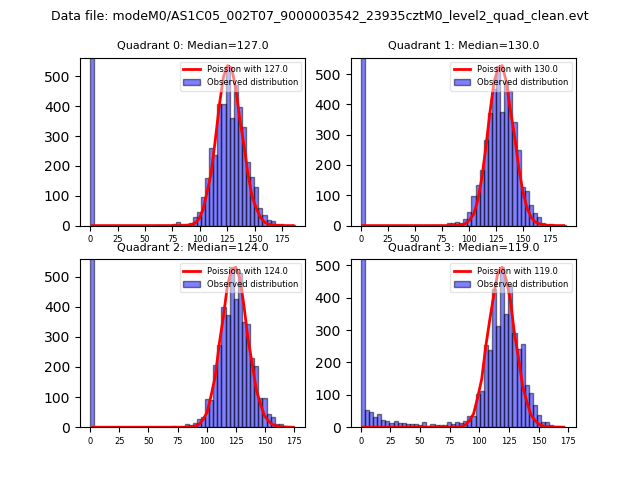 |
 |
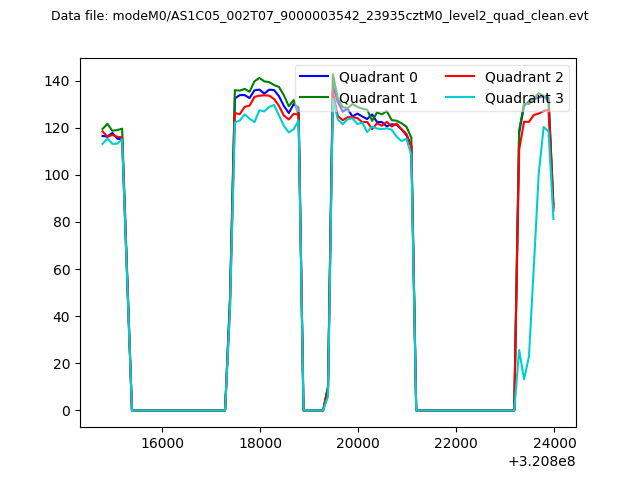
| Quadrant-wise count rates Data is divided into 100 sec bins |
 |
|
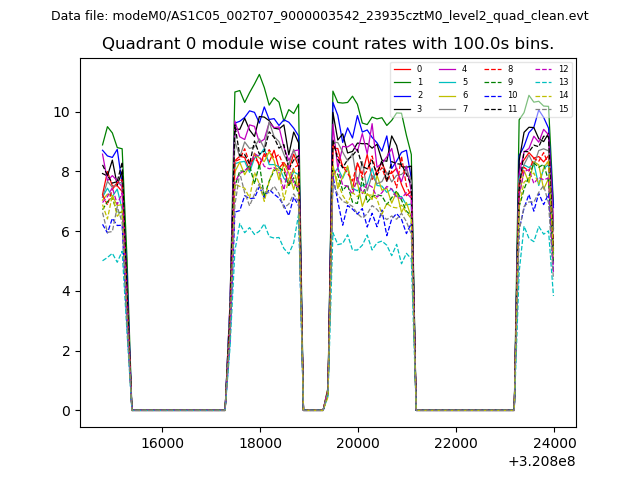
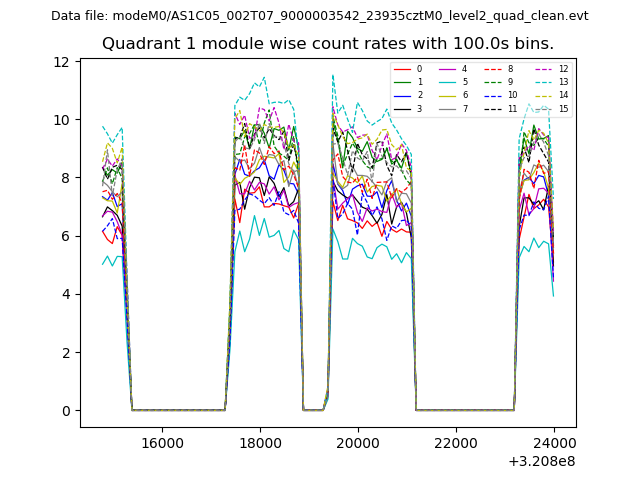
| Module-wise count rates for Quadrant A Data is divided into 100 sec bins |
 |
 |
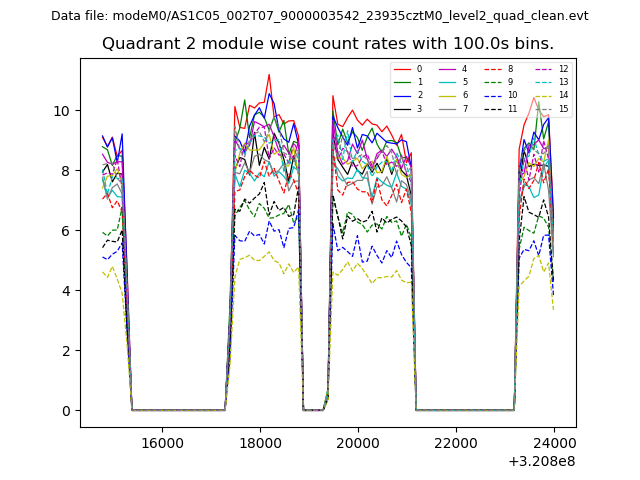
| Module-wise count rates for Quadrant B Data is divided into 100 sec bins |
 |
 |
| Module-wise count rates for Quadrant C Data is divided into 100 sec bins |
 |
 |
| Module-wise count rates for Quadrant D Data is divided into 100 sec bins |
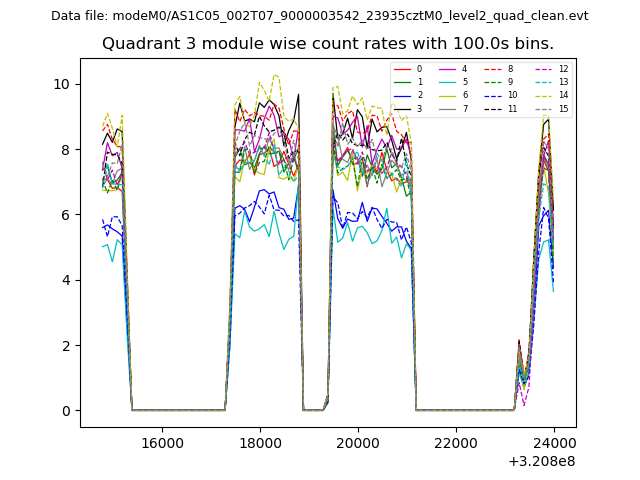 |
 |
| Parameter | Plot |
|---|---|
| CZT HV Monitor | 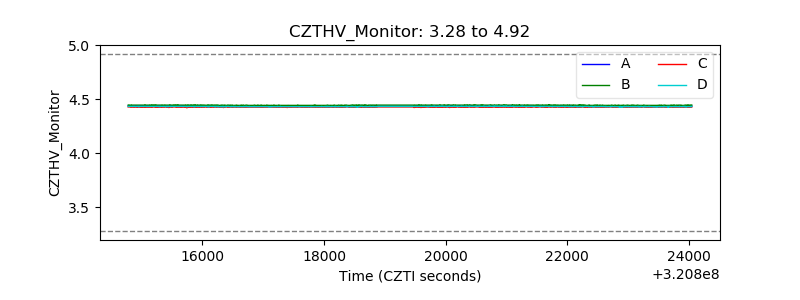 |
| D_VDD | 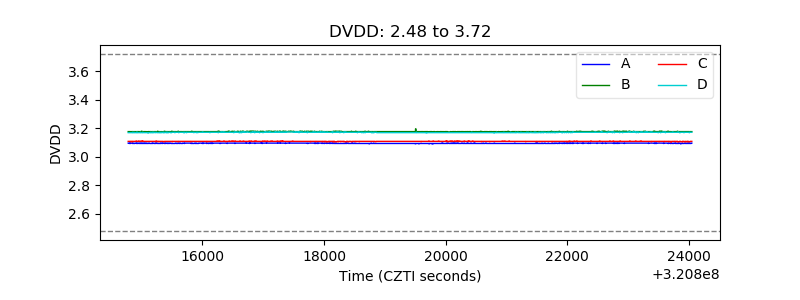 |
| Temperature 1 | 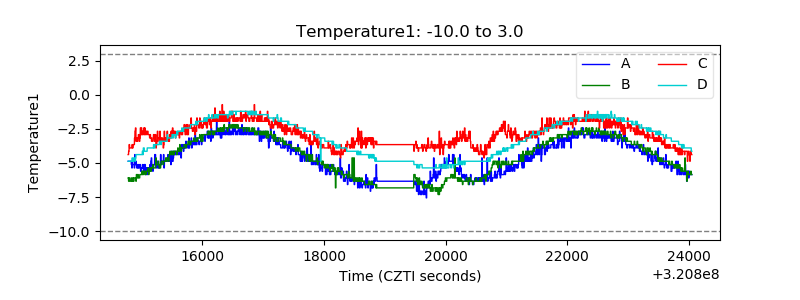 |
| Veto HV Monitor | 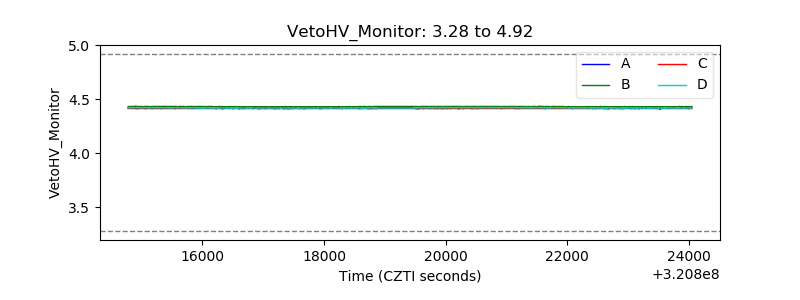 |
| Veto LLD | 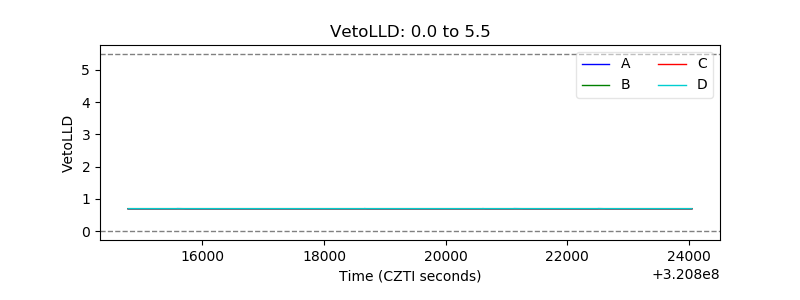 |
| Alpha Counter | 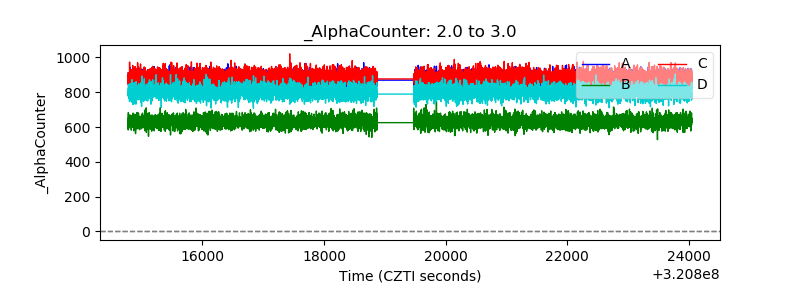 |
| _CPM_Rate | 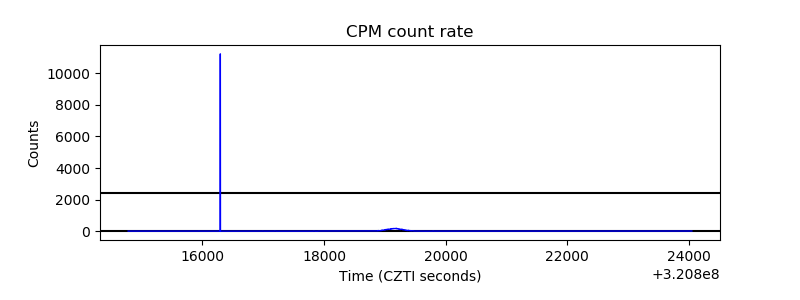 |
| CZT Counter |  |
| +2.5 Volts monitor |  |
| +5 Volts monitor |  |
| _ROLL_ROT | 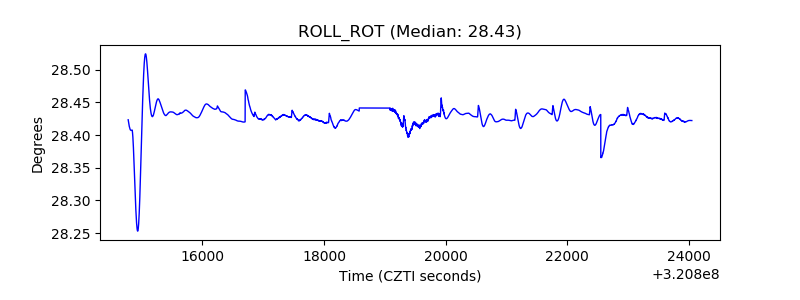 |
| _Roll_DEC | 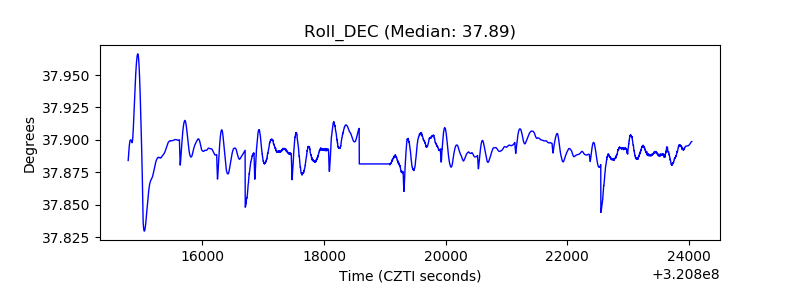 |
| _Roll_RA | 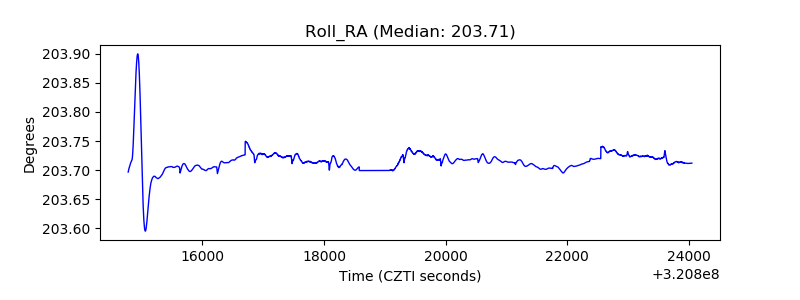 |
| Veto Counter | 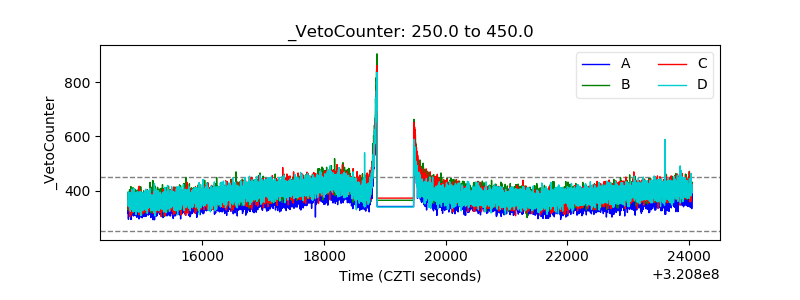 |