| Param | Original file | Final file |
|---|---|---|
| Filename | modeM0/AS1A07_001T02_9000003546cztM0_level2.fits | modeM0/AS1A07_001T02_9000003546cztM0_level2_quad_clean.evt |
| Size (bytes) | 194,967,360 | 220,789,440 |
| Size | 185.9 MB | 210.6 MB |
| Events in quadrant A | 1,232,808 | 1,447,095 |
| Events in quadrant B | 1,171,430 | 1,449,880 |
| Events in quadrant C | 1,189,600 | 1,393,947 |
| Events in quadrant D | 856,460 | 943,483 |
| Mode M0 | |||
|---|---|---|---|
| Quadrant | BADHDUFLAG | Total packets | Discarded packets |
| A | 0 | 42906 | 0 |
| B | 0 | 43482 | 0 |
| C | 0 | 44163 | 0 |
| D | 0 | 89621 | 0 |
| Mode M9 | |||
|---|---|---|---|
| Quadrant | BADHDUFLAG | Total packets | Discarded packets |
| A | 0 | 27 | 0 |
| B | 0 | 27 | 0 |
| C | 0 | 27 | 0 |
| D | 0 | 27 | 0 |
| Mode SS | |||
|---|---|---|---|
| Quadrant | BADHDUFLAG | Total packets | Discarded packets |
| A | 0 | 432 | 0 |
| B | 0 | 432 | 0 |
| C | 0 | 432 | 0 |
| D | 0 | 432 | 0 |
| Quadrant | Total seconds | Saturated seconds | Saturation percentage |
|---|---|---|---|
| A | 21077 | 166 | 0.787588% |
| B | 21072 | 239 | 1.134207% |
| C | 21078 | 375 | 1.779106% |
| D | 21073 | 6095 | 28.923267% |
Noise dominated data is calculated using 1-second bins in cleaned event files. If a bin has >2000 counts, and if more than 50% of those come from <1% of pixels, then it is considered to be noise-dominated and hence unusable.
| Quadrant | # 1 sec bins | Bins with >0 counts | Bins with >2000 counts | High rate bins dominated by noise | Noise dominated (total time) | Noise dominated (detector-on time) | Marked lightcurve |
|---|---|---|---|---|---|---|---|
| A | 23939 | 21079 | 0 | 0 | 0.00% | 0.00% |  |
| B | 23939 | 21077 | 0 | 0 | 0.00% | 0.00% | 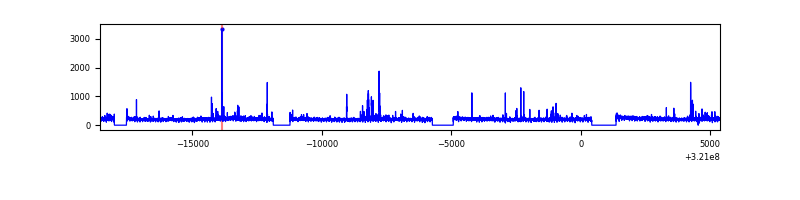 |
| C | 23939 | 21078 | 0 | 0 | 0.00% | 0.00% | 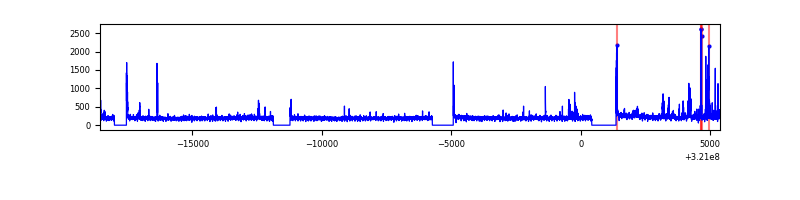 |
| D | 23939 | 20495 | 0 | 0 | 0.00% | 0.00% | 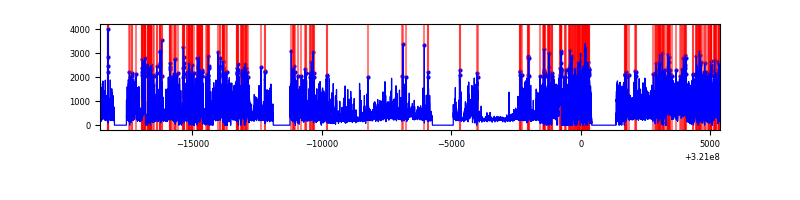 |
Top three noisy pixels from each quadrant. If the there are fewer than three noisy pixels in the level2.evt file, extra rows are filled as -1
| Pixel properties | Quadrant properties | ||||||
|---|---|---|---|---|---|---|---|
| Quadrant | DetID | PixID | Counts | Sigma | Mean | Median | Sigma |
| A | 0 | 29 | 1153 | 10.42 | 321 | 302 | 81.7 |
| A | 7 | 110 | 1000 | 8.54 | 321 | 302 | 81.7 |
| A | 9 | 19 | 899 | 7.31 | 321 | 302 | 81.7 |
| B | 2 | 9 | 911 | 9.7 | 310 | 297 | 63.3 |
| B | 5 | 225 | 798 | 7.92 | 310 | 297 | 63.3 |
| B | 14 | 254 | 775 | 7.56 | 310 | 297 | 63.3 |
| C | 12 | 241 | 856 | 6.99 | 314 | 294 | 80.4 |
| C | 9 | 209 | 817 | 6.51 | 314 | 294 | 80.4 |
| C | 3 | 126 | 814 | 6.47 | 314 | 294 | 80.4 |
| D | 7 | 3 | 605 | 5.73 | 244 | 221 | 67.0 |
| D | 6 | 67 | 604 | 5.72 | 244 | 221 | 67.0 |
| D | 4 | 160 | 599 | 5.64 | 244 | 221 | 67.0 |
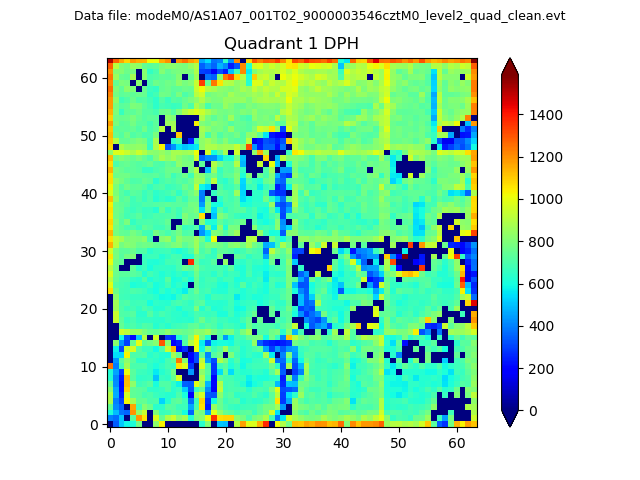
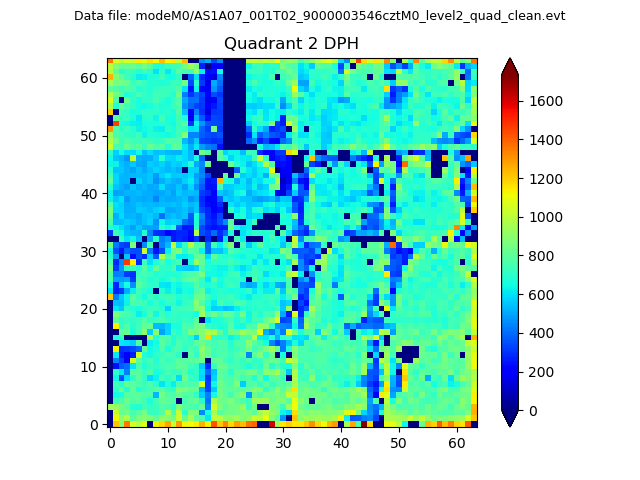
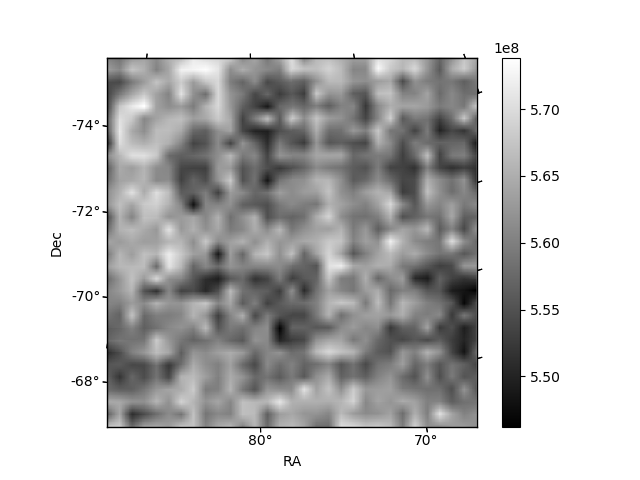
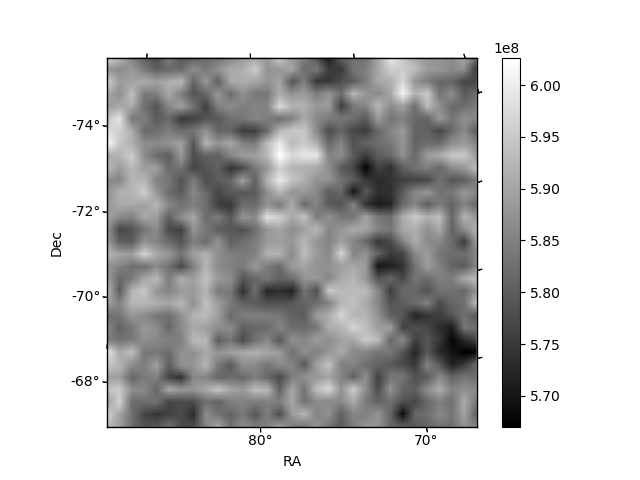
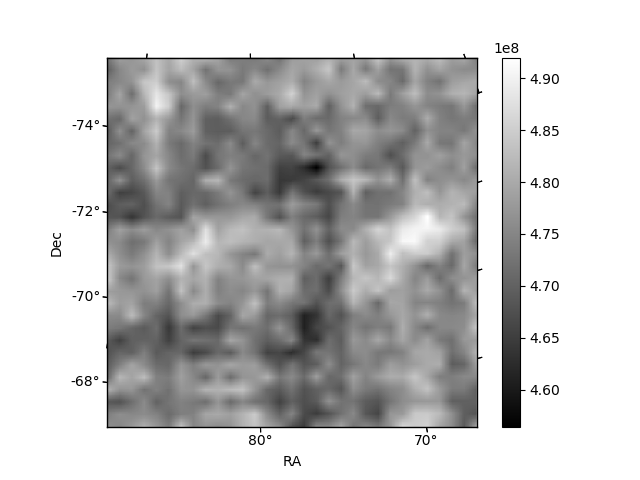
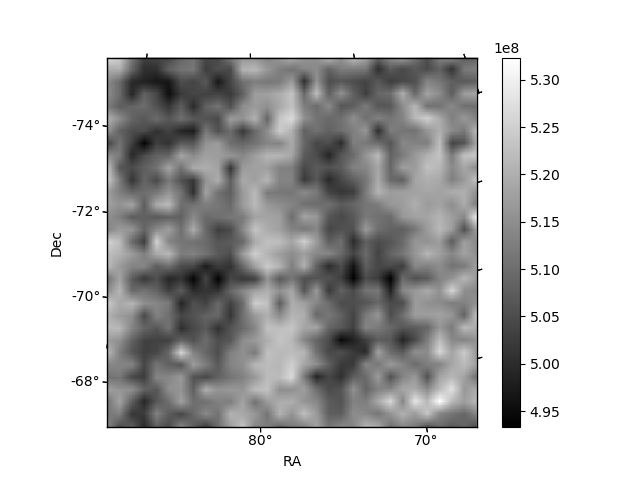
Histogram calculated using DETX and DETY for each event in the final _common_clean file
| Quadrant A |  |
 |
Quadrant B |
|---|---|---|---|
| Quadrant D | 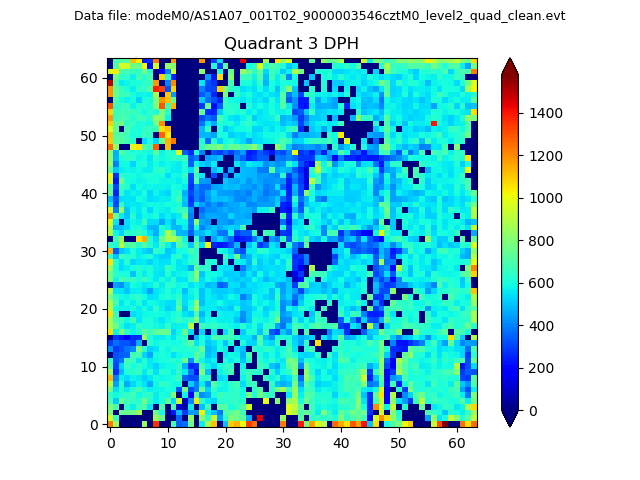 |
 |
Quadrant C |
| Plot type | Count rate plots | Images |
|---|---|---|
| Comparison with Poisson distribution Blue bars denote a histogram of data divided into 1 sec bins. Red curve is a Poisson curve with rate = median count rate of data. |
 |
 |
| Quadrant-wise count rates Data is divided into 100 sec bins |
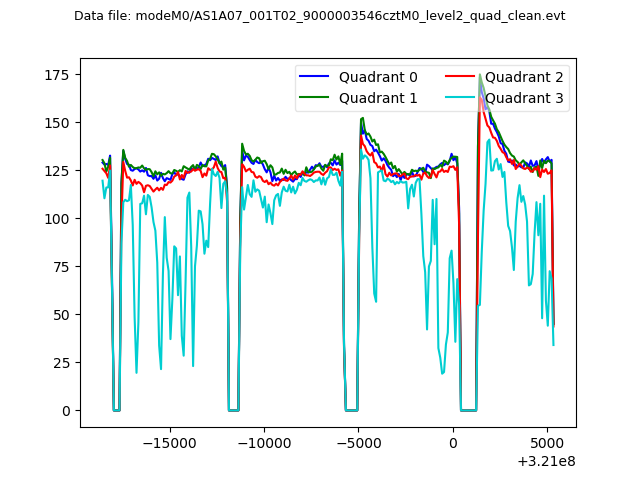 |
|
| Module-wise count rates for Quadrant A Data is divided into 100 sec bins |
 |
 |
| Module-wise count rates for Quadrant B Data is divided into 100 sec bins |
 |
 |
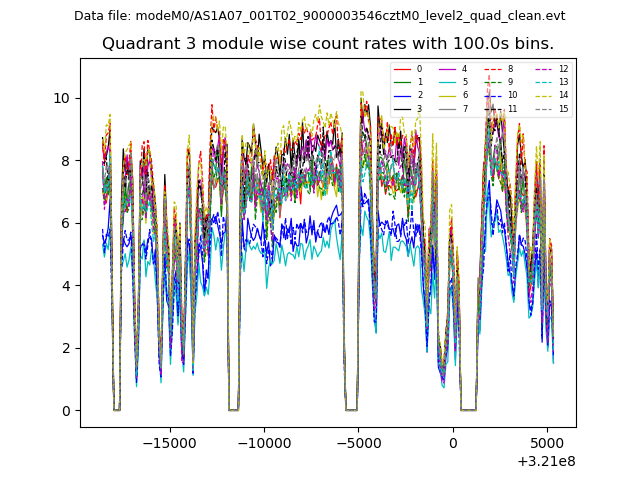
| Module-wise count rates for Quadrant C Data is divided into 100 sec bins |
 |
 |
| Module-wise count rates for Quadrant D Data is divided into 100 sec bins |
 |
 |
| Parameter | Plot |
|---|---|
| CZT HV Monitor | 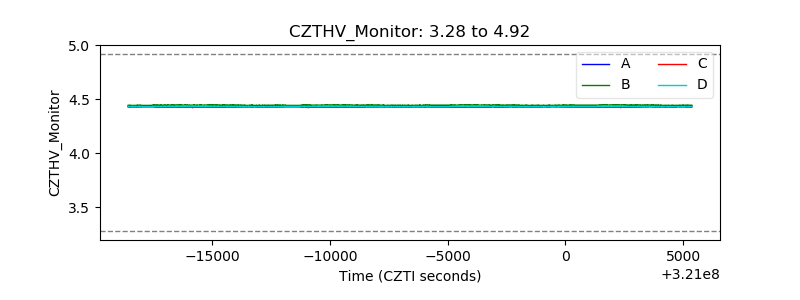 |
| D_VDD | 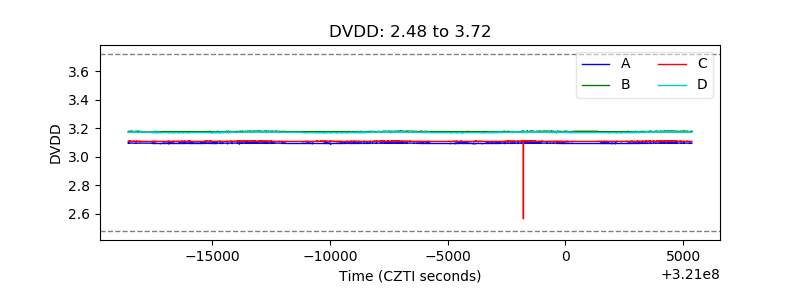 |
| Temperature 1 | 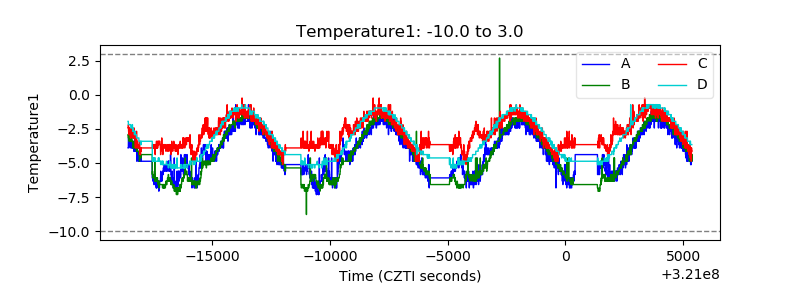 |
| Veto HV Monitor |  |
| Veto LLD | 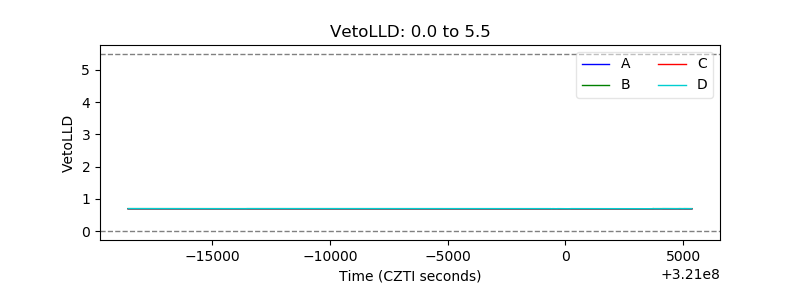 |
| Alpha Counter | 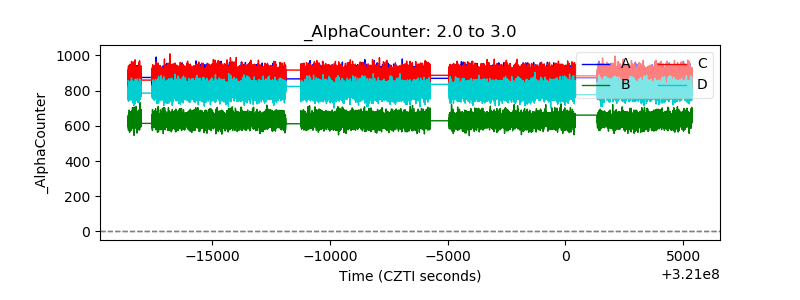 |
| _CPM_Rate | 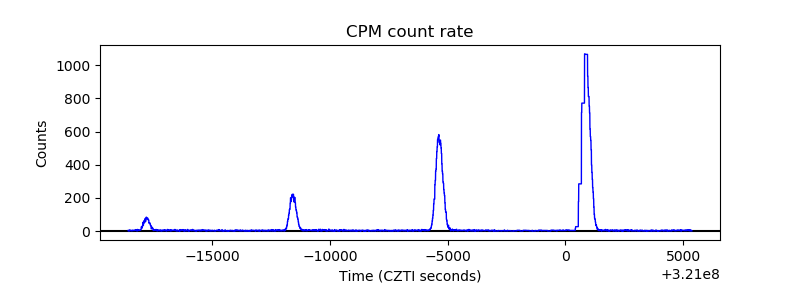 |
| CZT Counter |  |
| +2.5 Volts monitor |  |
| +5 Volts monitor | 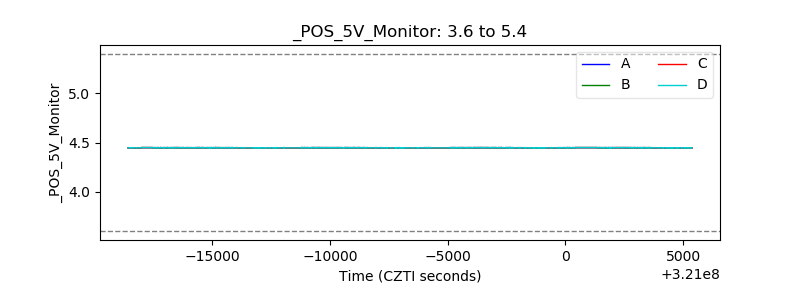 |
| _ROLL_ROT |  |
| _Roll_DEC | 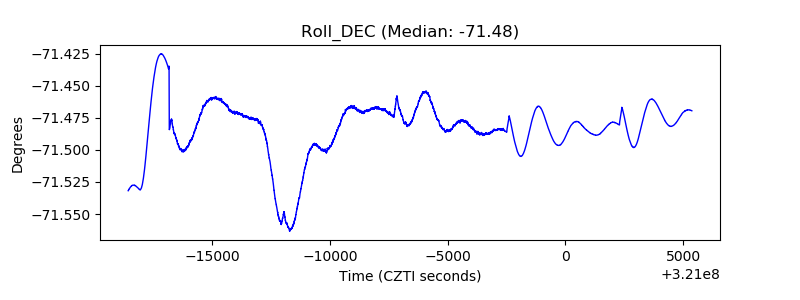 |
| _Roll_RA | 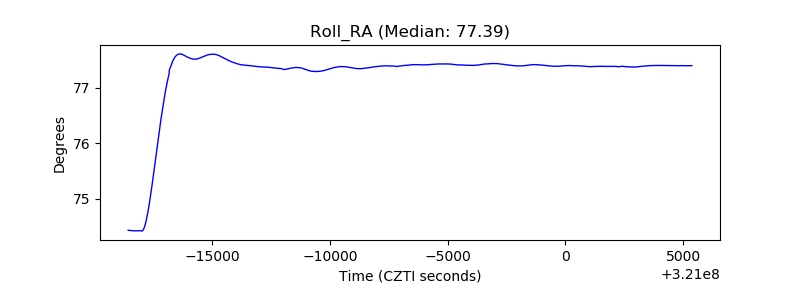 |
| Veto Counter |  |