| Param | Original file | Final file |
|---|---|---|
| Filename | modeM0/AS1A07_001T02_9000003546_23967cztM0_level2.evt | modeM0/AS1A07_001T02_9000003546_23967cztM0_level2_quad_clean.evt |
| Size (bytes) | 392,713,920 | 72,921,600 |
| Size | 374.5 MB | 69.5 MB |
| Events in quadrant A | 1,806,269 | 520,748 |
| Events in quadrant B | 1,854,081 | 526,266 |
| Events in quadrant C | 2,023,110 | 506,560 |
| Events in quadrant D | 5,949,121 | 383,598 |
| Mode M0 | |||
|---|---|---|---|
| Quadrant | BADHDUFLAG | Total packets | Discarded packets |
| A | 0 | 7788 | 4 |
| B | 0 | 7915 | 14 |
| C | 0 | 8522 | 2 |
| D | 0 | 20373 | 37 |
| Mode SS | |||
|---|---|---|---|
| Quadrant | BADHDUFLAG | Total packets | Discarded packets |
| A | 0 | 76 | 0 |
| B | 0 | 76 | 0 |
| C | 0 | 76 | 0 |
| D | 0 | 76 | 0 |
| Quadrant | Total seconds | Saturated seconds | Saturation percentage |
|---|---|---|---|
| A | 3830 | 5 | 0.130548% |
| B | 3826 | 9 | 0.235233% |
| C | 3832 | 27 | 0.704593% |
| D | 3827 | 1475 | 38.541939% |
Noise dominated data is calculated using 1-second bins in cleaned event files. If a bin has >2000 counts, and if more than 50% of those come from <1% of pixels, then it is considered to be noise-dominated and hence unusable.
| Quadrant | # 1 sec bins | Bins with >0 counts | Bins with >2000 counts | High rate bins dominated by noise | Noise dominated (total time) | Noise dominated (detector-on time) | Marked lightcurve |
|---|---|---|---|---|---|---|---|
| A | 3832 | 3831 | 0 | 0 | 0.00% | 0.00% | 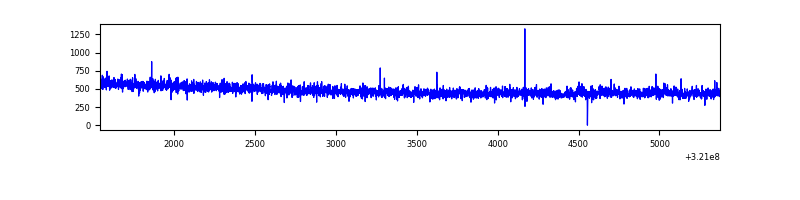 |
| B | 3833 | 3832 | 3 | 3 | 0.08% | 0.08% | 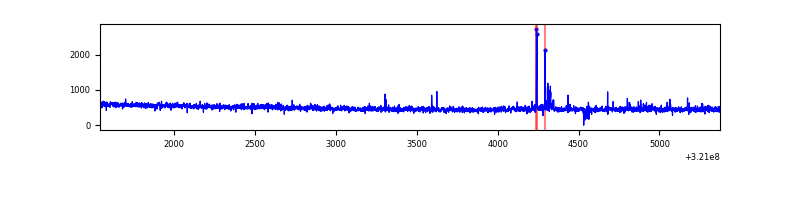 |
| C | 3833 | 3833 | 8 | 8 | 0.21% | 0.21% | 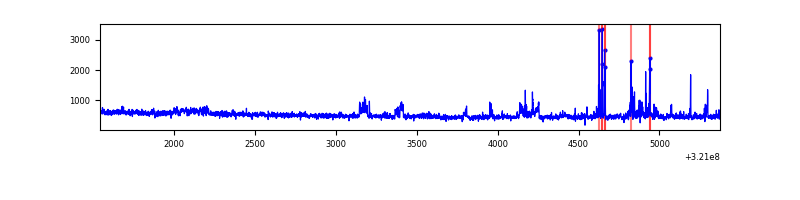 |
| D | 3833 | 3832 | 1100 | 1100 | 28.70% | 28.71% | 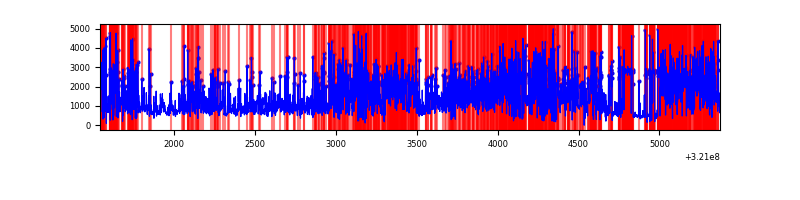 |
Top three noisy pixels from each quadrant. If the there are fewer than three noisy pixels in the level2.evt file, extra rows are filled as -1
| Pixel properties | Quadrant properties | ||||||
|---|---|---|---|---|---|---|---|
| Quadrant | DetID | PixID | Counts | Sigma | Mean | Median | Sigma |
| A | 13 | 254 | 6195 | 60.69 | 467 | 457 | 94.5 |
| A | 0 | 226 | 4077 | 38.29 | 467 | 457 | 94.5 |
| A | 3 | 137 | 3887 | 36.28 | 467 | 457 | 94.5 |
| B | 0 | 197 | 28418 | 319.82 | 460 | 448 | 87.5 |
| B | 12 | 111 | 10238 | 111.94 | 460 | 448 | 87.5 |
| B | 11 | 111 | 8979 | 97.55 | 460 | 448 | 87.5 |
| C | 0 | 239 | 154062 | 1493.06 | 446 | 449 | 102.9 |
| C | 14 | 238 | 71882 | 694.3 | 446 | 449 | 102.9 |
| C | 7 | 221 | 30052 | 287.73 | 446 | 449 | 102.9 |
| D | 12 | 218 | 3963646 | 44068.72 | 370 | 360 | 89.9 |
| D | 12 | 250 | 178676 | 1982.74 | 370 | 360 | 89.9 |
| D | 1 | 52 | 137718 | 1527.32 | 370 | 360 | 89.9 |
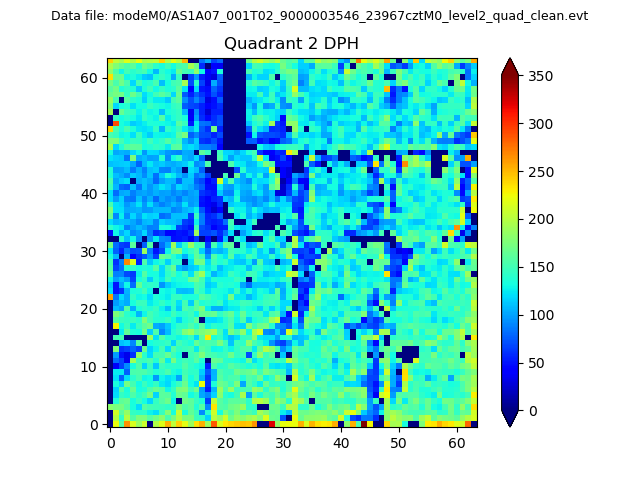
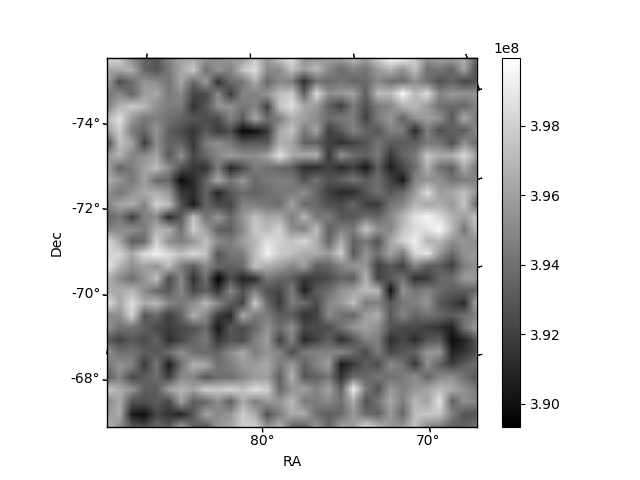
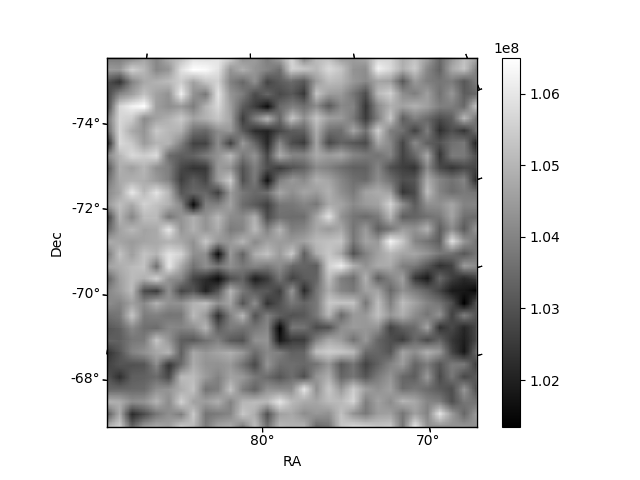
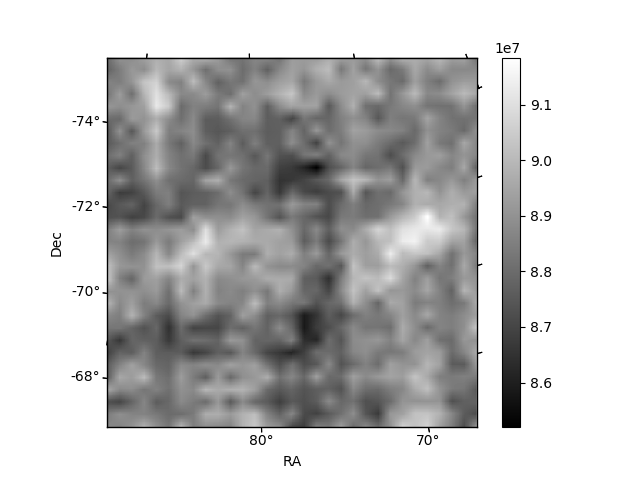
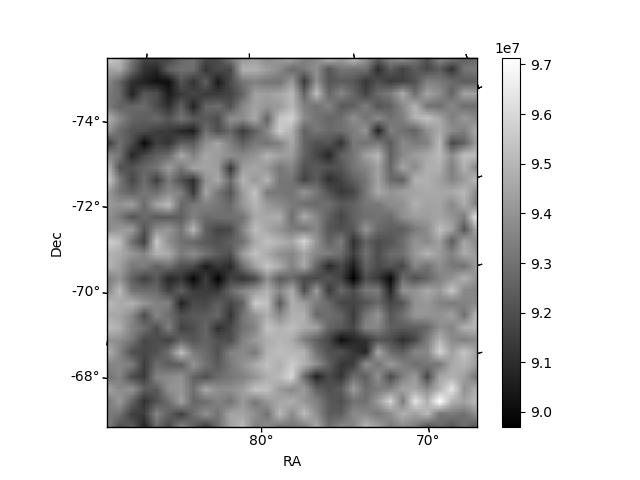
Histogram calculated using DETX and DETY for each event in the final _common_clean file
| Quadrant A | 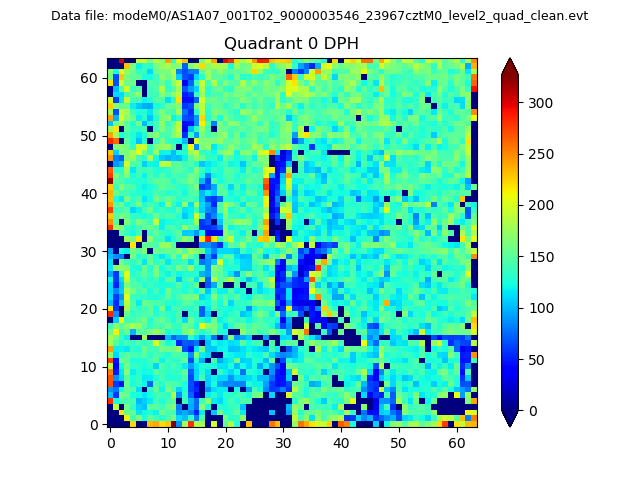 |
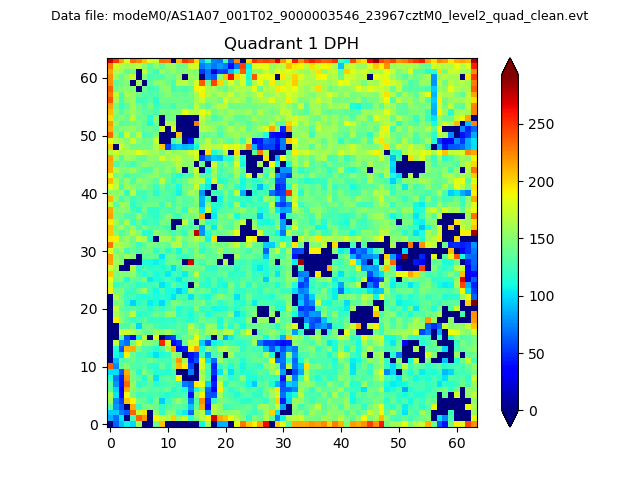 |
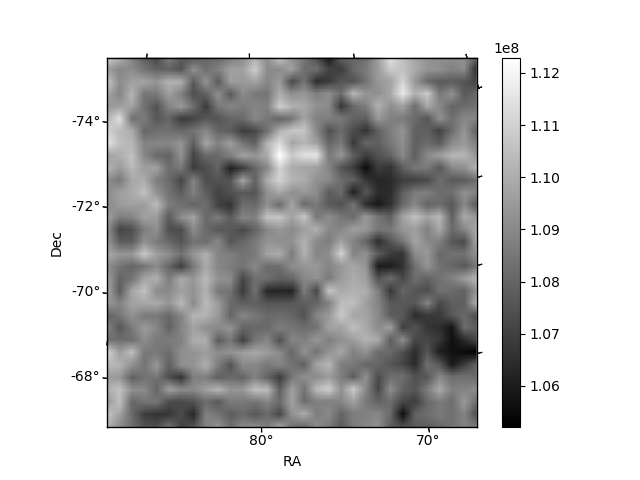
Quadrant B |
|---|---|---|---|
| Quadrant D | 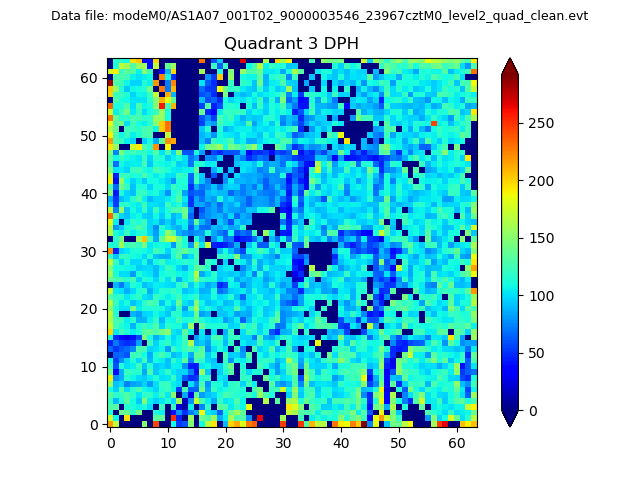 |
 |
Quadrant C |
| Plot type | Count rate plots | Images |
|---|---|---|
| Comparison with Poisson distribution Blue bars denote a histogram of data divided into 1 sec bins. Red curve is a Poisson curve with rate = median count rate of data. |
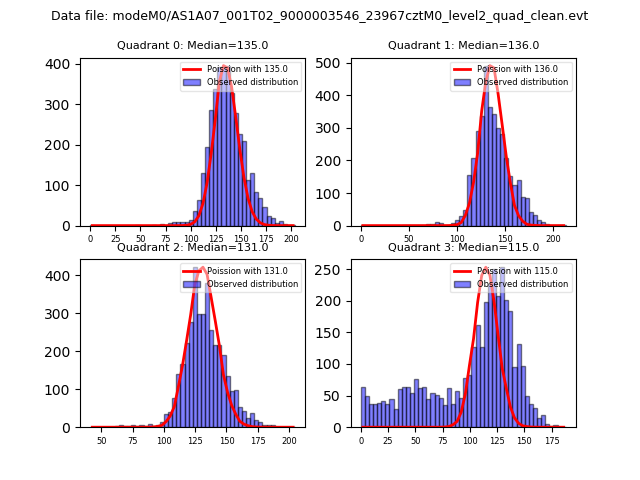 |
 |
| Quadrant-wise count rates Data is divided into 100 sec bins |
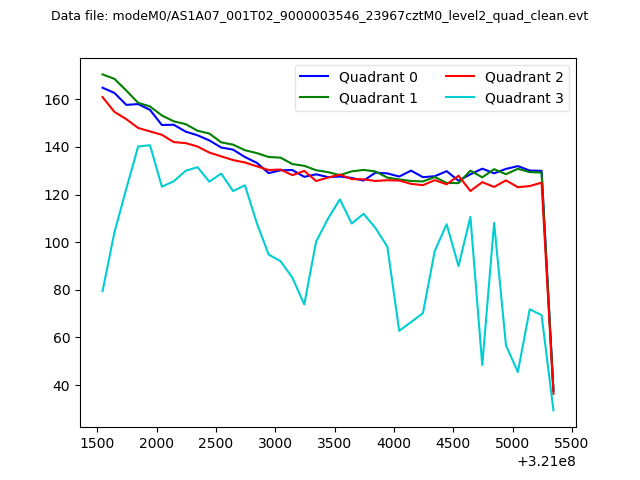 |
|
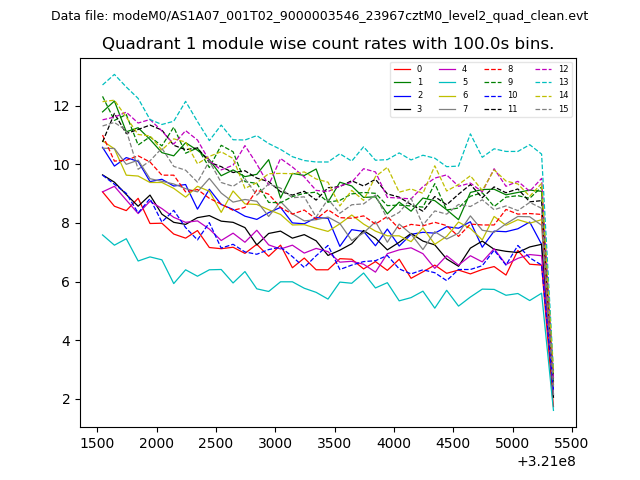
| Module-wise count rates for Quadrant A Data is divided into 100 sec bins |
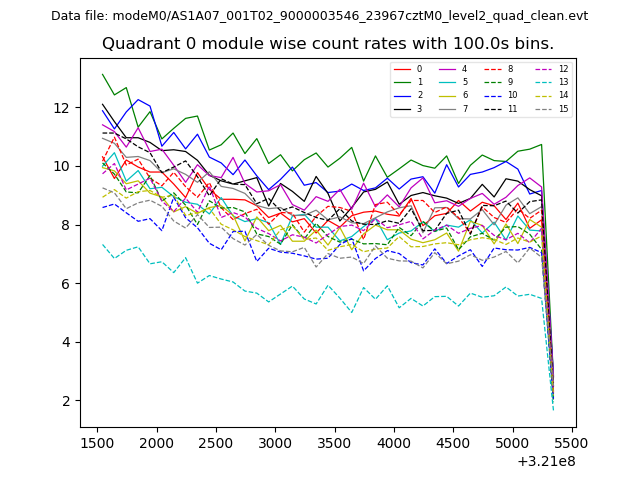 |
 |
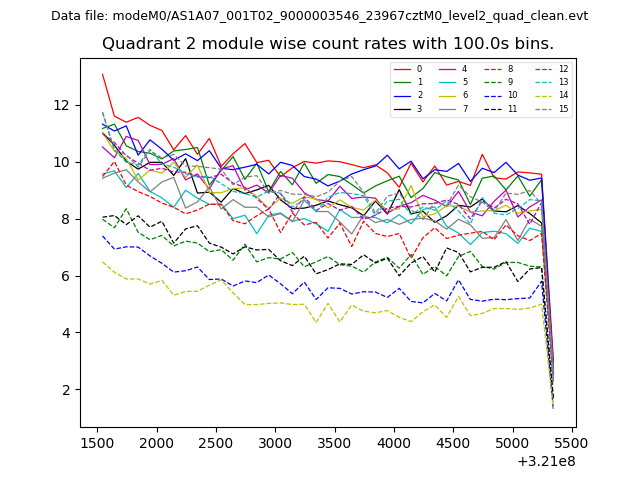
| Module-wise count rates for Quadrant B Data is divided into 100 sec bins |
 |
 |
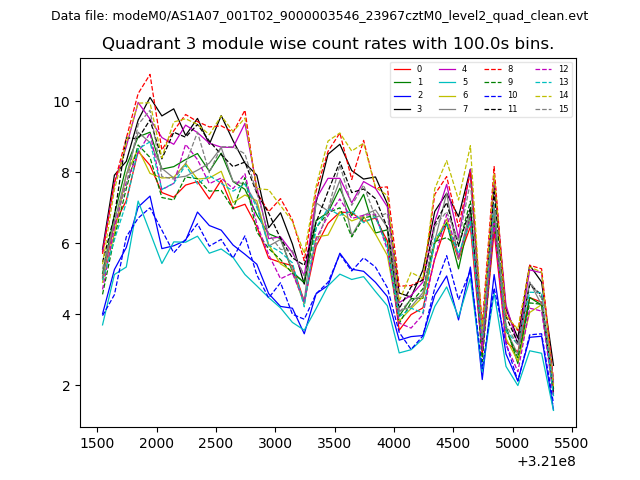
| Module-wise count rates for Quadrant C Data is divided into 100 sec bins |
 |
 |
| Module-wise count rates for Quadrant D Data is divided into 100 sec bins |
 |
 |
| Parameter | Plot |
|---|---|
| CZT HV Monitor | 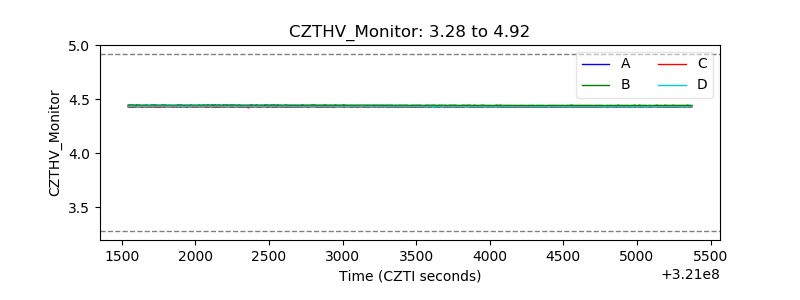 |
| D_VDD | 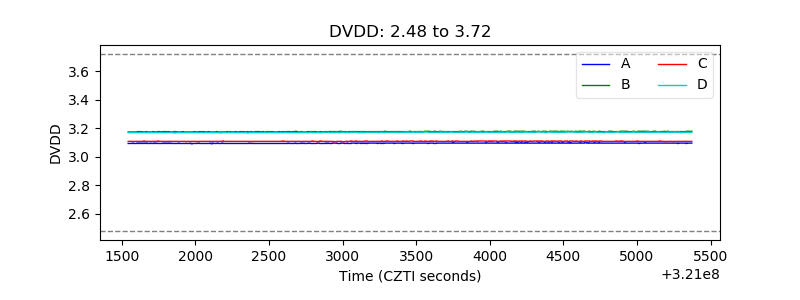 |
| Temperature 1 | 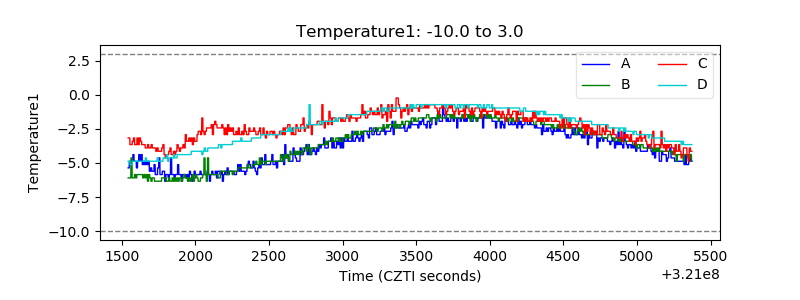 |
| Veto HV Monitor | 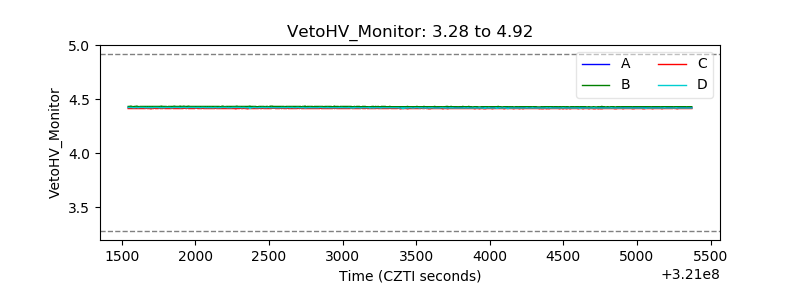 |
| Veto LLD | 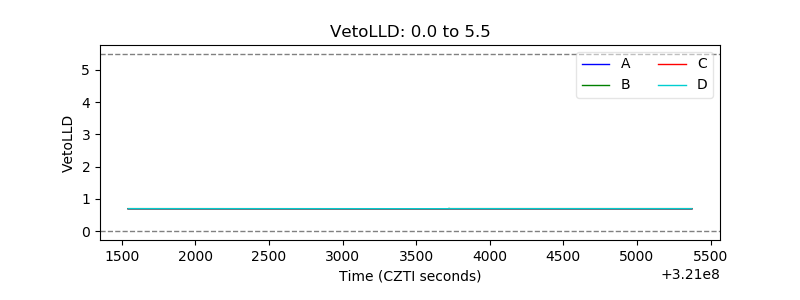 |
| Alpha Counter | 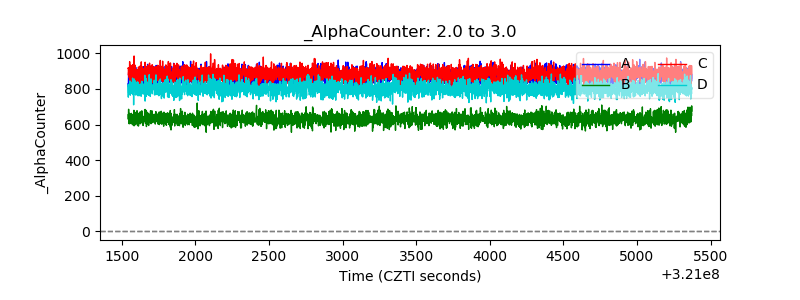 |
| _CPM_Rate | 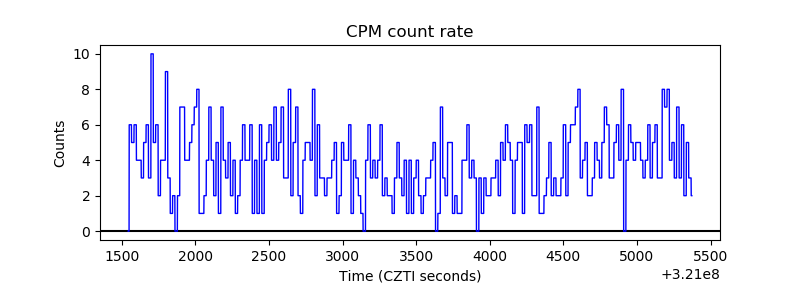 |
| CZT Counter | 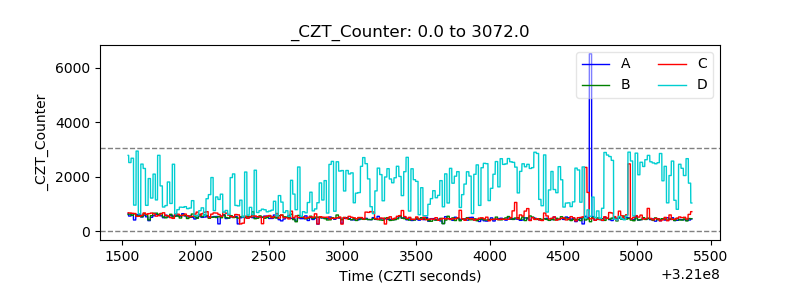 |
| +2.5 Volts monitor |  |
| +5 Volts monitor |  |
| _ROLL_ROT | 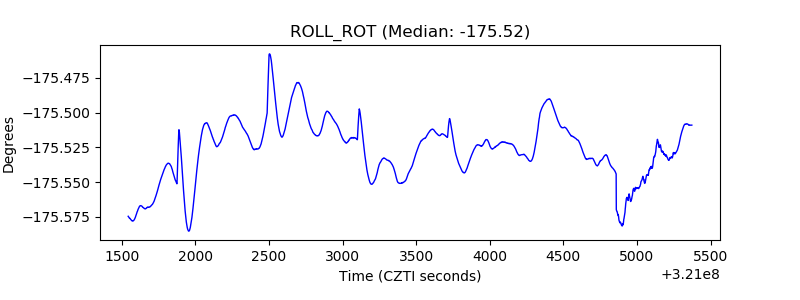 |
| _Roll_DEC | 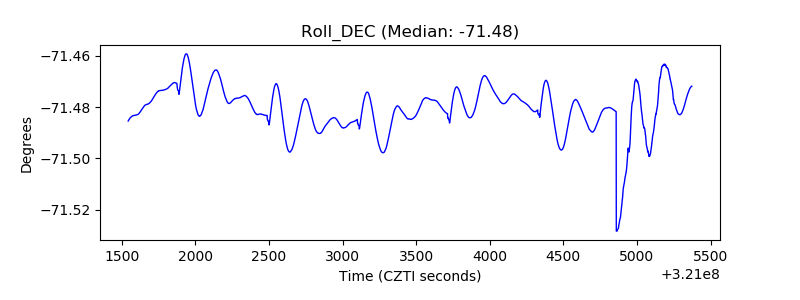 |
| _Roll_RA | 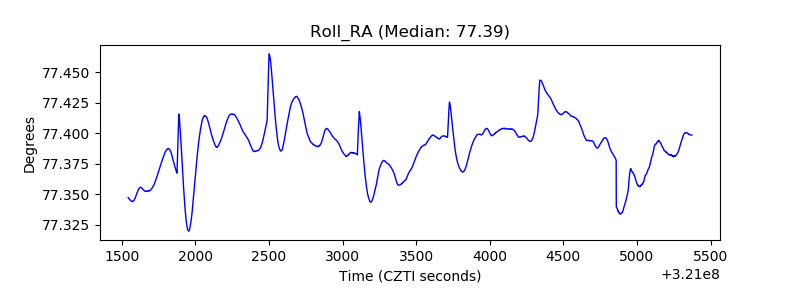 |
| Veto Counter | 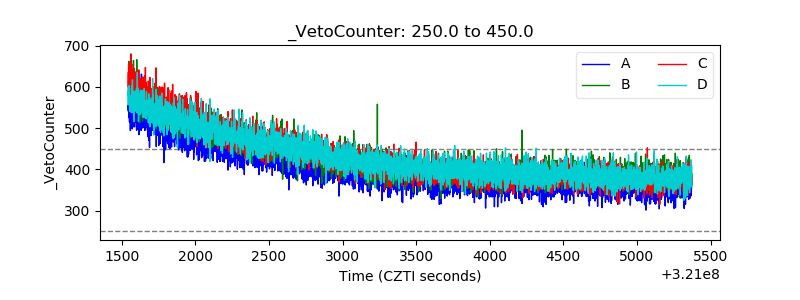 |