| Param | Original file | Final file |
|---|---|---|
| Filename | modeM0/AS1A07_001T03_9000003548cztM0_level2.fits | modeM0/AS1A07_001T03_9000003548cztM0_level2_quad_clean.evt |
| Size (bytes) | 98,435,520 | 97,148,160 |
| Size | 93.9 MB | 92.6 MB |
| Events in quadrant A | 664,494 | 665,469 |
| Events in quadrant B | 622,908 | 656,970 |
| Events in quadrant C | 616,492 | 612,553 |
| Events in quadrant D | 411,540 | 342,305 |
| Mode SS | |||
|---|---|---|---|
| Quadrant | BADHDUFLAG | Total packets | Discarded packets |
| A | 0 | 196 | 0 |
| B | 0 | 196 | 0 |
| C | 0 | 196 | 0 |
| D | 0 | 196 | 0 |
| Mode M9 | |||
|---|---|---|---|
| Quadrant | BADHDUFLAG | Total packets | Discarded packets |
| A | 0 | 23 | 0 |
| B | 0 | 23 | 0 |
| C | 0 | 23 | 0 |
| D | 0 | 23 | 0 |
| Mode M0 | |||
|---|---|---|---|
| Quadrant | BADHDUFLAG | Total packets | Discarded packets |
| A | 0 | 20586 | 0 |
| B | 0 | 20750 | 0 |
| C | 0 | 24932 | 0 |
| D | 0 | 52267 | 0 |
| Quadrant | Total seconds | Saturated seconds | Saturation percentage |
|---|---|---|---|
| A | 9589 | 133 | 1.387006% |
| B | 9572 | 140 | 1.462599% |
| C | 9572 | 421 | 4.398245% |
| D | 9566 | 4321 | 45.170395% |
Noise dominated data is calculated using 1-second bins in cleaned event files. If a bin has >2000 counts, and if more than 50% of those come from <1% of pixels, then it is considered to be noise-dominated and hence unusable.
| Quadrant | # 1 sec bins | Bins with >0 counts | Bins with >2000 counts | High rate bins dominated by noise | Noise dominated (total time) | Noise dominated (detector-on time) | Marked lightcurve |
|---|---|---|---|---|---|---|---|
| A | 12186 | 9608 | 0 | 0 | 0.00% | 0.00% |  |
| B | 12186 | 9588 | 0 | 0 | 0.00% | 0.00% |  |
| C | 12186 | 9596 | 0 | 0 | 0.00% | 0.00% |  |
| D | 12185 | 9348 | 0 | 0 | 0.00% | 0.00% |  |
Top three noisy pixels from each quadrant. If the there are fewer than three noisy pixels in the level2.evt file, extra rows are filled as -1
| Pixel properties | Quadrant properties | ||||||
|---|---|---|---|---|---|---|---|
| Quadrant | DetID | PixID | Counts | Sigma | Mean | Median | Sigma |
| A | 0 | 29 | 592 | 9.7 | 173 | 165 | 44.0 |
| A | 7 | 110 | 541 | 8.55 | 173 | 165 | 44.0 |
| A | 9 | 19 | 512 | 7.89 | 173 | 165 | 44.0 |
| B | 2 | 9 | 511 | 10.23 | 165 | 159 | 34.4 |
| B | 2 | 8 | 428 | 7.82 | 165 | 159 | 34.4 |
| B | 5 | 128 | 414 | 7.41 | 165 | 159 | 34.4 |
| C | 1 | 80 | 489 | 7.86 | 162 | 154 | 42.6 |
| C | 1 | 81 | 486 | 7.79 | 162 | 154 | 42.6 |
| C | 9 | 233 | 414 | 6.1 | 162 | 154 | 42.6 |
| D | 6 | 67 | 318 | 6.5 | 117 | 107 | 32.5 |
| D | 10 | 189 | 303 | 6.03 | 117 | 107 | 32.5 |
| D | 6 | 51 | 301 | 5.97 | 117 | 107 | 32.5 |
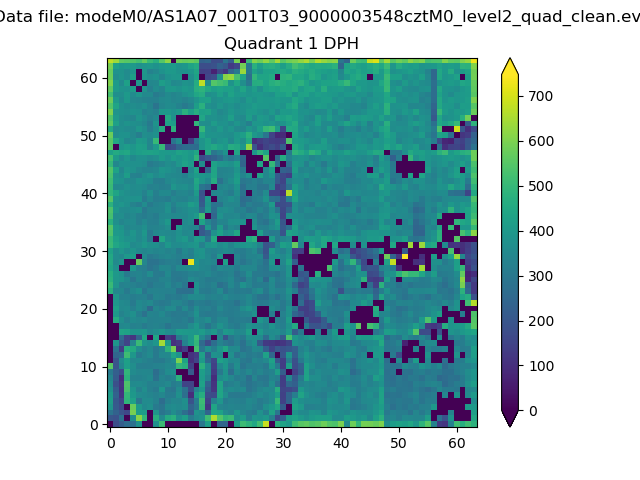
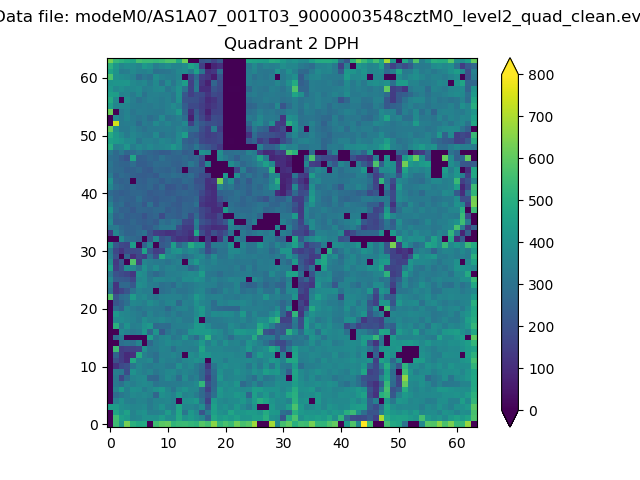
Histogram calculated using DETX and DETY for each event in the final _common_clean file
| Quadrant A |  |
 |
Quadrant B |
|---|---|---|---|
| Quadrant D |  |
 |
Quadrant C |
| Plot type | Count rate plots | Images |
|---|---|---|
| Comparison with Poisson distribution Blue bars denote a histogram of data divided into 1 sec bins. Red curve is a Poisson curve with rate = median count rate of data. |
 |
 |
| Quadrant-wise count rates Data is divided into 100 sec bins |
 |
|
| Module-wise count rates for Quadrant A Data is divided into 100 sec bins |
 |
 |
| Module-wise count rates for Quadrant B Data is divided into 100 sec bins |
 |
 |
| Module-wise count rates for Quadrant C Data is divided into 100 sec bins |
 |
 |
| Module-wise count rates for Quadrant D Data is divided into 100 sec bins |
 |
 |
| Parameter | Plot |
|---|---|
| CZT HV Monitor |  |
| D_VDD |  |
| Temperature 1 |  |
| Veto HV Monitor |  |
| Veto LLD |  |
| Alpha Counter |  |
| _CPM_Rate |  |
| CZT Counter |  |
| +2.5 Volts monitor |  |
| +5 Volts monitor |  |
| _ROLL_ROT |  |
| _Roll_DEC |  |
| _Roll_RA |  |
| Veto Counter |  |