| Param | Original file | Final file |
|---|---|---|
| Filename | modeM0/AS1A07_001T03_9000003548_23969cztM0_level2.evt | modeM0/AS1A07_001T03_9000003548_23969cztM0_level2_quad_clean.evt |
| Size (bytes) | 327,772,800 | 60,422,400 |
| Size | 312.6 MB | 57.6 MB |
| Events in quadrant A | 1,428,413 | 442,299 |
| Events in quadrant B | 1,443,295 | 440,918 |
| Events in quadrant C | 2,170,528 | 413,560 |
| Events in quadrant D | 4,678,767 | 317,826 |
| Mode SS | |||
|---|---|---|---|
| Quadrant | BADHDUFLAG | Total packets | Discarded packets |
| A | 0 | 62 | 0 |
| B | 0 | 62 | 0 |
| C | 0 | 62 | 0 |
| D | 0 | 62 | 0 |
| Mode M0 | |||
|---|---|---|---|
| Quadrant | BADHDUFLAG | Total packets | Discarded packets |
| A | 0 | 6091 | 0 |
| B | 0 | 6108 | 0 |
| C | 0 | 8361 | 0 |
| D | 0 | 16007 | 0 |
| Quadrant | Total seconds | Saturated seconds | Saturation percentage |
|---|---|---|---|
| A | 3005 | 5 | 0.166389% |
| B | 3005 | 2 | 0.066556% |
| C | 3005 | 123 | 4.093178% |
| D | 3005 | 1235 | 41.098170% |
Noise dominated data is calculated using 1-second bins in cleaned event files. If a bin has >2000 counts, and if more than 50% of those come from <1% of pixels, then it is considered to be noise-dominated and hence unusable.
| Quadrant | # 1 sec bins | Bins with >0 counts | Bins with >2000 counts | High rate bins dominated by noise | Noise dominated (total time) | Noise dominated (detector-on time) | Marked lightcurve |
|---|---|---|---|---|---|---|---|
| A | 3005 | 3005 | 0 | 0 | 0.00% | 0.00% | 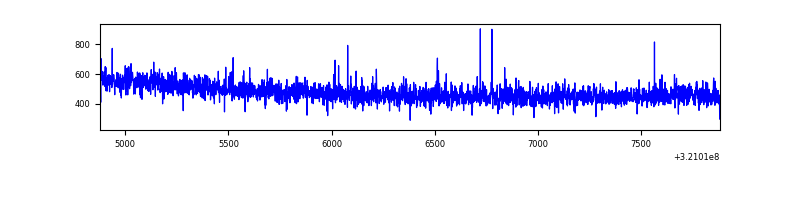 |
| B | 3005 | 3005 | 0 | 0 | 0.00% | 0.00% | 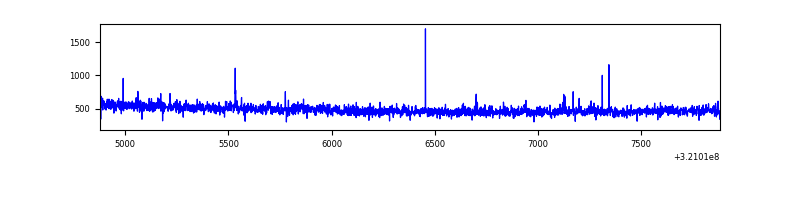 |
| C | 3005 | 3005 | 129 | 129 | 4.29% | 4.29% | 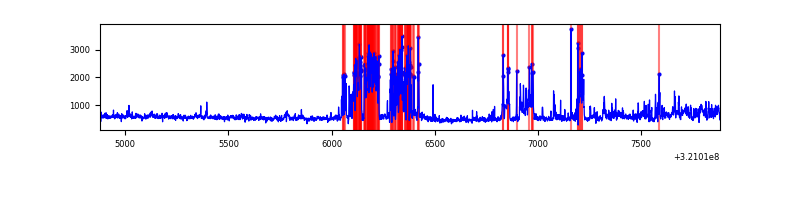 |
| D | 3005 | 3005 | 885 | 885 | 29.45% | 29.45% | 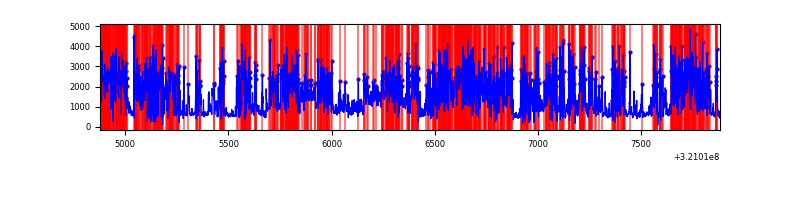 |
Top three noisy pixels from each quadrant. If the there are fewer than three noisy pixels in the level2.evt file, extra rows are filled as -1
| Pixel properties | Quadrant properties | ||||||
|---|---|---|---|---|---|---|---|
| Quadrant | DetID | PixID | Counts | Sigma | Mean | Median | Sigma |
| A | 13 | 254 | 4905 | 60.93 | 370 | 364 | 74.5 |
| A | 0 | 226 | 3374 | 40.39 | 370 | 364 | 74.5 |
| A | 3 | 137 | 2900 | 34.03 | 370 | 364 | 74.5 |
| B | 0 | 197 | 12728 | 182.56 | 363 | 356 | 67.8 |
| B | 12 | 111 | 7249 | 101.71 | 363 | 356 | 67.8 |
| B | 11 | 111 | 6352 | 88.48 | 363 | 356 | 67.8 |
| C | 0 | 239 | 753308 | 9631.49 | 338 | 342 | 78.2 |
| C | 14 | 238 | 55078 | 700.15 | 338 | 342 | 78.2 |
| C | 0 | 10 | 37930 | 480.8 | 338 | 342 | 78.2 |
| D | 12 | 218 | 2787591 | 40359.6 | 278 | 271 | 69.1 |
| D | 2 | 82 | 307702 | 4451.51 | 278 | 271 | 69.1 |
| D | 8 | 195 | 212967 | 3079.78 | 278 | 271 | 69.1 |
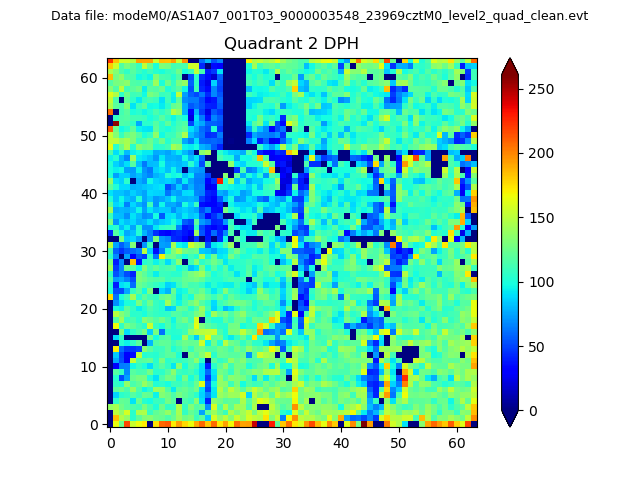
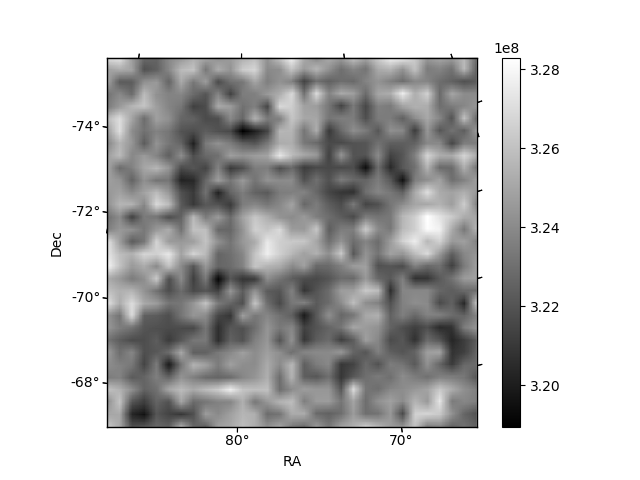
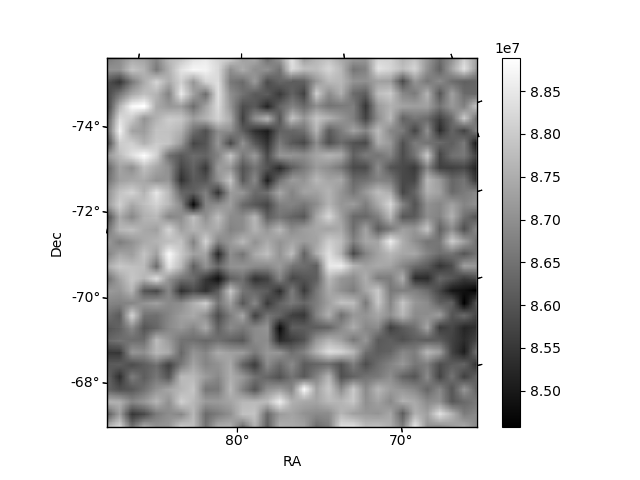
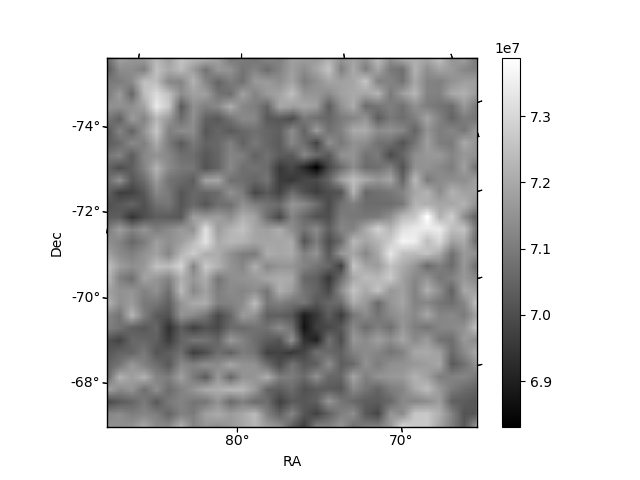
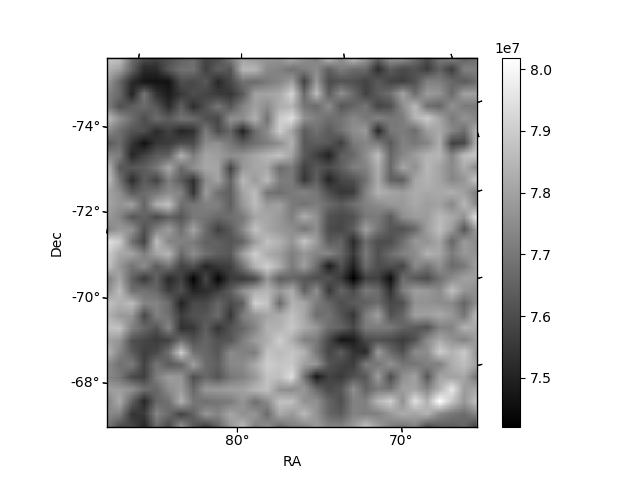
Histogram calculated using DETX and DETY for each event in the final _common_clean file
| Quadrant A | 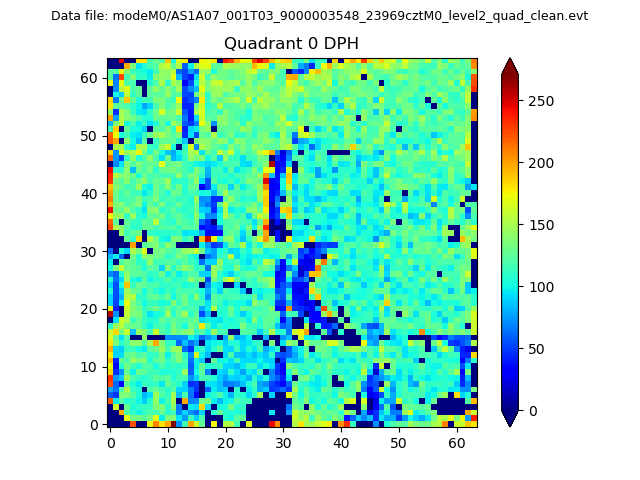 |
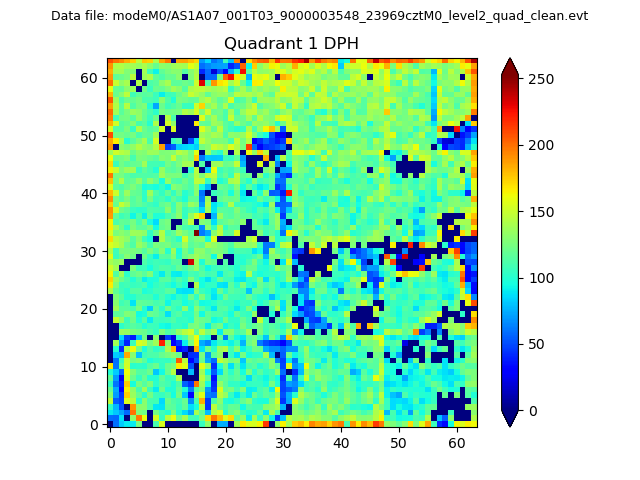 |
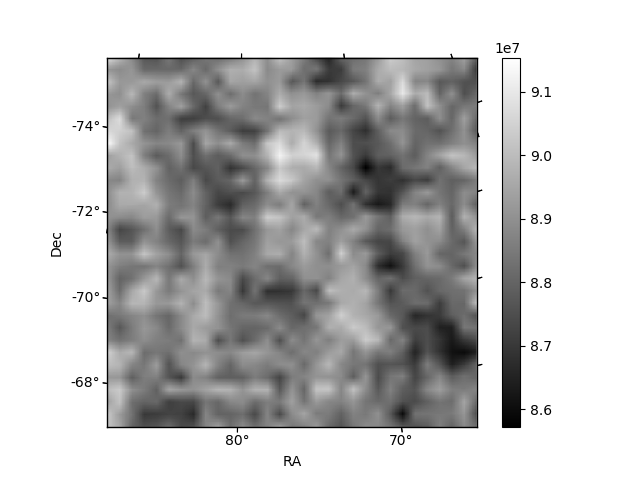
Quadrant B |
|---|---|---|---|
| Quadrant D | 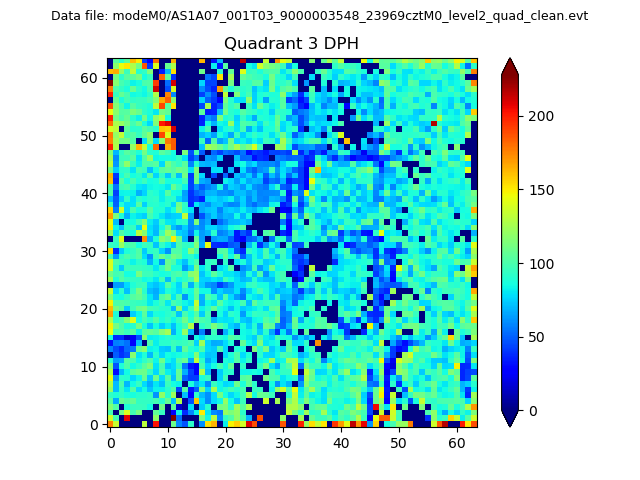 |
 |
Quadrant C |
| Plot type | Count rate plots | Images |
|---|---|---|
| Comparison with Poisson distribution Blue bars denote a histogram of data divided into 1 sec bins. Red curve is a Poisson curve with rate = median count rate of data. |
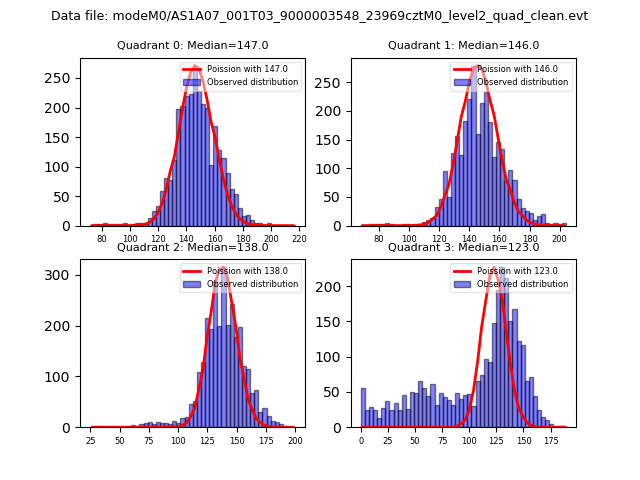 |
 |
| Quadrant-wise count rates Data is divided into 100 sec bins |
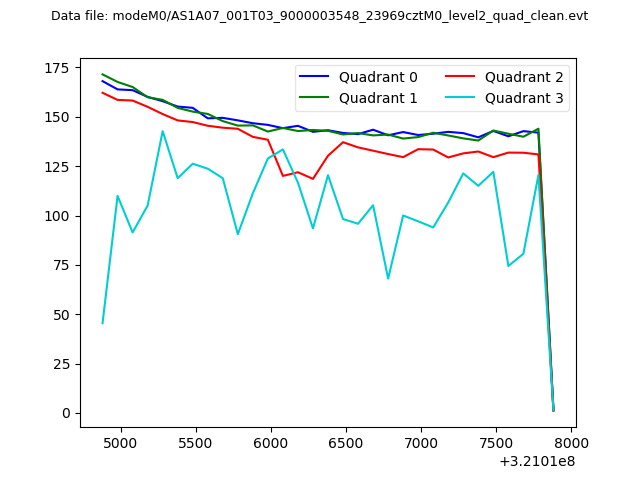 |
|
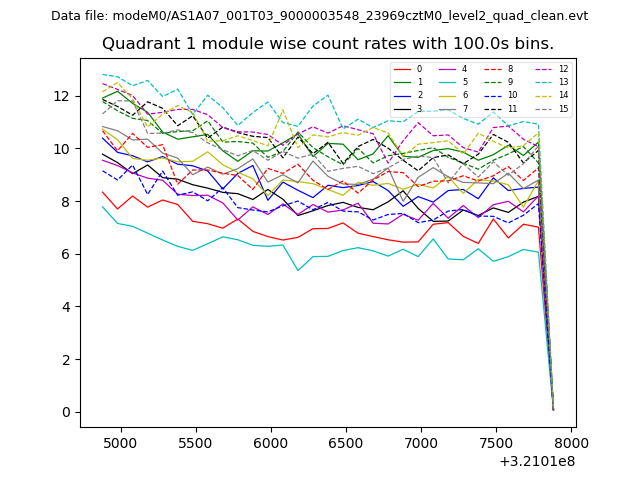
| Module-wise count rates for Quadrant A Data is divided into 100 sec bins |
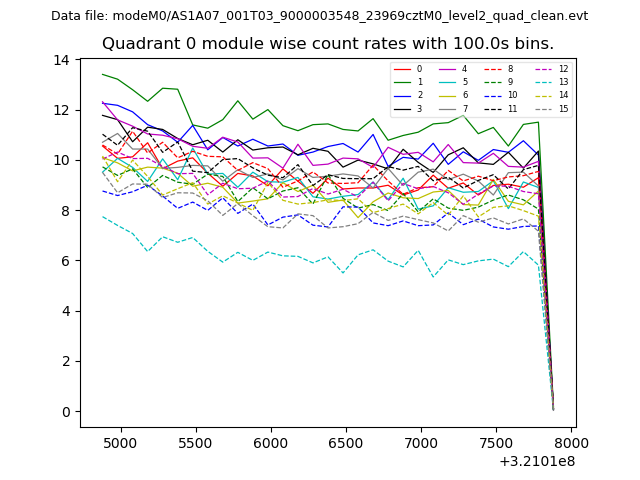 |
 |
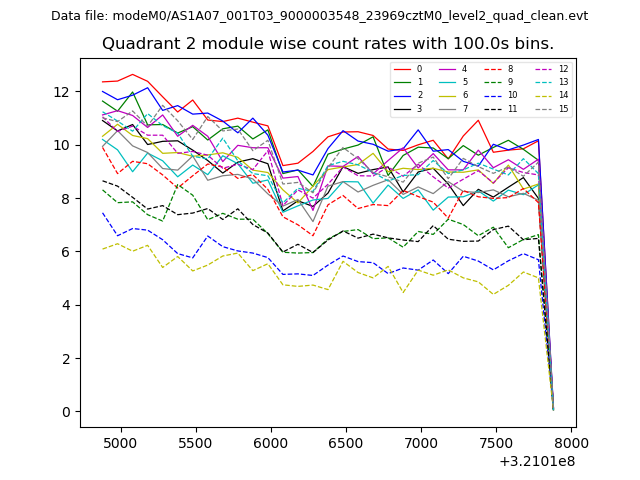
| Module-wise count rates for Quadrant B Data is divided into 100 sec bins |
 |
 |
| Module-wise count rates for Quadrant C Data is divided into 100 sec bins |
 |
 |
| Module-wise count rates for Quadrant D Data is divided into 100 sec bins |
 |
 |
| Parameter | Plot |
|---|---|
| CZT HV Monitor | 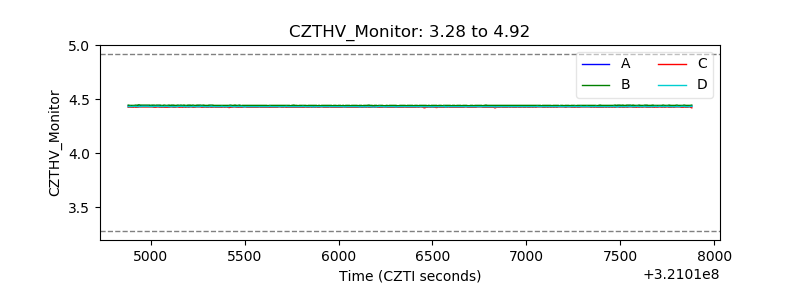 |
| D_VDD | 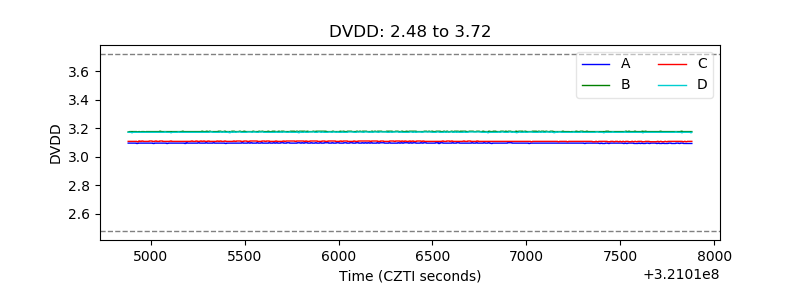 |
| Temperature 1 | 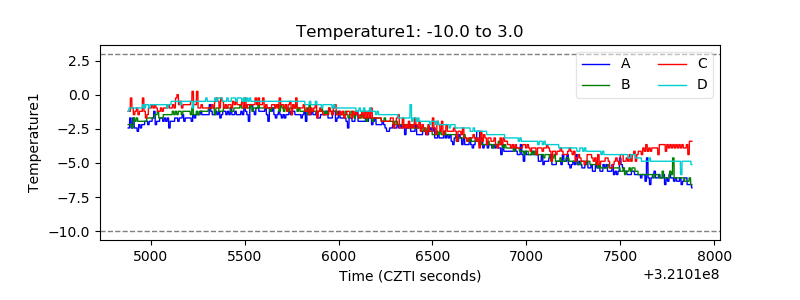 |
| Veto HV Monitor | 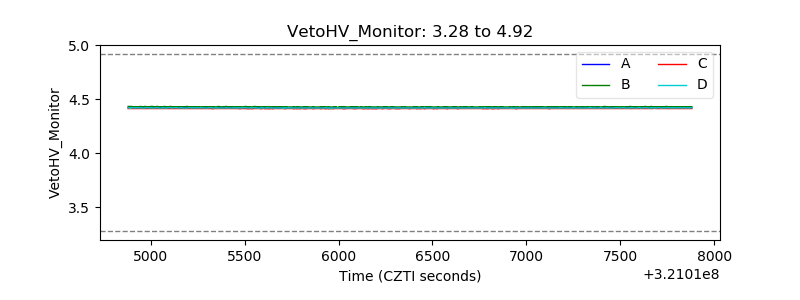 |
| Veto LLD | 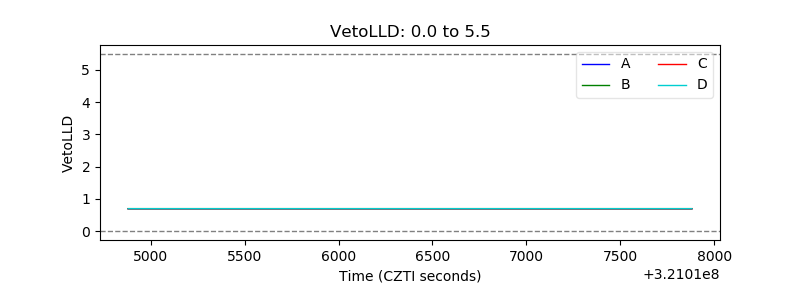 |
| Alpha Counter | 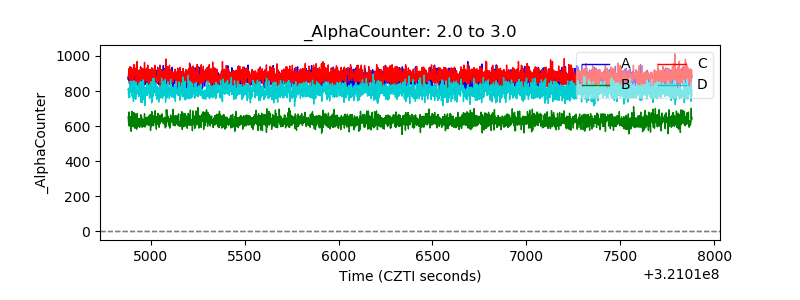 |
| _CPM_Rate | 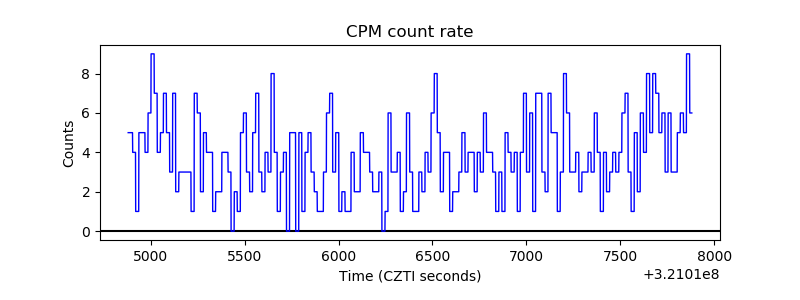 |
| CZT Counter | 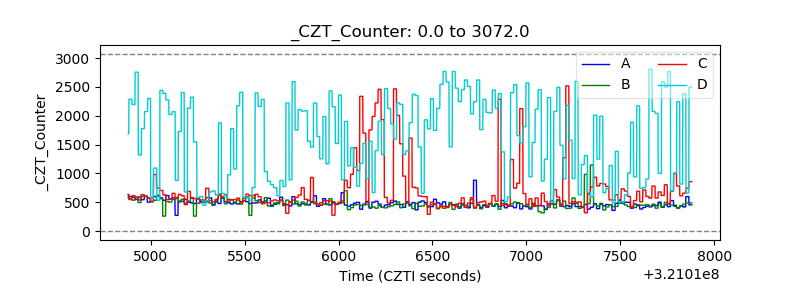 |
| +2.5 Volts monitor |  |
| +5 Volts monitor |  |
| _ROLL_ROT |  |
| _Roll_DEC | 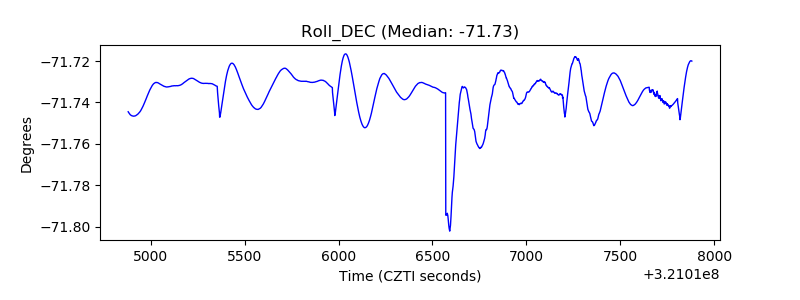 |
| _Roll_RA | 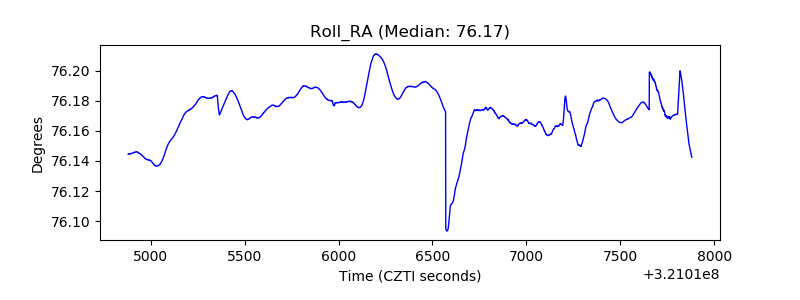 |
| Veto Counter | 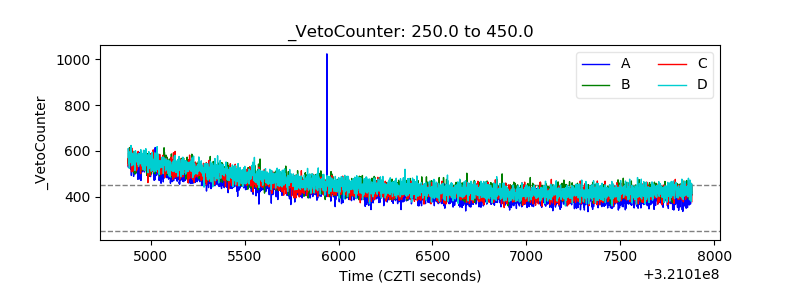 |