| Param | Original file | Final file |
|---|---|---|
| Filename | modeM0/AS1A07_001T04_9000003552cztM0_level2.fits | modeM0/AS1A07_001T04_9000003552cztM0_level2_quad_clean.evt |
| Size (bytes) | 87,992,640 | 101,220,480 |
| Size | 83.9 MB | 96.5 MB |
| Events in quadrant A | 579,458 | 684,565 |
| Events in quadrant B | 542,494 | 671,689 |
| Events in quadrant C | 539,730 | 627,756 |
| Events in quadrant D | 378,848 | 457,483 |
| Mode M0 | |||
|---|---|---|---|
| Quadrant | BADHDUFLAG | Total packets | Discarded packets |
| A | 0 | 18676 | 0 |
| B | 0 | 20238 | 0 |
| C | 0 | 19257 | 0 |
| D | 0 | 35338 | 0 |
| Mode SS | |||
|---|---|---|---|
| Quadrant | BADHDUFLAG | Total packets | Discarded packets |
| A | 0 | 184 | 0 |
| B | 0 | 184 | 0 |
| C | 0 | 184 | 0 |
| D | 0 | 184 | 0 |
| Mode M9 | |||
|---|---|---|---|
| Quadrant | BADHDUFLAG | Total packets | Discarded packets |
| A | 0 | 23 | 0 |
| B | 0 | 23 | 0 |
| C | 0 | 23 | 0 |
| D | 0 | 23 | 0 |
| Quadrant | Total seconds | Saturated seconds | Saturation percentage |
|---|---|---|---|
| A | 8980 | 119 | 1.325167% |
| B | 8980 | 189 | 2.104677% |
| C | 8980 | 203 | 2.260579% |
| D | 8980 | 2668 | 29.710468% |
Noise dominated data is calculated using 1-second bins in cleaned event files. If a bin has >2000 counts, and if more than 50% of those come from <1% of pixels, then it is considered to be noise-dominated and hence unusable.
| Quadrant | # 1 sec bins | Bins with >0 counts | Bins with >2000 counts | High rate bins dominated by noise | Noise dominated (total time) | Noise dominated (detector-on time) | Marked lightcurve |
|---|---|---|---|---|---|---|---|
| A | 11365 | 8979 | 0 | 0 | 0.00% | 0.00% | 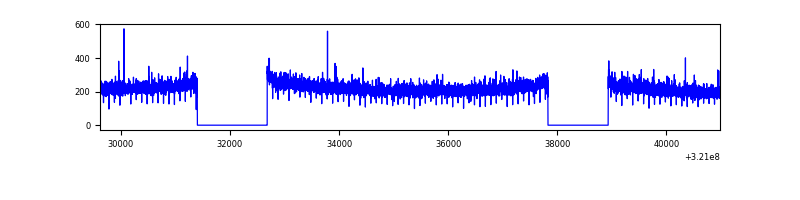 |
| B | 11365 | 8979 | 0 | 0 | 0.00% | 0.00% | 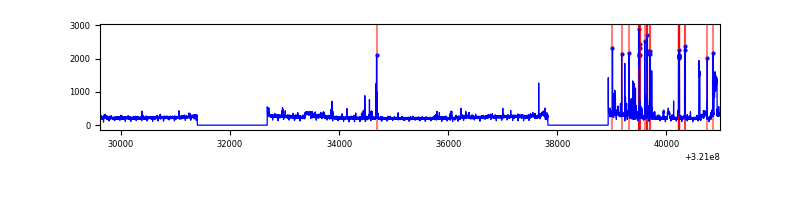 |
| C | 11365 | 8979 | 0 | 0 | 0.00% | 0.00% | 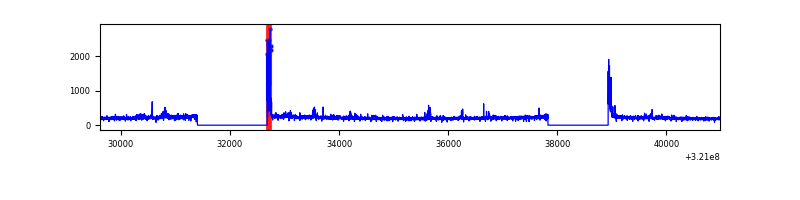 |
| D | 11365 | 8512 | 0 | 0 | 0.00% | 0.00% | 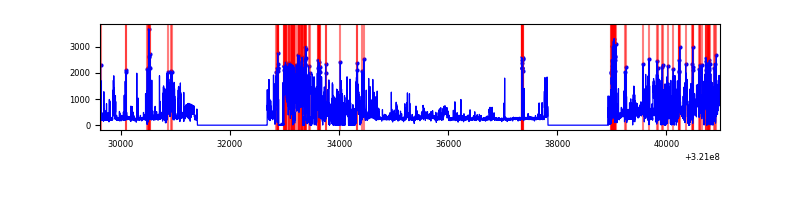 |
Top three noisy pixels from each quadrant. If the there are fewer than three noisy pixels in the level2.evt file, extra rows are filled as -1
| Pixel properties | Quadrant properties | ||||||
|---|---|---|---|---|---|---|---|
| Quadrant | DetID | PixID | Counts | Sigma | Mean | Median | Sigma |
| A | 0 | 29 | 530 | 9.95 | 150 | 142 | 39.0 |
| A | 7 | 110 | 457 | 8.08 | 150 | 142 | 39.0 |
| A | 9 | 19 | 441 | 7.67 | 150 | 142 | 39.0 |
| B | 2 | 9 | 400 | 8.74 | 144 | 138 | 30.0 |
| B | 14 | 254 | 369 | 7.71 | 144 | 138 | 30.0 |
| B | 5 | 225 | 344 | 6.87 | 144 | 138 | 30.0 |
| C | 3 | 234 | 407 | 7.23 | 142 | 134 | 37.7 |
| C | 12 | 241 | 397 | 6.97 | 142 | 134 | 37.7 |
| C | 1 | 80 | 389 | 6.76 | 142 | 134 | 37.7 |
| D | 10 | 189 | 293 | 6.42 | 108 | 99 | 30.2 |
| D | 6 | 62 | 283 | 6.09 | 108 | 99 | 30.2 |
| D | 15 | 46 | 278 | 5.93 | 108 | 99 | 30.2 |
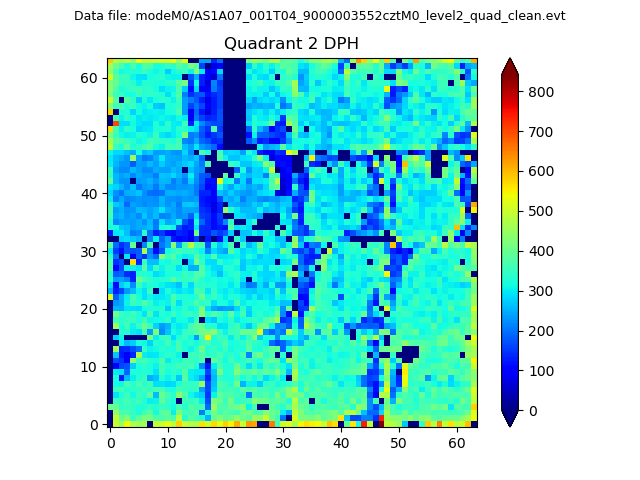
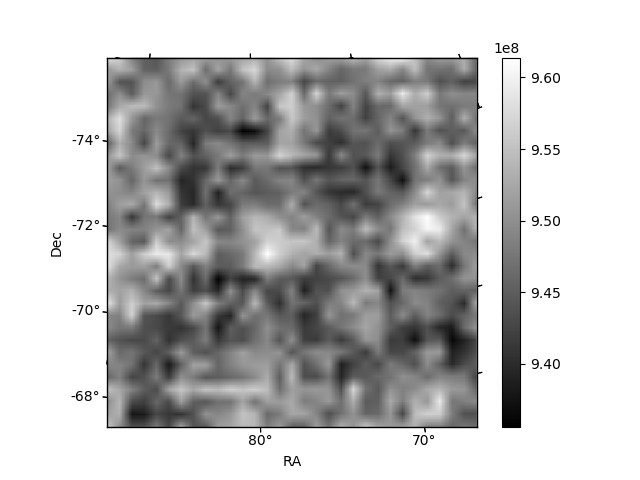
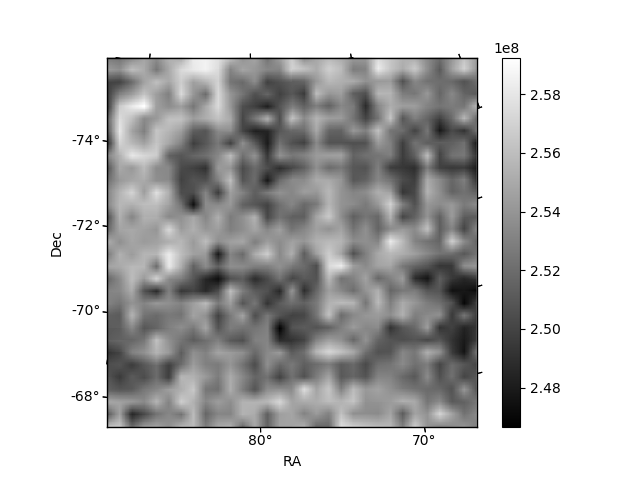
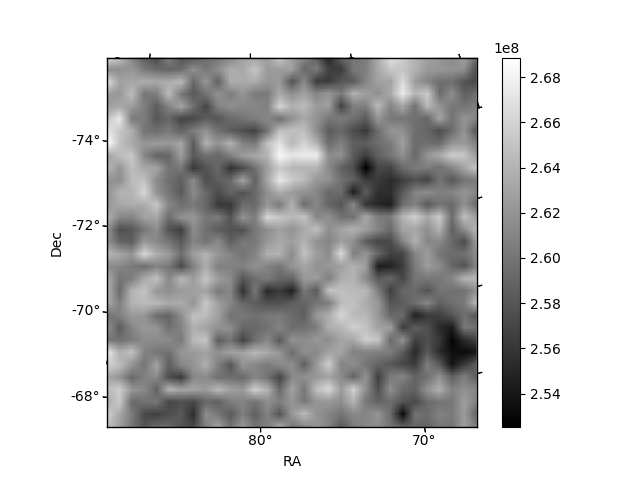
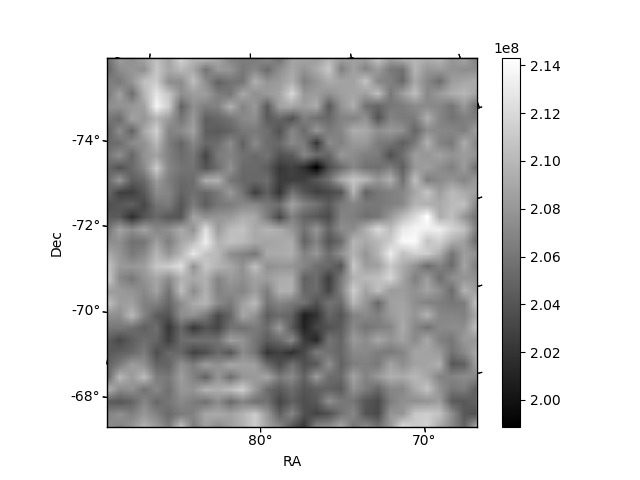
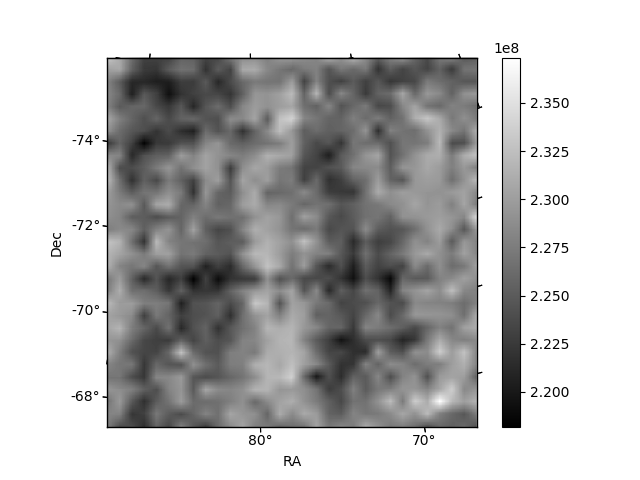
Histogram calculated using DETX and DETY for each event in the final _common_clean file
| Quadrant A | 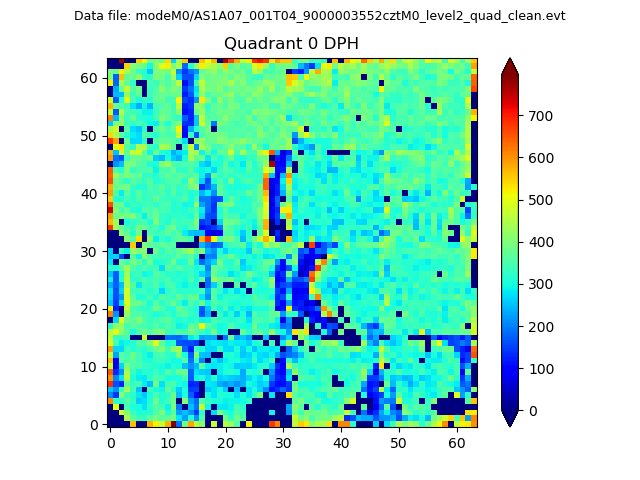 |
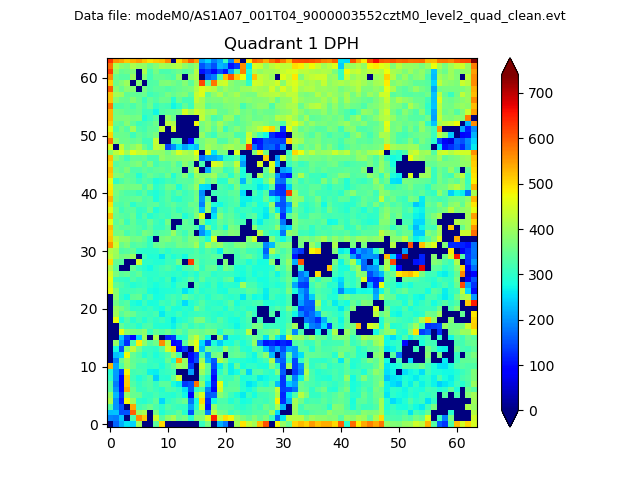 |
Quadrant B |
|---|---|---|---|
| Quadrant D | 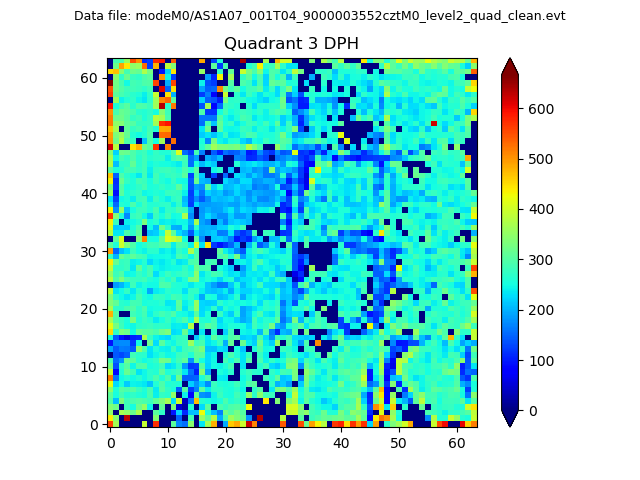 |
 |
Quadrant C |
| Plot type | Count rate plots | Images |
|---|---|---|
| Comparison with Poisson distribution Blue bars denote a histogram of data divided into 1 sec bins. Red curve is a Poisson curve with rate = median count rate of data. |
 |
 |
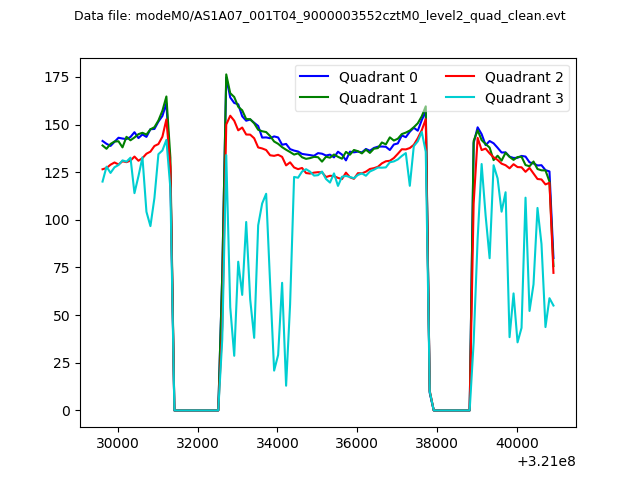
| Quadrant-wise count rates Data is divided into 100 sec bins |
 |
|
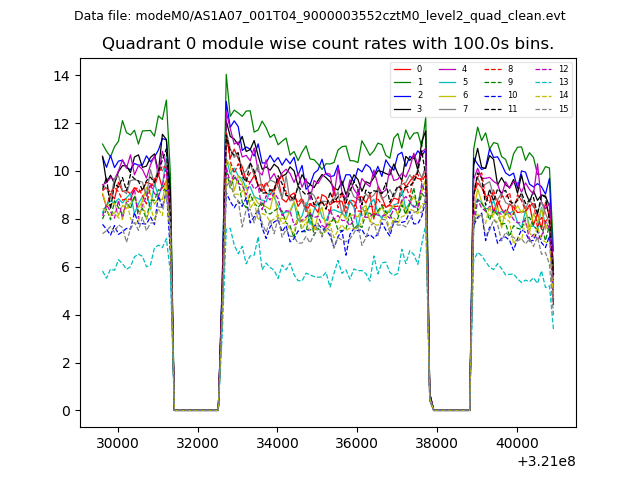
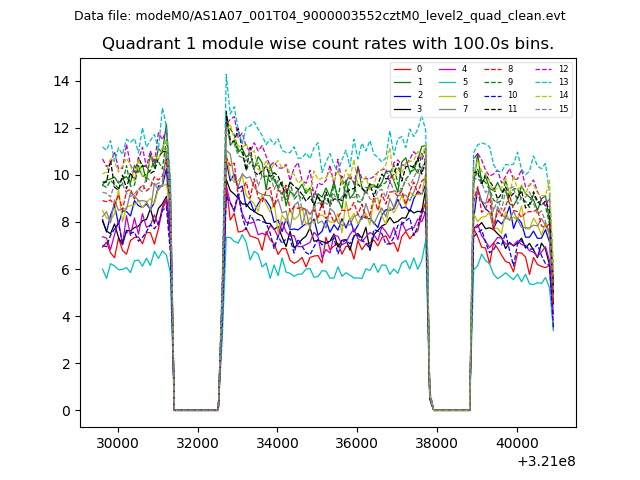
| Module-wise count rates for Quadrant A Data is divided into 100 sec bins |
 |
 |
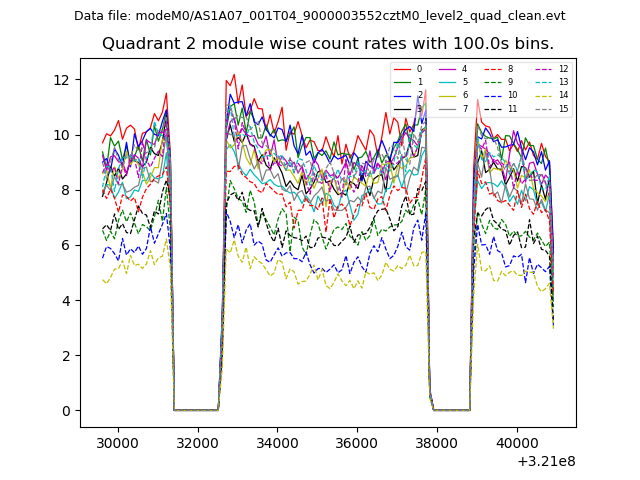
| Module-wise count rates for Quadrant B Data is divided into 100 sec bins |
 |
 |
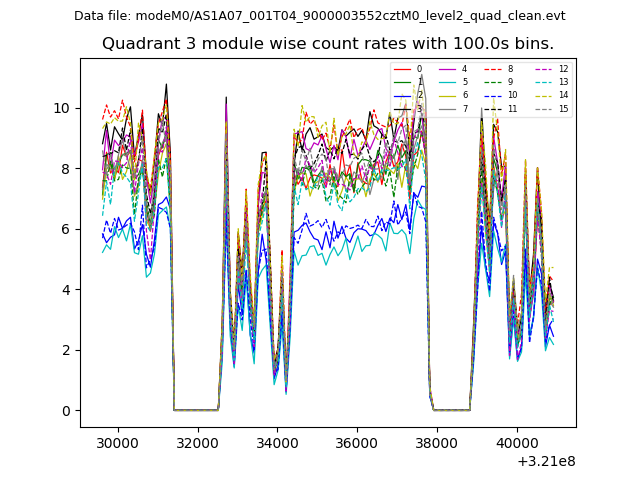
| Module-wise count rates for Quadrant C Data is divided into 100 sec bins |
 |
 |
| Module-wise count rates for Quadrant D Data is divided into 100 sec bins |
 |
 |
| Parameter | Plot |
|---|---|
| CZT HV Monitor | 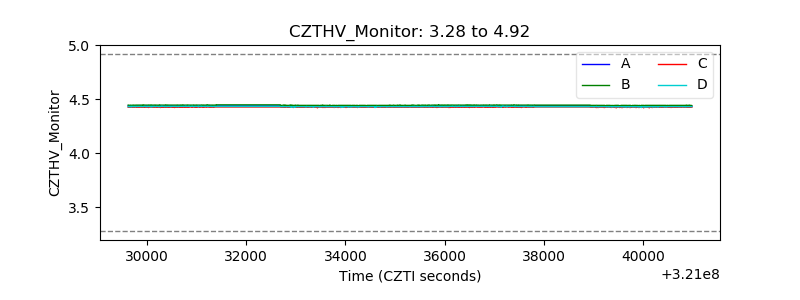 |
| D_VDD | 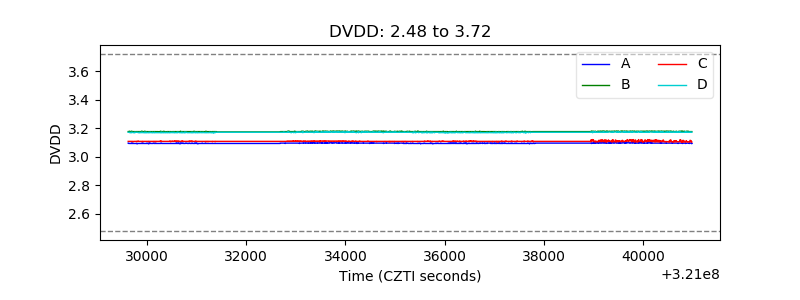 |
| Temperature 1 | 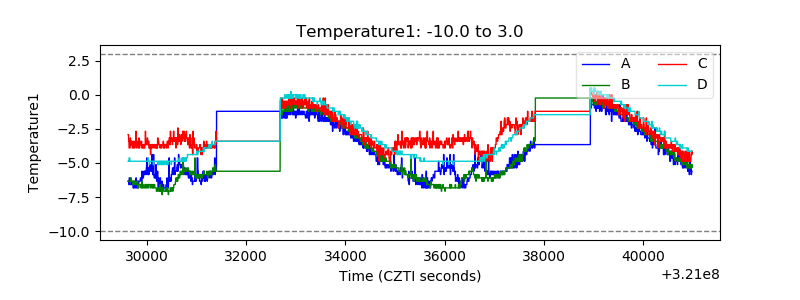 |
| Veto HV Monitor | 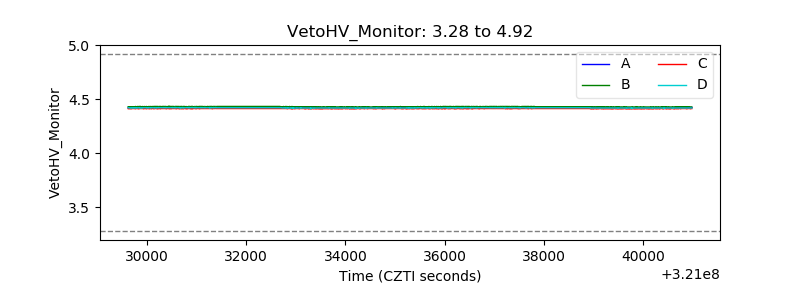 |
| Veto LLD | 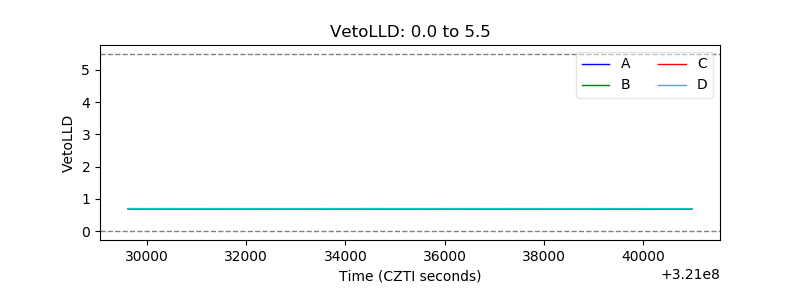 |
| Alpha Counter | 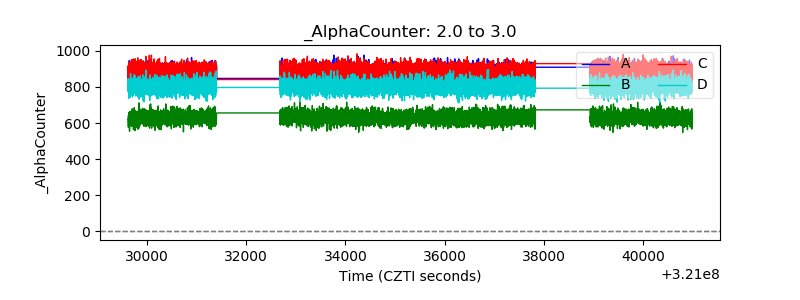 |
| _CPM_Rate | 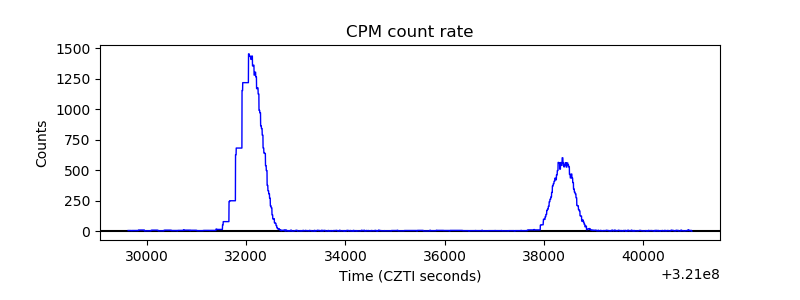 |
| CZT Counter | 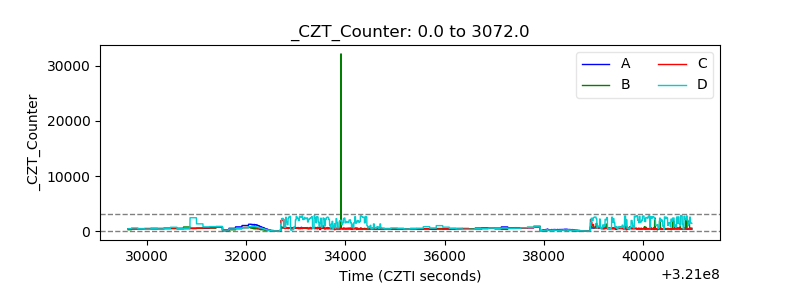 |
| +2.5 Volts monitor | 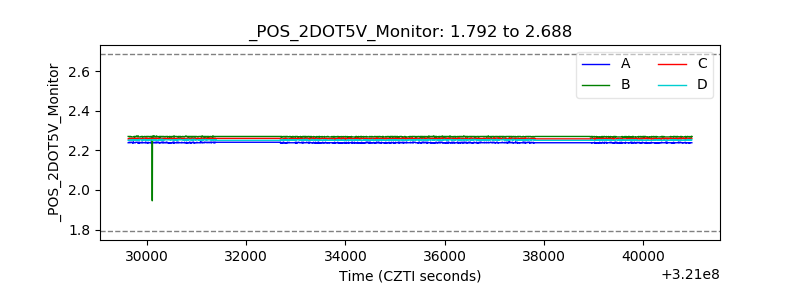 |
| +5 Volts monitor | 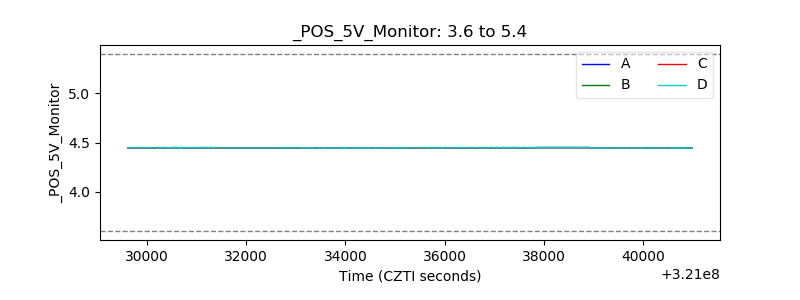 |
| _ROLL_ROT | 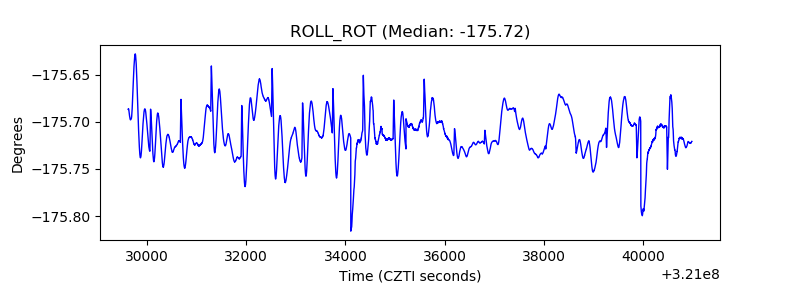 |
| _Roll_DEC | 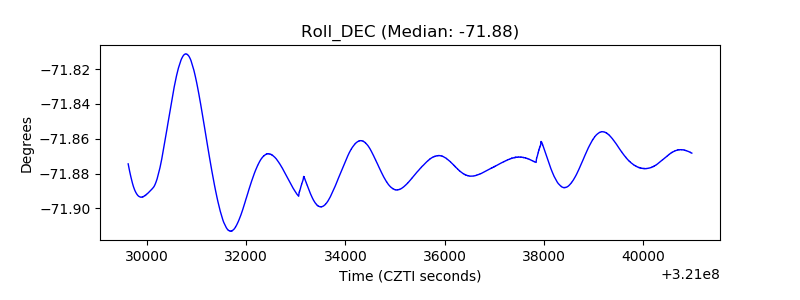 |
| _Roll_RA | 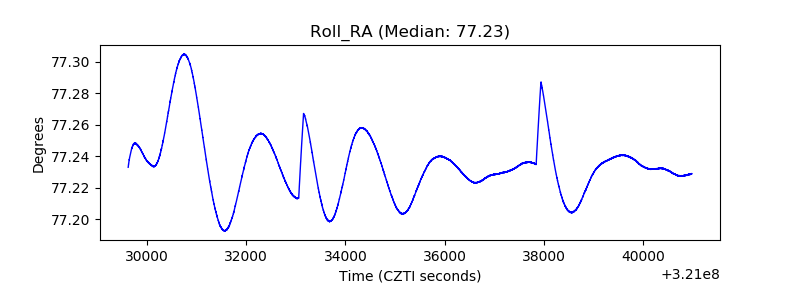 |
| Veto Counter | 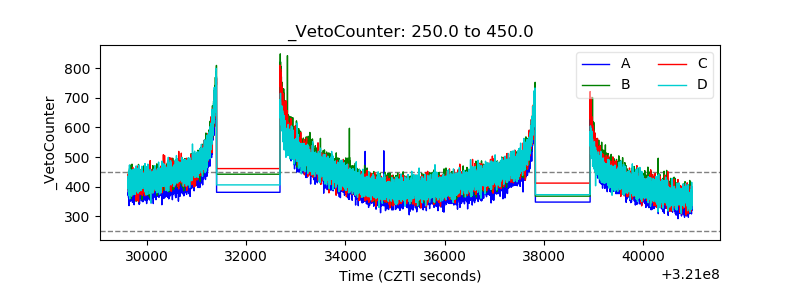 |