| Param | Original file | Final file |
|---|---|---|
| Filename | modeM0/AS1A07_001T04_9000003552_23971cztM0_level2.evt | modeM0/AS1A07_001T04_9000003552_23971cztM0_level2_quad_clean.evt |
| Size (bytes) | 304,185,600 | 64,033,920 |
| Size | 290.1 MB | 61.1 MB |
| Events in quadrant A | 1,631,187 | 473,200 |
| Events in quadrant B | 1,675,136 | 476,673 |
| Events in quadrant C | 1,728,534 | 438,409 |
| Events in quadrant D | 3,959,912 | 324,388 |
| Mode M0 | |||
|---|---|---|---|
| Quadrant | BADHDUFLAG | Total packets | Discarded packets |
| A | 0 | 6758 | 1 |
| B | 0 | 6912 | 1 |
| C | 0 | 7094 | 1 |
| D | 0 | 13885 | 1 |
| Mode SS | |||
|---|---|---|---|
| Quadrant | BADHDUFLAG | Total packets | Discarded packets |
| A | 0 | 66 | 0 |
| B | 0 | 66 | 0 |
| C | 0 | 66 | 0 |
| D | 0 | 66 | 0 |
| Mode M9 | |||
|---|---|---|---|
| Quadrant | BADHDUFLAG | Total packets | Discarded packets |
| A | 0 | 12 | 0 |
| B | 0 | 12 | 0 |
| C | 0 | 12 | 0 |
| D | 0 | 12 | 0 |
| Quadrant | Total seconds | Saturated seconds | Saturation percentage |
|---|---|---|---|
| A | 3175 | 72 | 2.267717% |
| B | 3175 | 63 | 1.984252% |
| C | 3175 | 107 | 3.370079% |
| D | 3175 | 1264 | 39.811024% |
Noise dominated data is calculated using 1-second bins in cleaned event files. If a bin has >2000 counts, and if more than 50% of those come from <1% of pixels, then it is considered to be noise-dominated and hence unusable.
| Quadrant | # 1 sec bins | Bins with >0 counts | Bins with >2000 counts | High rate bins dominated by noise | Noise dominated (total time) | Noise dominated (detector-on time) | Marked lightcurve |
|---|---|---|---|---|---|---|---|
| A | 4455 | 3176 | 0 | 0 | 0.00% | 0.00% | 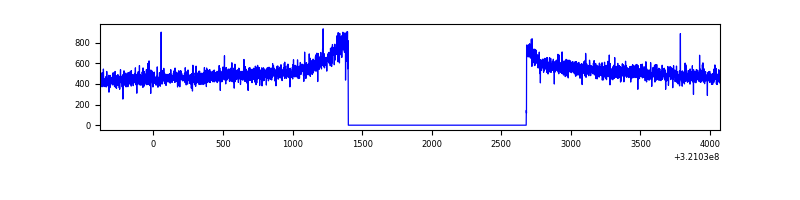 |
| B | 4455 | 3176 | 0 | 0 | 0.00% | 0.00% | 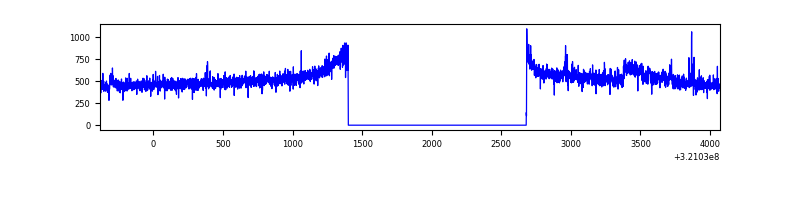 |
| C | 4455 | 3176 | 22 | 22 | 0.49% | 0.69% | 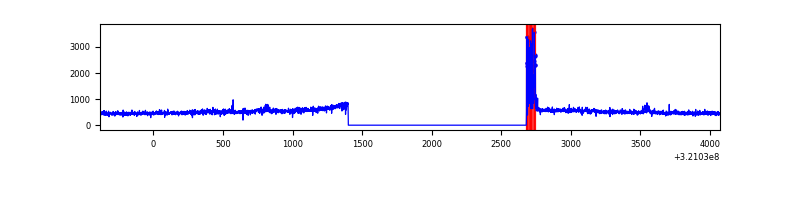 |
| D | 4454 | 3175 | 694 | 694 | 15.58% | 21.86% | 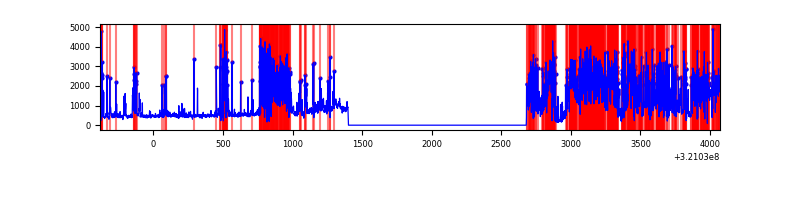 |
Top three noisy pixels from each quadrant. If the there are fewer than three noisy pixels in the level2.evt file, extra rows are filled as -1
| Pixel properties | Quadrant properties | ||||||
|---|---|---|---|---|---|---|---|
| Quadrant | DetID | PixID | Counts | Sigma | Mean | Median | Sigma |
| A | 13 | 254 | 5554 | 59.46 | 423 | 415 | 86.4 |
| A | 0 | 226 | 3724 | 38.29 | 423 | 415 | 86.4 |
| A | 3 | 137 | 3549 | 36.26 | 423 | 415 | 86.4 |
| B | 4 | 200 | 30406 | 379.7 | 417 | 406 | 79.0 |
| B | 12 | 111 | 9018 | 108.99 | 417 | 406 | 79.0 |
| B | 11 | 111 | 7859 | 94.33 | 417 | 406 | 79.0 |
| C | 0 | 10 | 111015 | 1221.55 | 393 | 395 | 90.6 |
| C | 14 | 238 | 64220 | 704.81 | 393 | 395 | 90.6 |
| C | 7 | 221 | 17111 | 184.59 | 393 | 395 | 90.6 |
| D | 12 | 218 | 2200190 | 28328.89 | 313 | 303 | 77.7 |
| D | 2 | 82 | 207236 | 2664.77 | 313 | 303 | 77.7 |
| D | 12 | 250 | 137958 | 1772.64 | 313 | 303 | 77.7 |
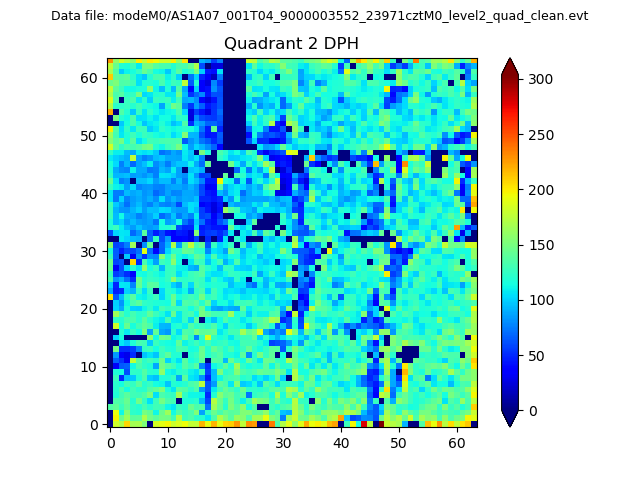
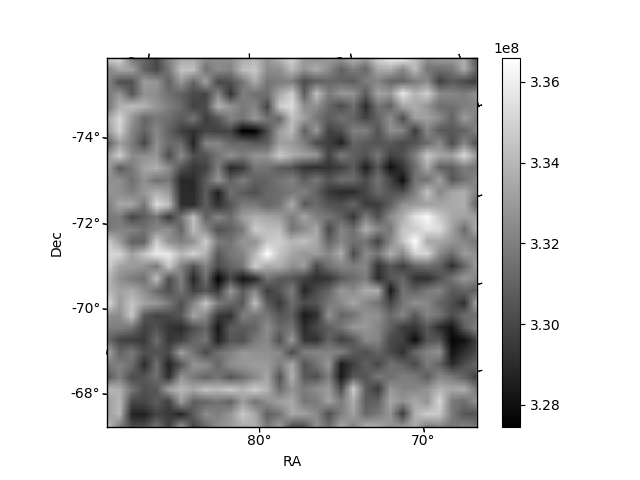
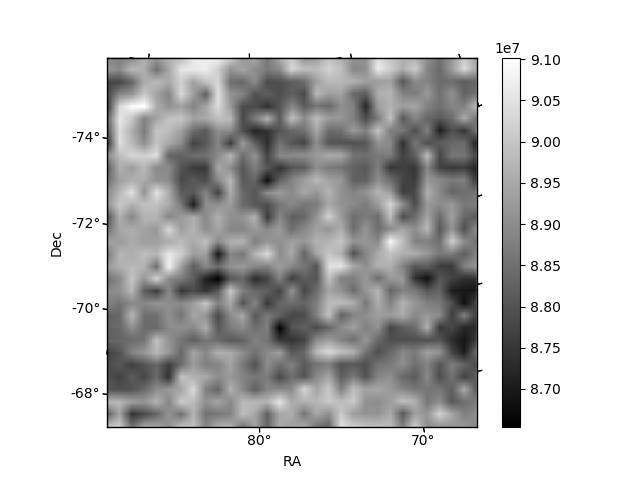
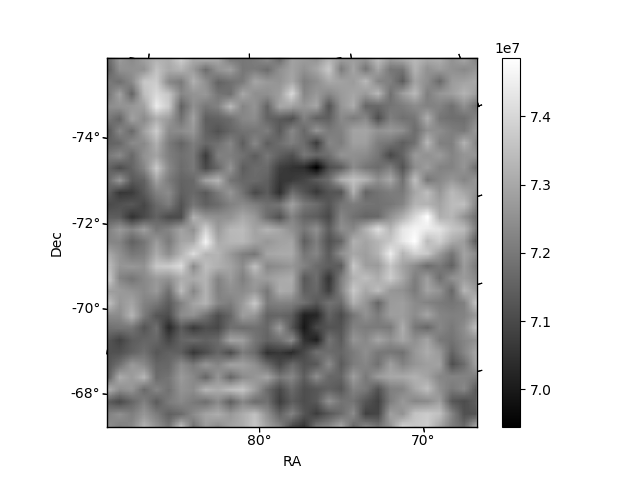
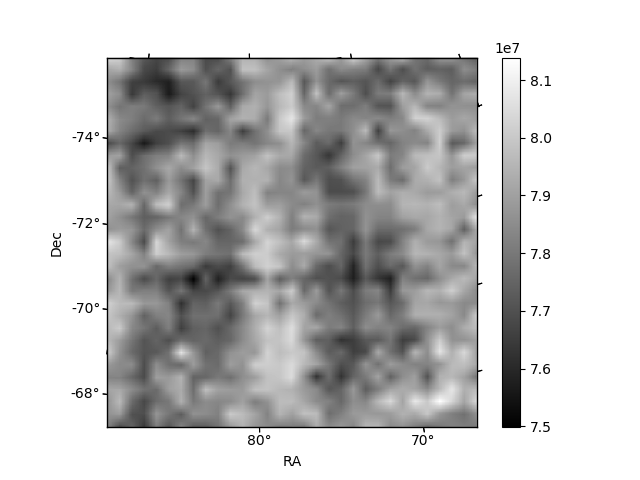
Histogram calculated using DETX and DETY for each event in the final _common_clean file
| Quadrant A | 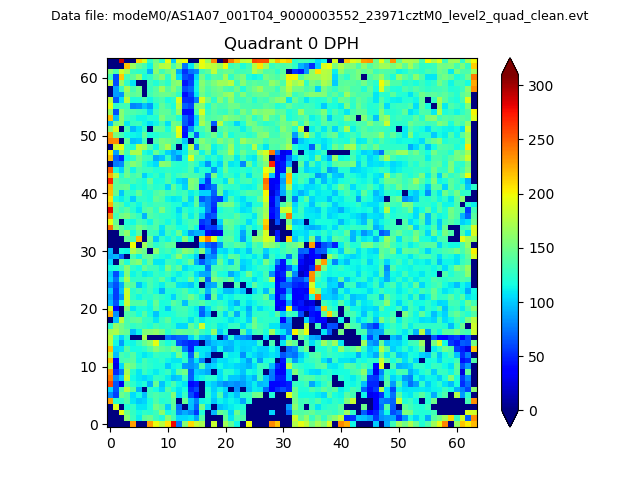 |
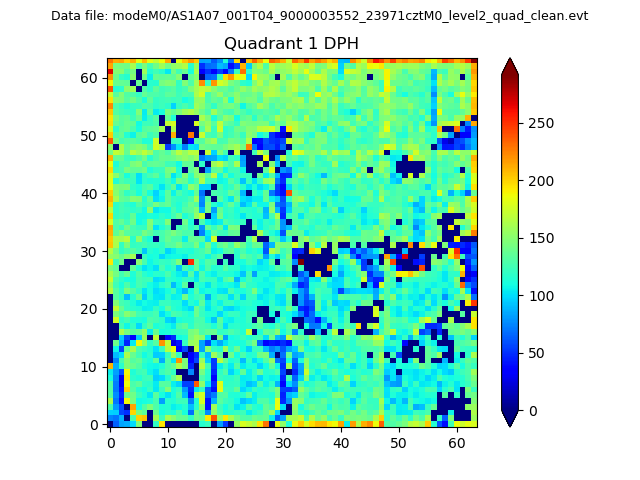 |
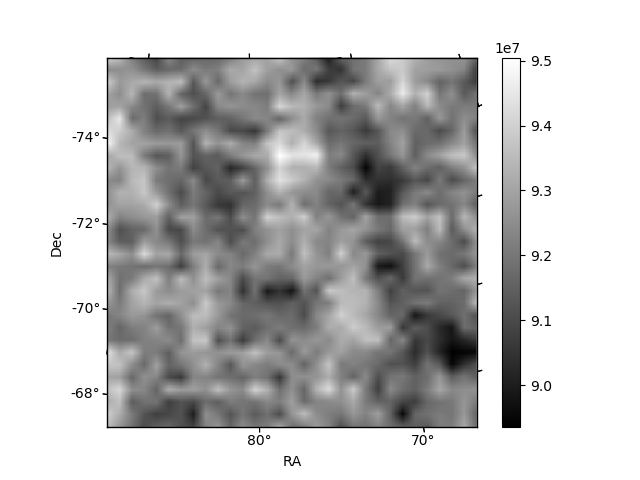
Quadrant B |
|---|---|---|---|
| Quadrant D | 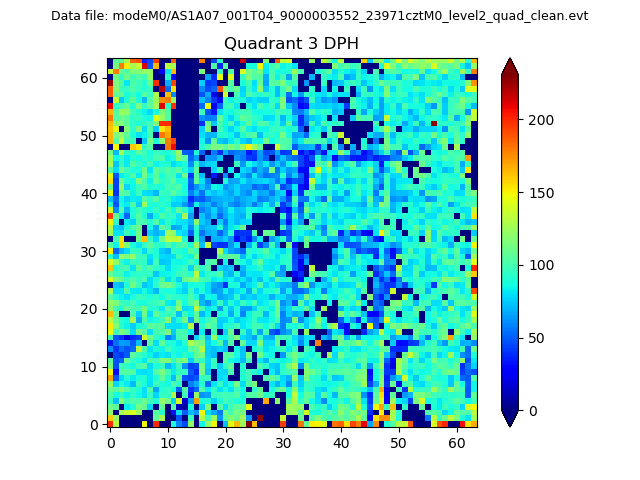 |
 |
Quadrant C |
| Plot type | Count rate plots | Images |
|---|---|---|
| Comparison with Poisson distribution Blue bars denote a histogram of data divided into 1 sec bins. Red curve is a Poisson curve with rate = median count rate of data. |
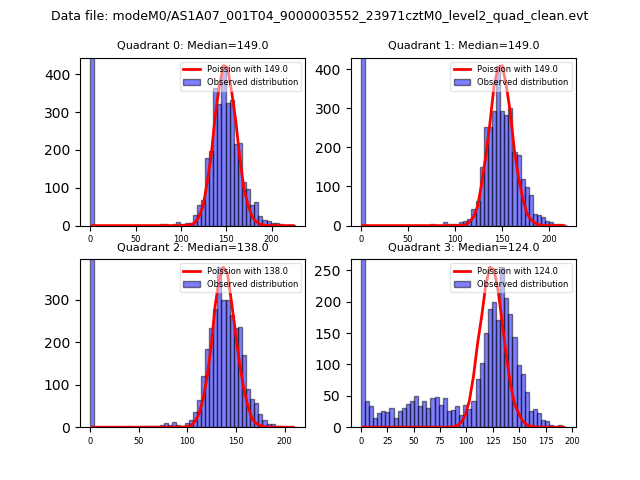 |
 |
| Quadrant-wise count rates Data is divided into 100 sec bins |
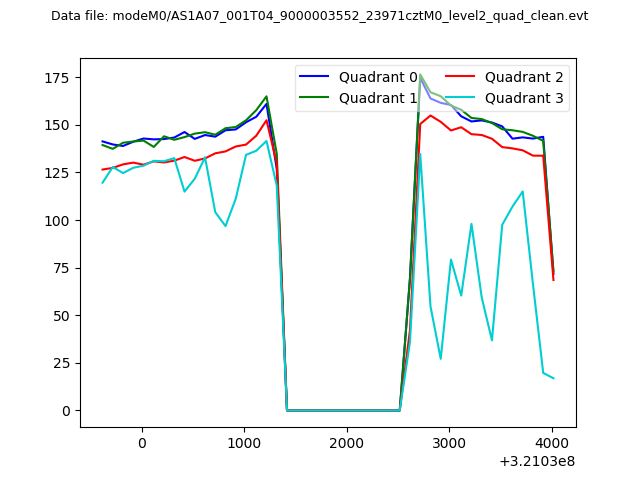 |
|
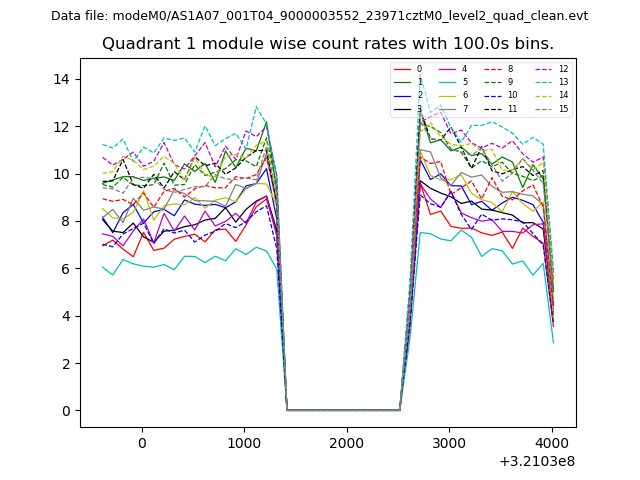
| Module-wise count rates for Quadrant A Data is divided into 100 sec bins |
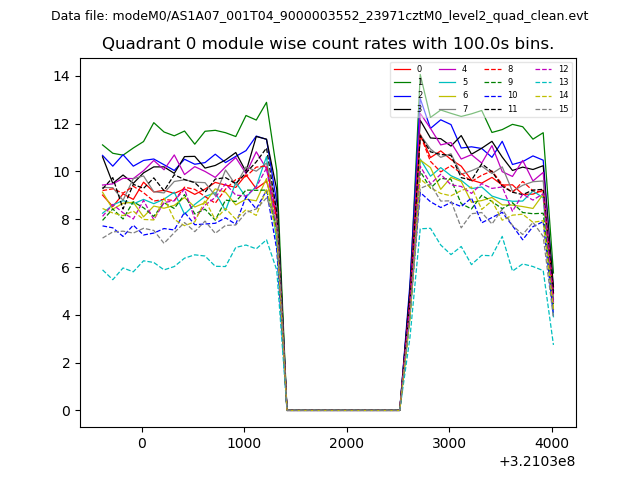 |
 |
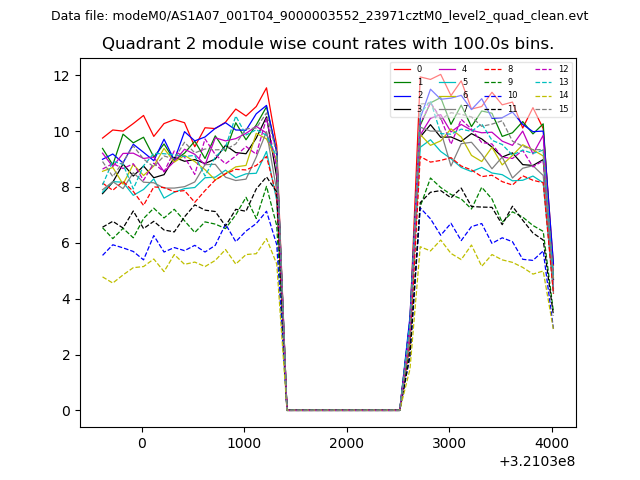
| Module-wise count rates for Quadrant B Data is divided into 100 sec bins |
 |
 |
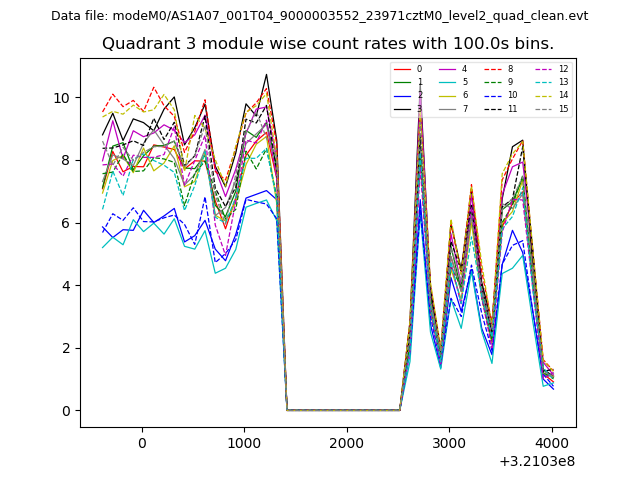
| Module-wise count rates for Quadrant C Data is divided into 100 sec bins |
 |
 |
| Module-wise count rates for Quadrant D Data is divided into 100 sec bins |
 |
 |
| Parameter | Plot |
|---|---|
| CZT HV Monitor | 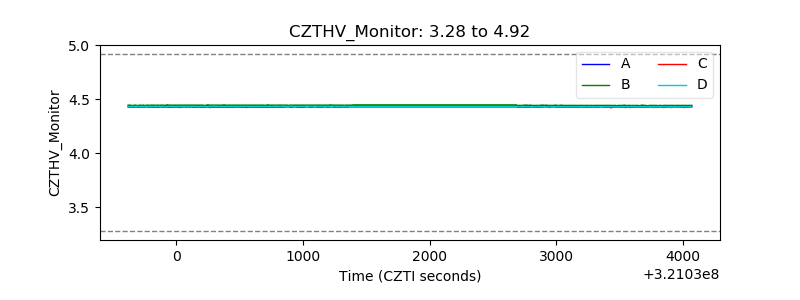 |
| D_VDD | 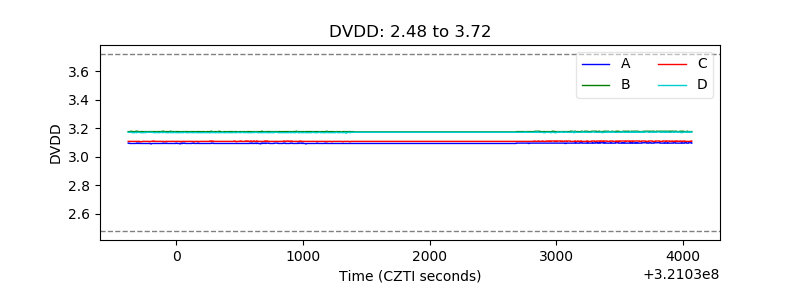 |
| Temperature 1 | 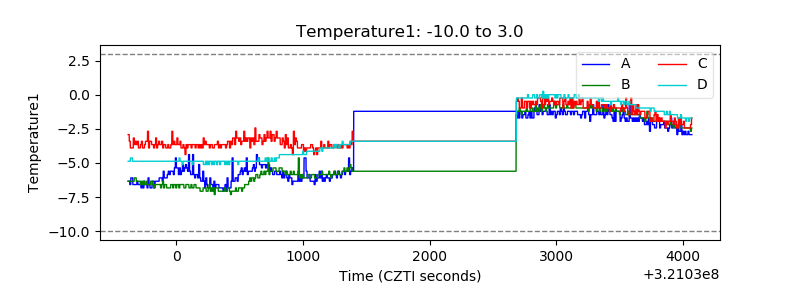 |
| Veto HV Monitor | 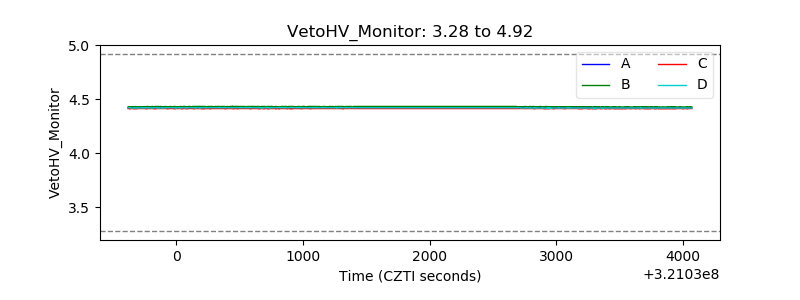 |
| Veto LLD | 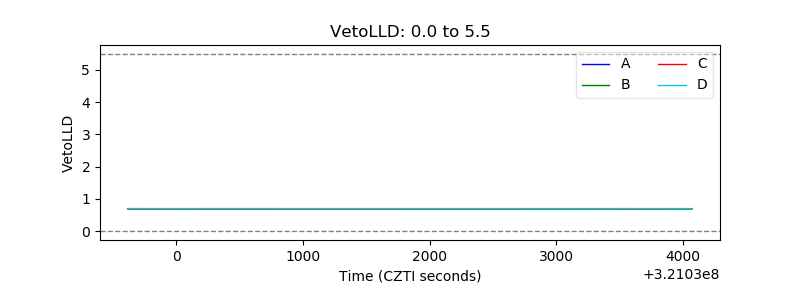 |
| Alpha Counter | 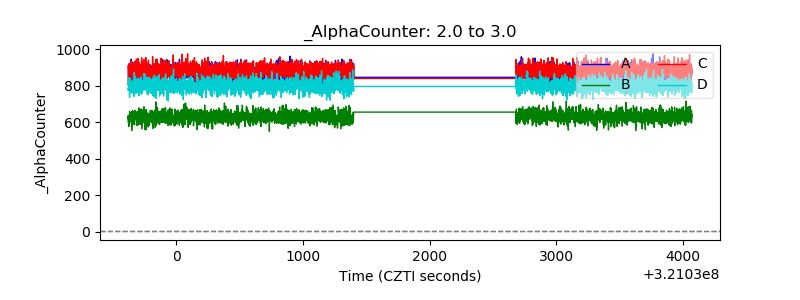 |
| _CPM_Rate | 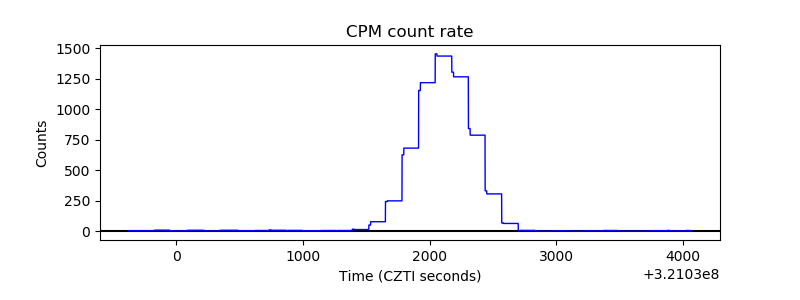 |
| CZT Counter | 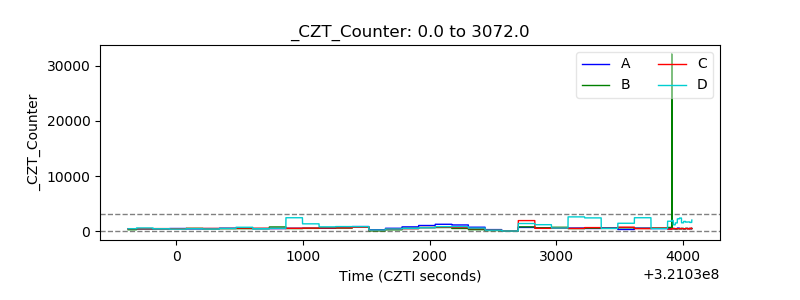 |
| +2.5 Volts monitor |  |
| +5 Volts monitor |  |
| _ROLL_ROT | 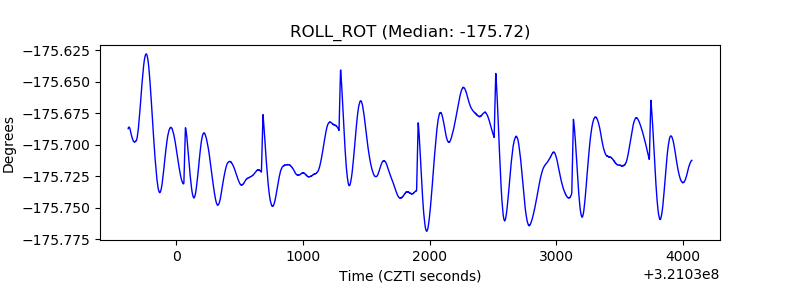 |
| _Roll_DEC | 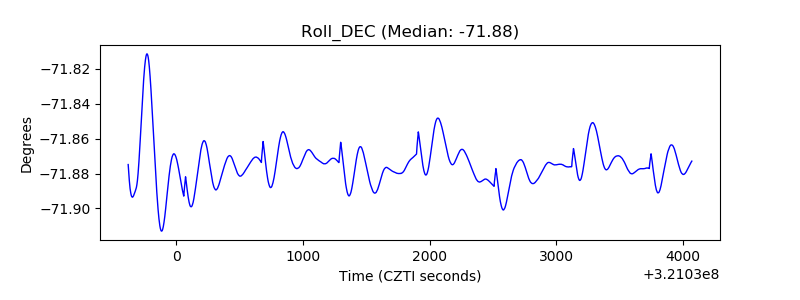 |
| _Roll_RA | 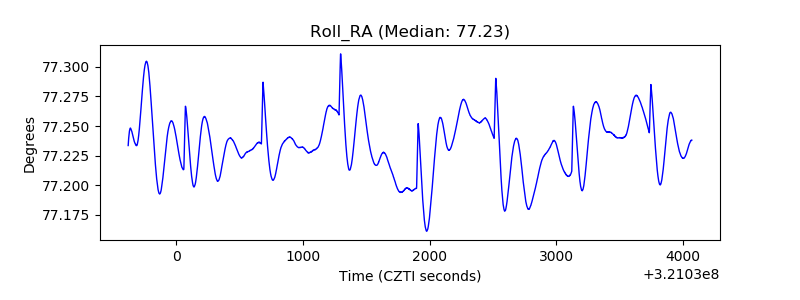 |
| Veto Counter | 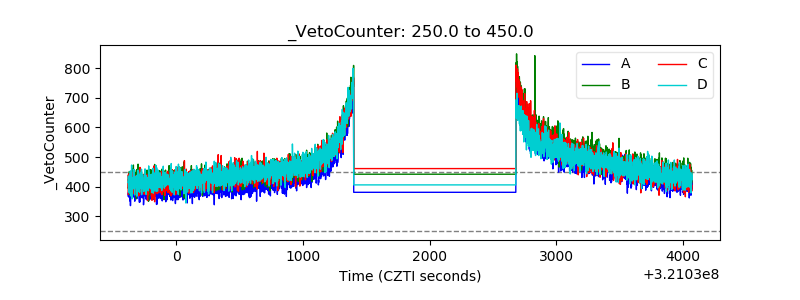 |