| Param | Original file | Final file |
|---|---|---|
| Filename | modeM0/AS1A07_001T04_9000003552_23972cztM0_level2.evt | modeM0/AS1A07_001T04_9000003552_23972cztM0_level2_quad_clean.evt |
| Size (bytes) | 566,945,280 | 124,646,400 |
| Size | 540.7 MB | 118.9 MB |
| Events in quadrant A | 3,103,139 | 910,330 |
| Events in quadrant B | 3,431,923 | 909,105 |
| Events in quadrant C | 3,253,890 | 851,624 |
| Events in quadrant D | 6,944,499 | 654,986 |
| Mode M0 | |||
|---|---|---|---|
| Quadrant | BADHDUFLAG | Total packets | Discarded packets |
| A | 0 | 13337 | 2 |
| B | 0 | 14395 | 2 |
| C | 0 | 13794 | 2 |
| D | 0 | 24841 | 5 |
| Mode SS | |||
|---|---|---|---|
| Quadrant | BADHDUFLAG | Total packets | Discarded packets |
| A | 0 | 132 | 0 |
| B | 0 | 132 | 0 |
| C | 0 | 132 | 0 |
| D | 0 | 132 | 0 |
| Mode M9 | |||
|---|---|---|---|
| Quadrant | BADHDUFLAG | Total packets | Discarded packets |
| A | 0 | 11 | 0 |
| B | 0 | 11 | 0 |
| C | 0 | 11 | 0 |
| D | 0 | 11 | 0 |
| Quadrant | Total seconds | Saturated seconds | Saturation percentage |
|---|---|---|---|
| A | 6420 | 52 | 0.809969% |
| B | 6421 | 108 | 1.681981% |
| C | 6421 | 142 | 2.211494% |
| D | 6420 | 1946 | 30.311526% |
Noise dominated data is calculated using 1-second bins in cleaned event files. If a bin has >2000 counts, and if more than 50% of those come from <1% of pixels, then it is considered to be noise-dominated and hence unusable.
| Quadrant | # 1 sec bins | Bins with >0 counts | Bins with >2000 counts | High rate bins dominated by noise | Noise dominated (total time) | Noise dominated (detector-on time) | Marked lightcurve |
|---|---|---|---|---|---|---|---|
| A | 7525 | 6421 | 0 | 0 | 0.00% | 0.00% | 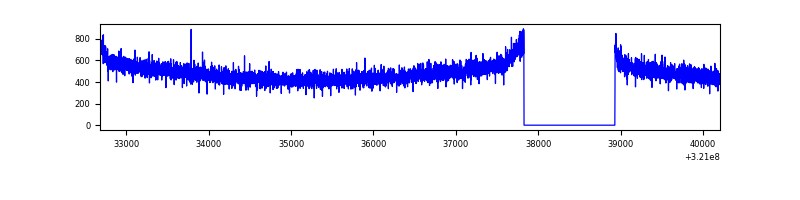 |
| B | 7526 | 6422 | 28 | 28 | 0.37% | 0.44% | 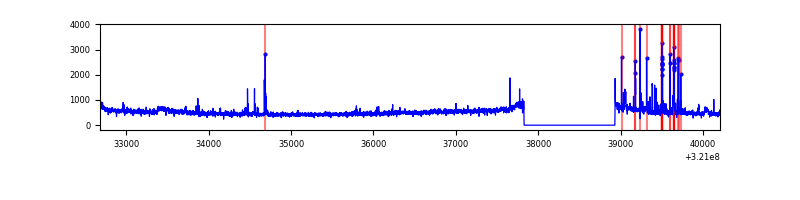 |
| C | 7526 | 6422 | 36 | 36 | 0.48% | 0.56% | 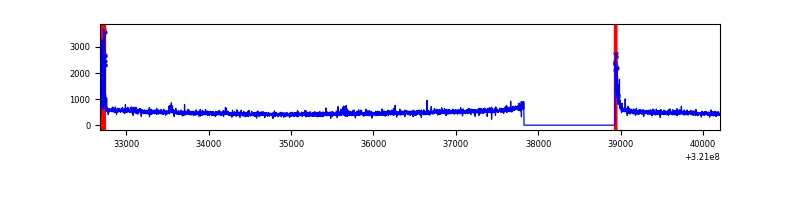 |
| D | 7525 | 6421 | 1116 | 1116 | 14.83% | 17.38% | 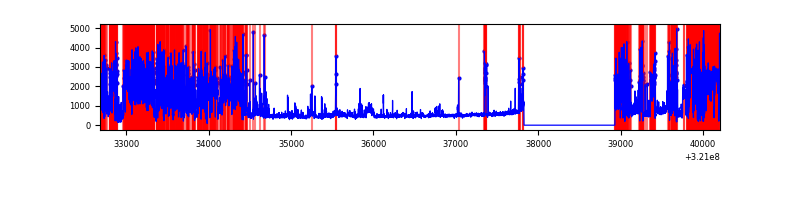 |
Top three noisy pixels from each quadrant. If the there are fewer than three noisy pixels in the level2.evt file, extra rows are filled as -1
| Pixel properties | Quadrant properties | ||||||
|---|---|---|---|---|---|---|---|
| Quadrant | DetID | PixID | Counts | Sigma | Mean | Median | Sigma |
| A | 13 | 254 | 11624 | 67.32 | 804 | 789 | 160.9 |
| A | 0 | 226 | 7310 | 40.52 | 804 | 789 | 160.9 |
| A | 3 | 137 | 6658 | 36.47 | 804 | 789 | 160.9 |
| B | 0 | 197 | 165289 | 1122.32 | 792 | 771 | 146.6 |
| B | 4 | 200 | 115846 | 785.03 | 792 | 771 | 146.6 |
| B | 0 | 245 | 25979 | 171.97 | 792 | 771 | 146.6 |
| C | 0 | 10 | 177153 | 1033.33 | 746 | 750 | 170.7 |
| C | 14 | 238 | 122802 | 714.96 | 746 | 750 | 170.7 |
| C | 7 | 221 | 19398 | 109.24 | 746 | 750 | 170.7 |
| D | 12 | 218 | 4152818 | 27610.34 | 609 | 590 | 150.4 |
| D | 12 | 250 | 133429 | 883.32 | 609 | 590 | 150.4 |
| D | 1 | 52 | 115312 | 762.85 | 609 | 590 | 150.4 |
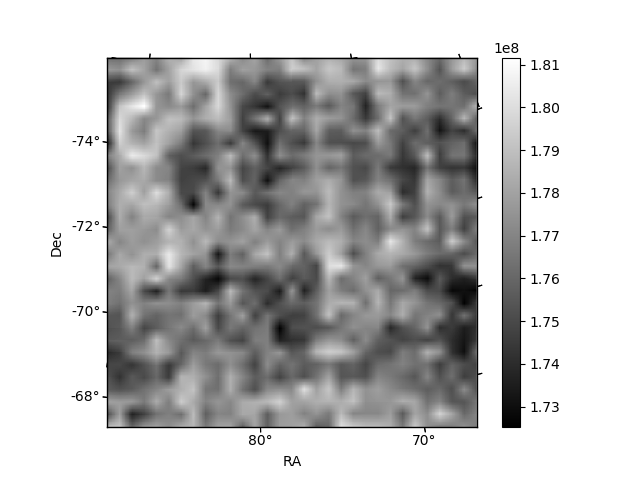
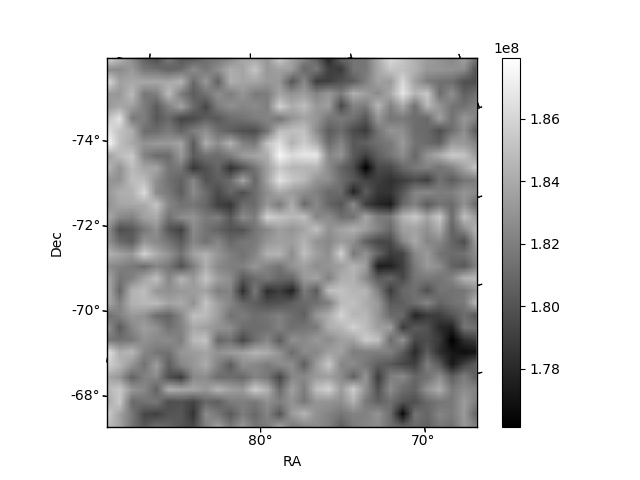
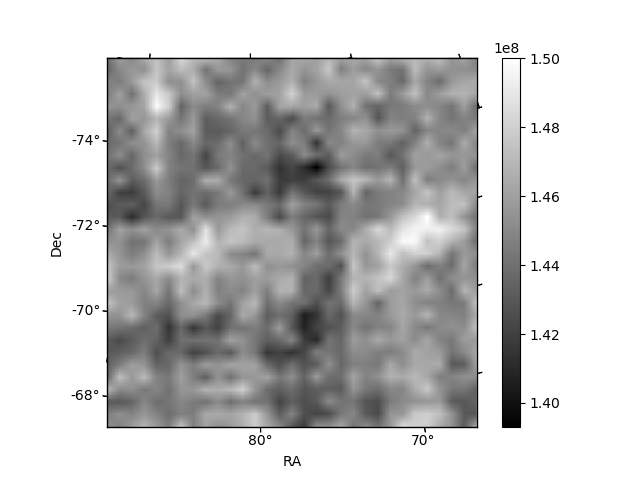
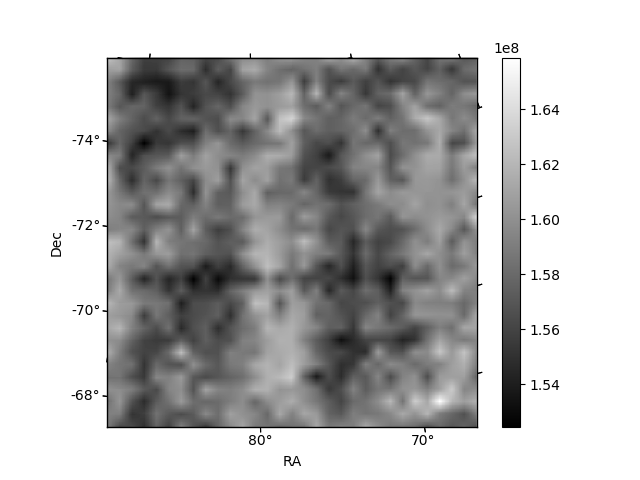
Histogram calculated using DETX and DETY for each event in the final _common_clean file
| Quadrant A | 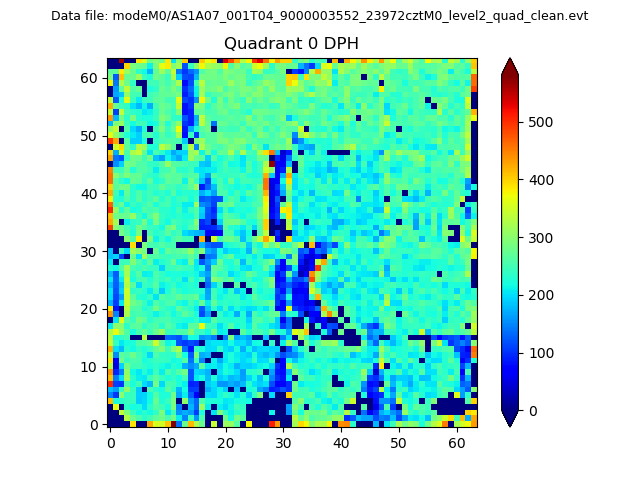 |
 |
Quadrant B |
|---|---|---|---|
| Quadrant D | 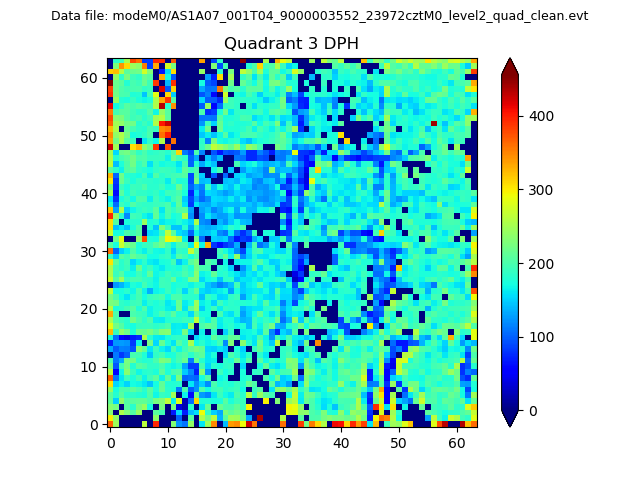 |
 |
Quadrant C |
| Plot type | Count rate plots | Images |
|---|---|---|
| Comparison with Poisson distribution Blue bars denote a histogram of data divided into 1 sec bins. Red curve is a Poisson curve with rate = median count rate of data. |
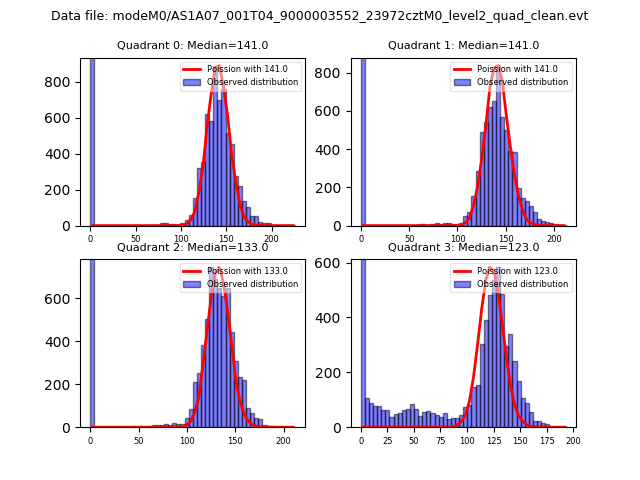 |
 |
| Quadrant-wise count rates Data is divided into 100 sec bins |
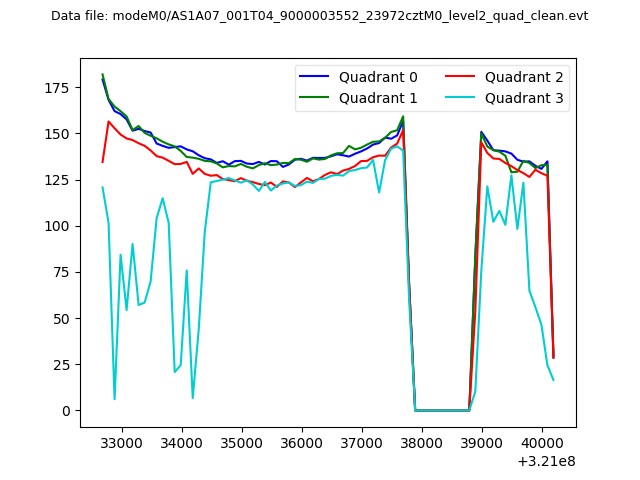 |
|
| Module-wise count rates for Quadrant A Data is divided into 100 sec bins |
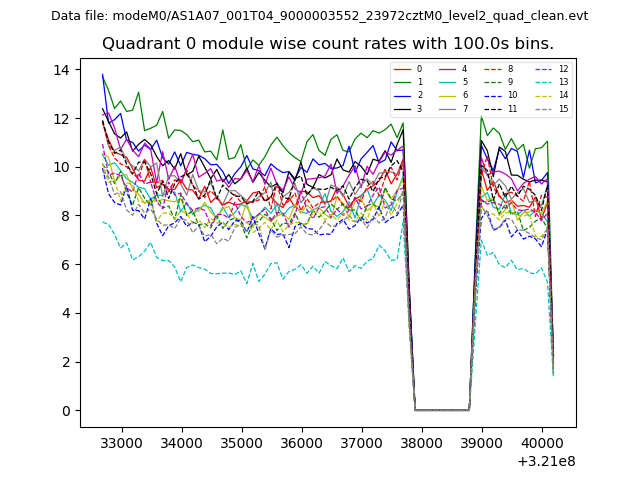 |
 |
| Module-wise count rates for Quadrant B Data is divided into 100 sec bins |
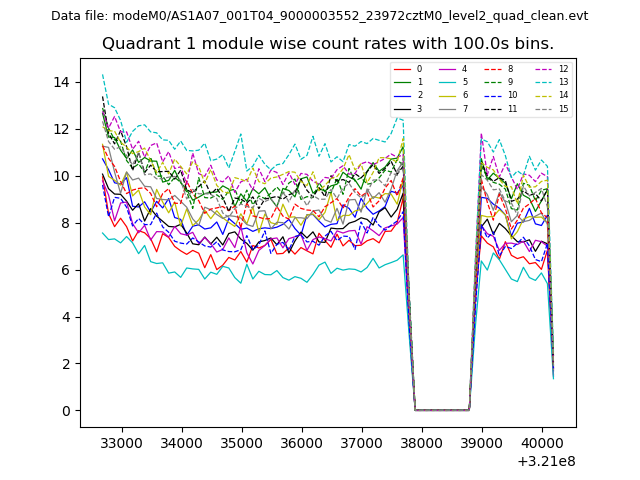 |
 |
| Module-wise count rates for Quadrant C Data is divided into 100 sec bins |
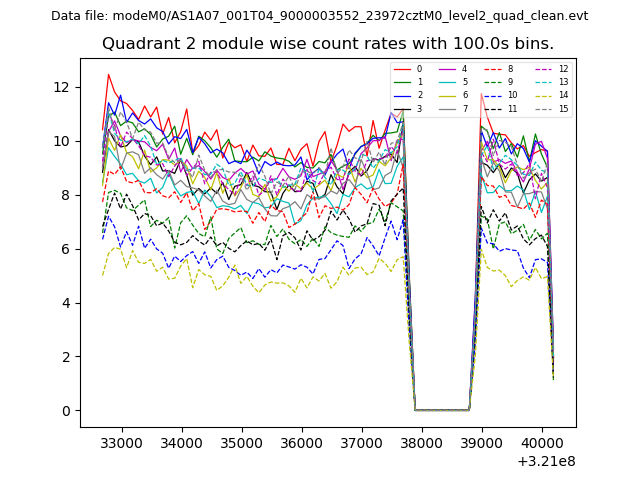 |
 |
| Module-wise count rates for Quadrant D Data is divided into 100 sec bins |
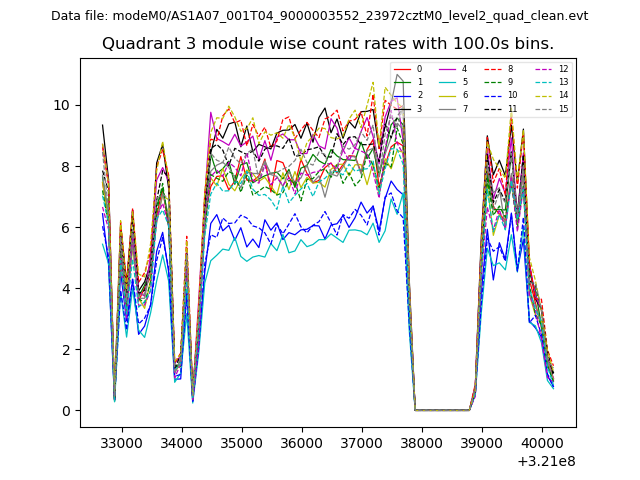 |
 |
| Parameter | Plot |
|---|---|
| CZT HV Monitor | 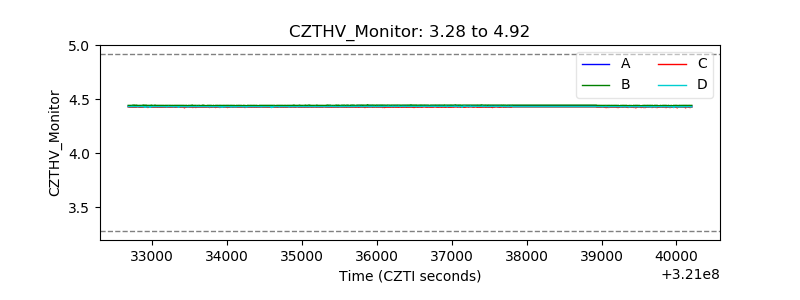 |
| D_VDD | 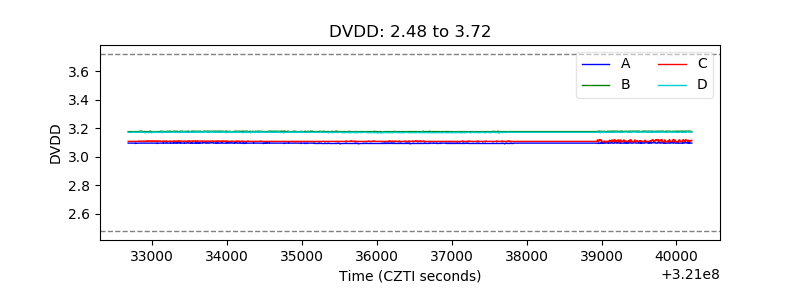 |
| Temperature 1 |  |
| Veto HV Monitor | 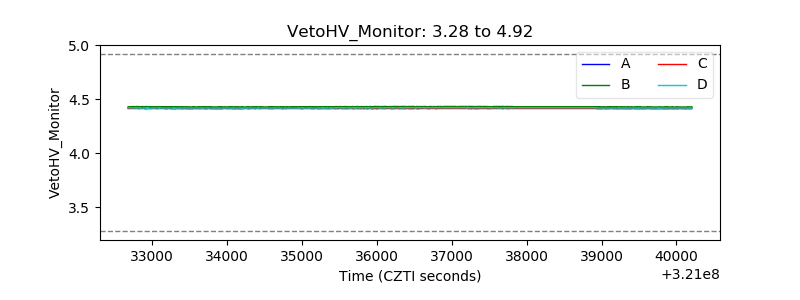 |
| Veto LLD |  |
| Alpha Counter | 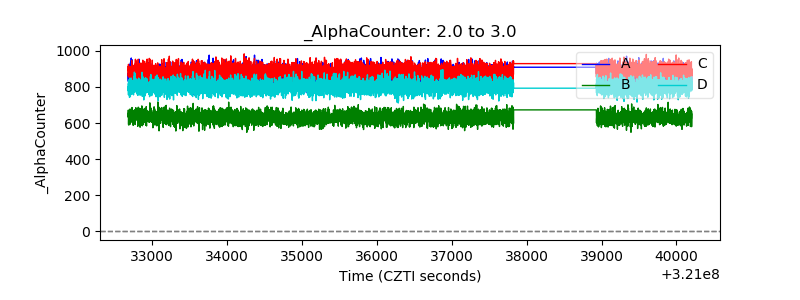 |
| _CPM_Rate | 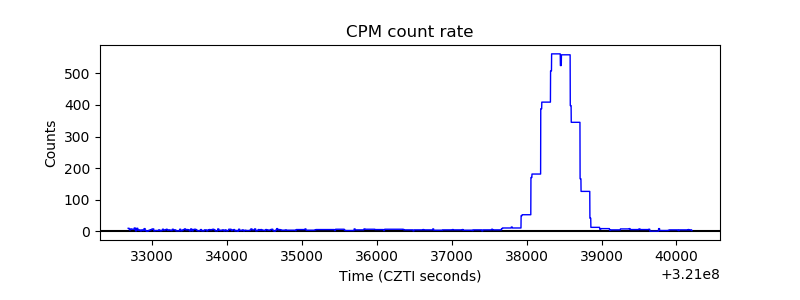 |
| CZT Counter | 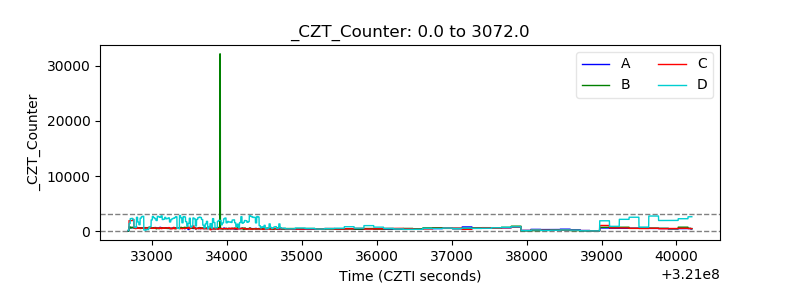 |
| +2.5 Volts monitor |  |
| +5 Volts monitor | 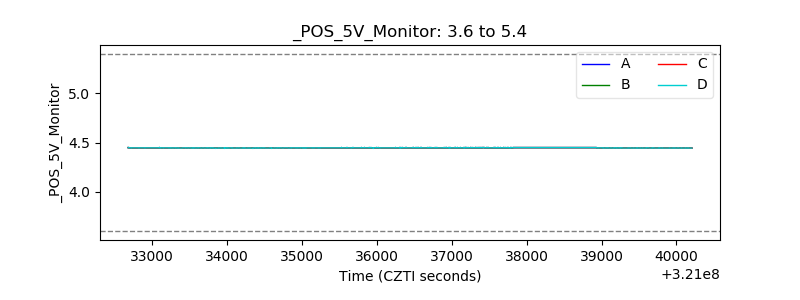 |
| _ROLL_ROT | 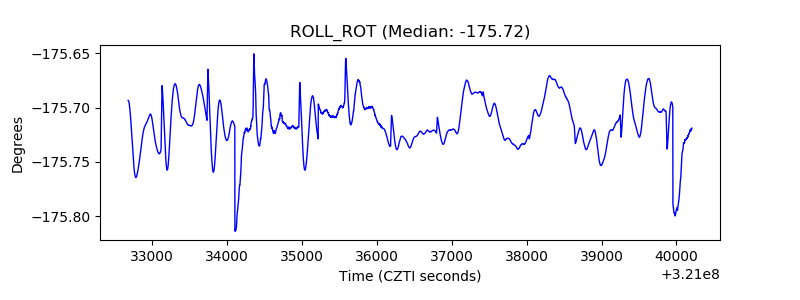 |
| _Roll_DEC | 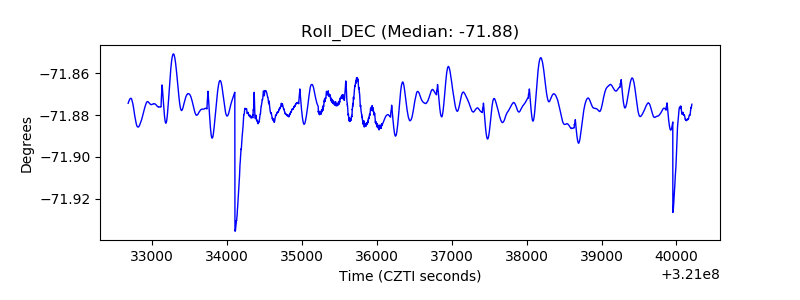 |
| _Roll_RA |  |
| Veto Counter | 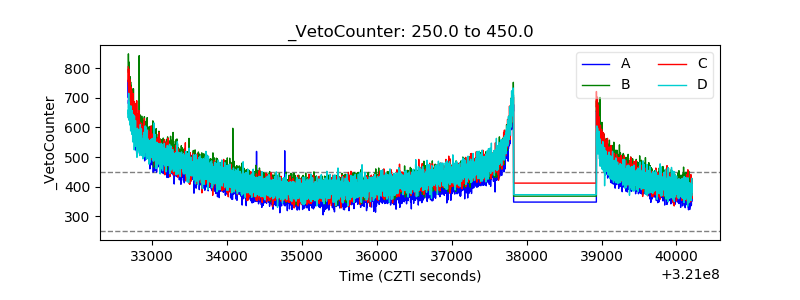 |