| Param | Original file | Final file |
|---|---|---|
| Filename | modeM0/AS1A07_001T04_9000003552_23973cztM0_level2.evt | modeM0/AS1A07_001T04_9000003552_23973cztM0_level2_quad_clean.evt |
| Size (bytes) | 222,094,080 | 37,278,720 |
| Size | 211.8 MB | 35.6 MB |
| Events in quadrant A | 948,212 | 277,106 |
| Events in quadrant B | 1,317,856 | 273,910 |
| Events in quadrant C | 998,183 | 261,647 |
| Events in quadrant D | 3,320,698 | 166,736 |
| Mode M0 | |||
|---|---|---|---|
| Quadrant | BADHDUFLAG | Total packets | Discarded packets |
| A | 0 | 4183 | 1 |
| B | 0 | 5328 | 1 |
| C | 0 | 4361 | 1 |
| D | 0 | 11275 | 1 |
| Mode SS | |||
|---|---|---|---|
| Quadrant | BADHDUFLAG | Total packets | Discarded packets |
| A | 0 | 40 | 0 |
| B | 0 | 40 | 0 |
| C | 0 | 40 | 0 |
| D | 0 | 40 | 0 |
| Mode M9 | |||
|---|---|---|---|
| Quadrant | BADHDUFLAG | Total packets | Discarded packets |
| A | 0 | 3 | 0 |
| B | 0 | 4 | 0 |
| C | 0 | 4 | 0 |
| D | 0 | 4 | 0 |
| Quadrant | Total seconds | Saturated seconds | Saturation percentage |
|---|---|---|---|
| A | 2050 | 5 | 0.243902% |
| B | 2050 | 74 | 3.609756% |
| C | 2050 | 36 | 1.756098% |
| D | 2050 | 1029 | 50.195122% |
Noise dominated data is calculated using 1-second bins in cleaned event files. If a bin has >2000 counts, and if more than 50% of those come from <1% of pixels, then it is considered to be noise-dominated and hence unusable.
| Quadrant | # 1 sec bins | Bins with >0 counts | Bins with >2000 counts | High rate bins dominated by noise | Noise dominated (total time) | Noise dominated (detector-on time) | Marked lightcurve |
|---|---|---|---|---|---|---|---|
| A | 2050 | 2050 | 0 | 0 | 0.00% | 0.00% | 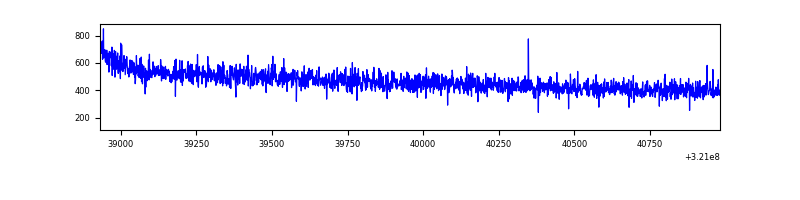 |
| B | 2050 | 2050 | 53 | 53 | 2.59% | 2.59% | 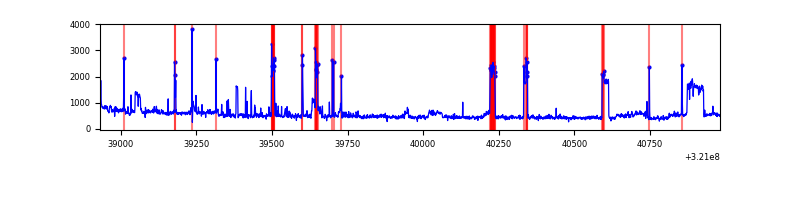 |
| C | 2050 | 2050 | 14 | 14 | 0.68% | 0.68% | 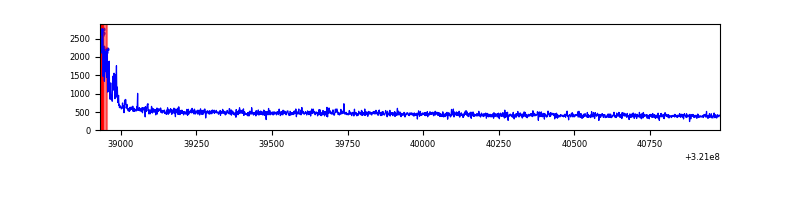 |
| D | 2050 | 2050 | 739 | 739 | 36.05% | 36.05% | 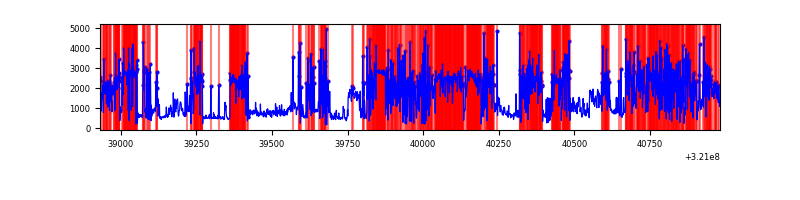 |
Top three noisy pixels from each quadrant. If the there are fewer than three noisy pixels in the level2.evt file, extra rows are filled as -1
| Pixel properties | Quadrant properties | ||||||
|---|---|---|---|---|---|---|---|
| Quadrant | DetID | PixID | Counts | Sigma | Mean | Median | Sigma |
| A | 13 | 254 | 4021 | 73.94 | 245 | 240 | 51.1 |
| A | 0 | 226 | 2322 | 40.71 | 245 | 240 | 51.1 |
| A | 3 | 137 | 1932 | 33.09 | 245 | 240 | 51.1 |
| B | 4 | 200 | 232380 | 4926.88 | 240 | 234 | 47.1 |
| B | 0 | 197 | 96337 | 2039.61 | 240 | 234 | 47.1 |
| B | 0 | 245 | 25087 | 527.46 | 240 | 234 | 47.1 |
| C | 0 | 10 | 70808 | 1344.86 | 222 | 223 | 52.5 |
| C | 14 | 238 | 36457 | 690.37 | 222 | 223 | 52.5 |
| C | 7 | 221 | 7782 | 144.02 | 222 | 223 | 52.5 |
| D | 12 | 218 | 2446335 | 60591.81 | 155 | 150 | 40.4 |
| D | 12 | 250 | 97248 | 2405.11 | 155 | 150 | 40.4 |
| D | 7 | 238 | 58384 | 1442.45 | 155 | 150 | 40.4 |
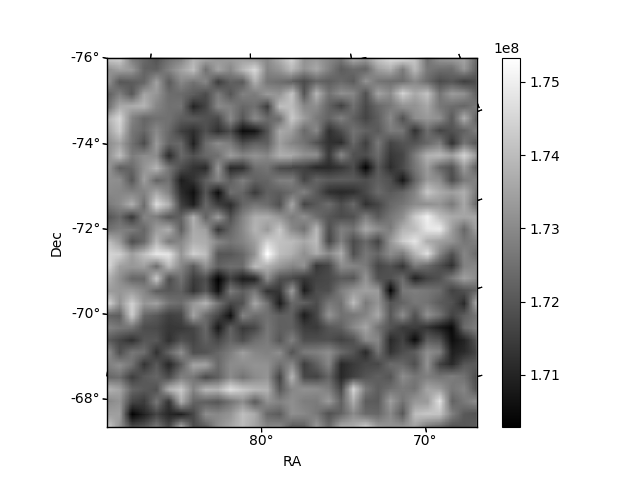
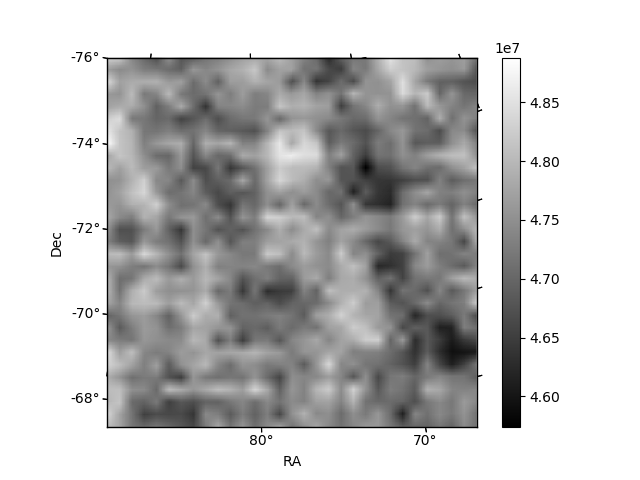
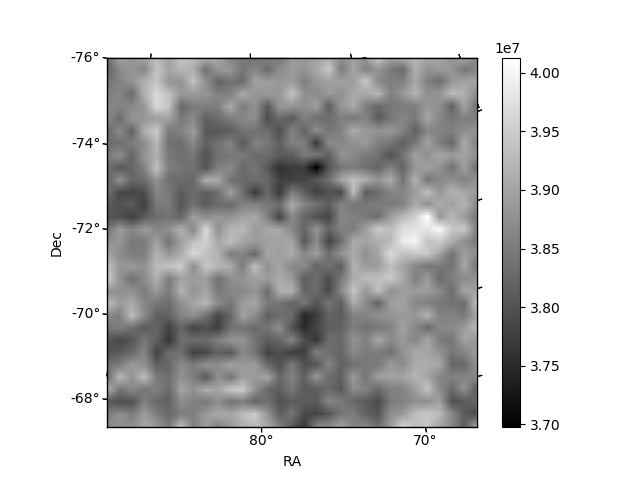
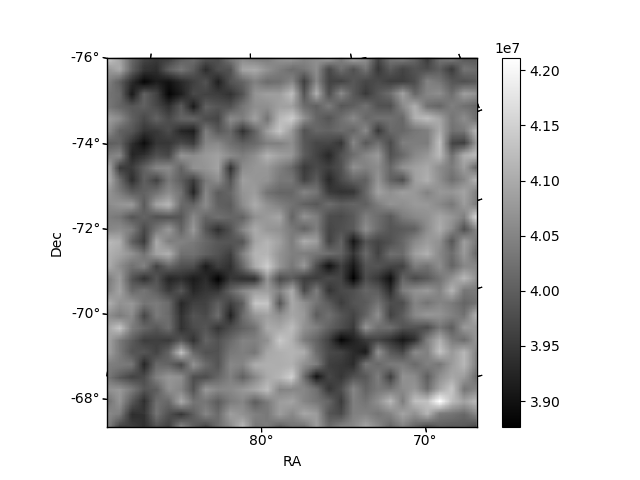
Histogram calculated using DETX and DETY for each event in the final _common_clean file
| Quadrant A | 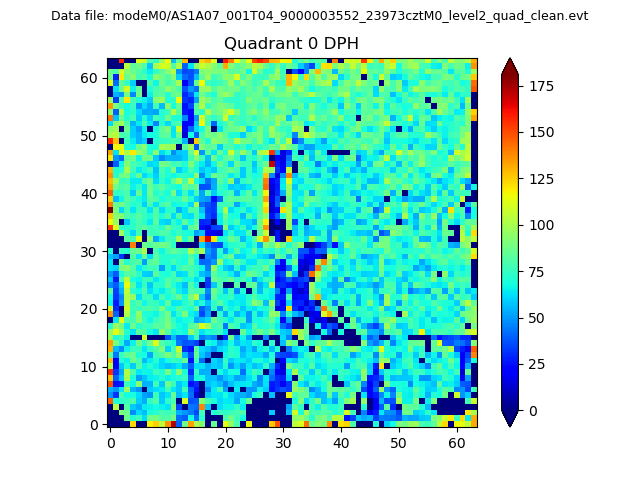 |
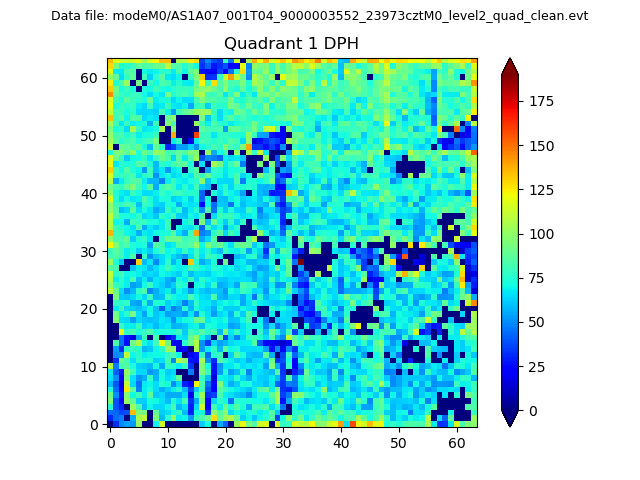 |
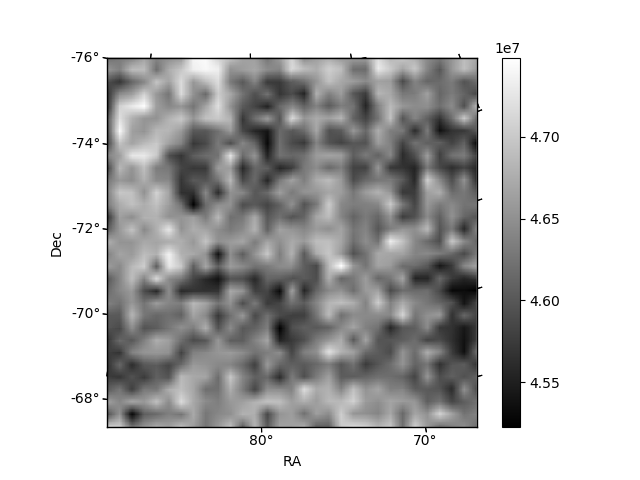
Quadrant B |
|---|---|---|---|
| Quadrant D | 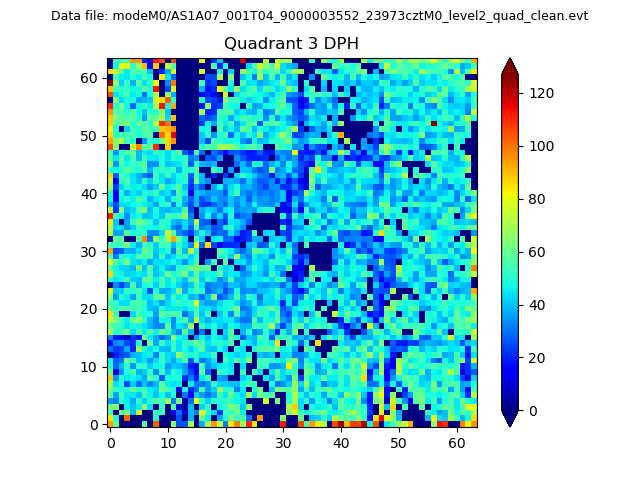 |
 |
Quadrant C |
| Plot type | Count rate plots | Images |
|---|---|---|
| Comparison with Poisson distribution Blue bars denote a histogram of data divided into 1 sec bins. Red curve is a Poisson curve with rate = median count rate of data. |
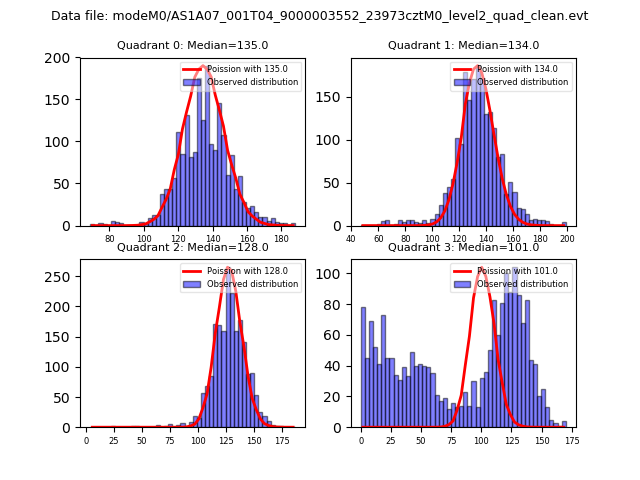 |
 |
| Quadrant-wise count rates Data is divided into 100 sec bins |
 |
|
| Module-wise count rates for Quadrant A Data is divided into 100 sec bins |
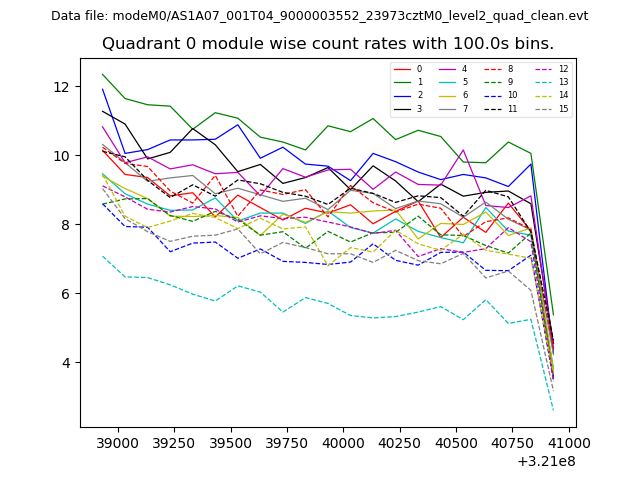 |
 |
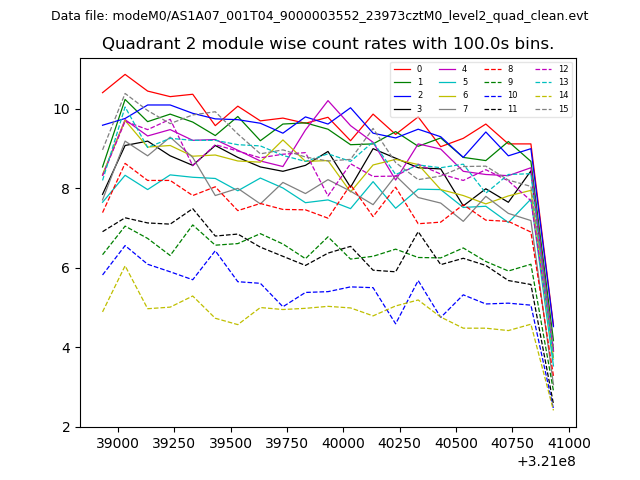
| Module-wise count rates for Quadrant B Data is divided into 100 sec bins |
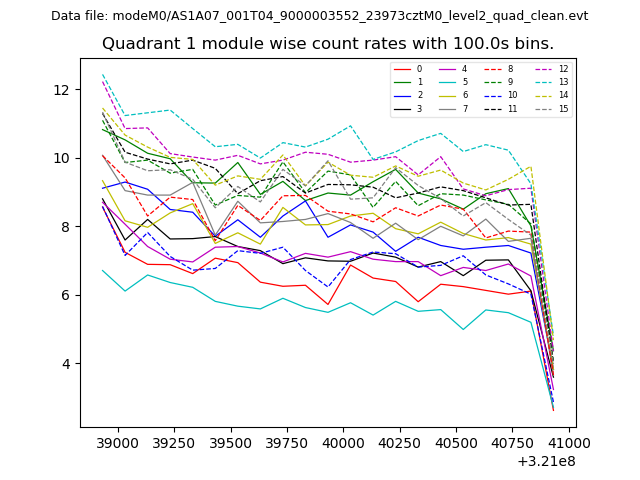 |
 |
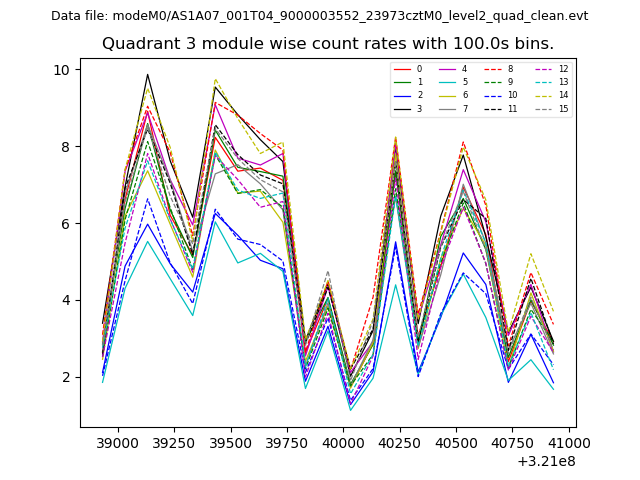
| Module-wise count rates for Quadrant C Data is divided into 100 sec bins |
 |
 |
| Module-wise count rates for Quadrant D Data is divided into 100 sec bins |
 |
 |
| Parameter | Plot |
|---|---|
| CZT HV Monitor | 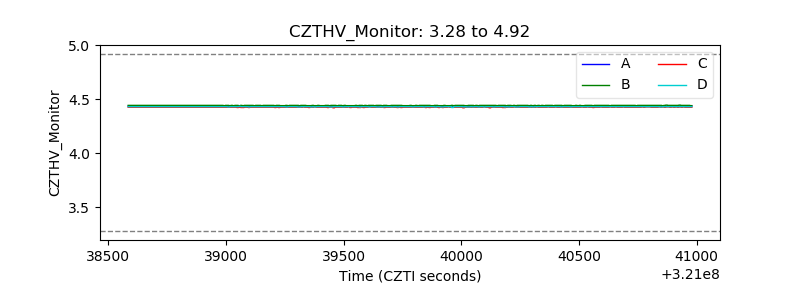 |
| D_VDD | 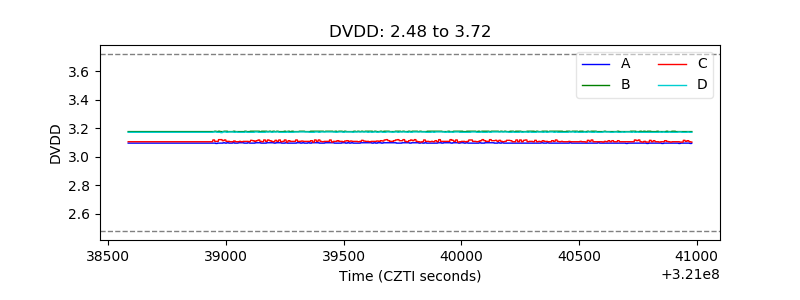 |
| Temperature 1 | 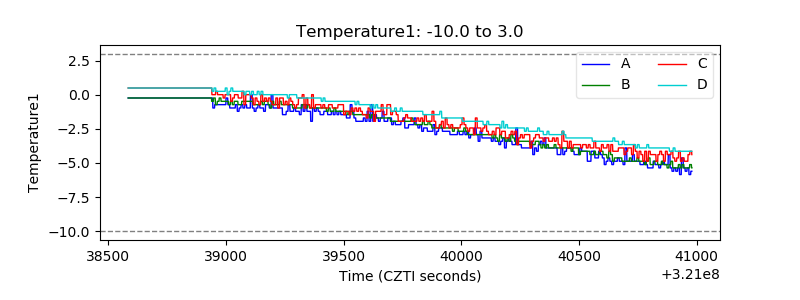 |
| Veto HV Monitor |  |
| Veto LLD | 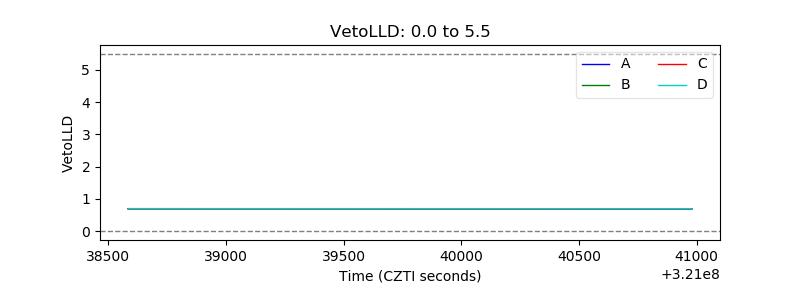 |
| Alpha Counter | 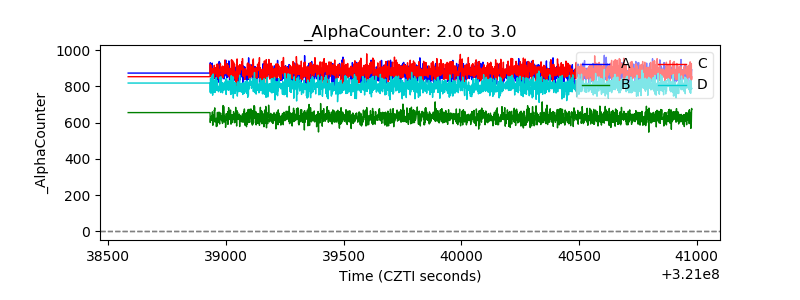 |
| _CPM_Rate |  |
| CZT Counter | 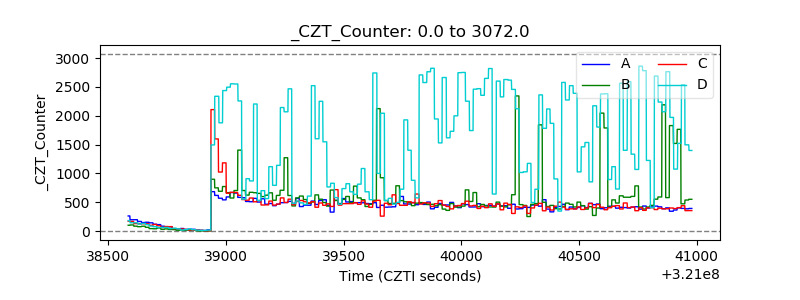 |
| +2.5 Volts monitor | 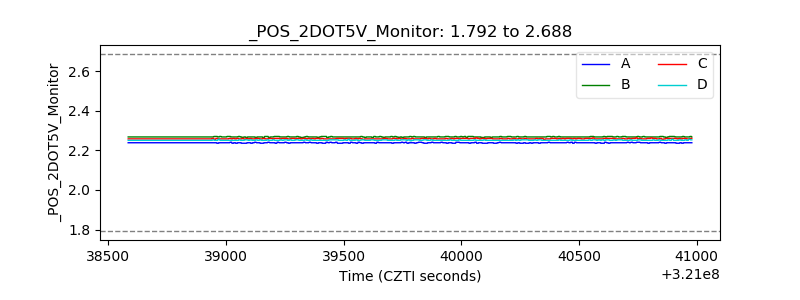 |
| +5 Volts monitor |  |
| _ROLL_ROT | 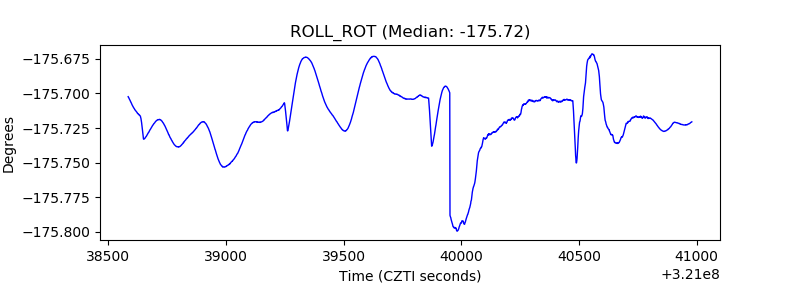 |
| _Roll_DEC | 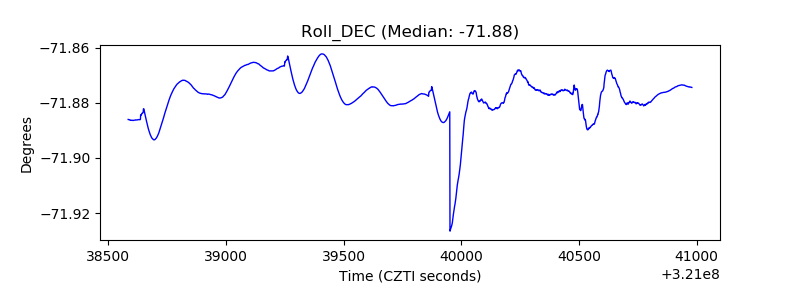 |
| _Roll_RA | 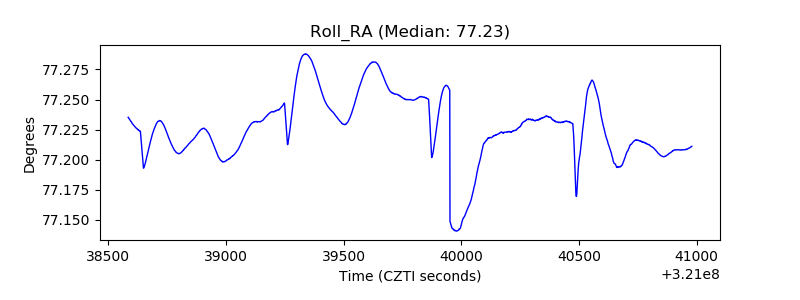 |
| Veto Counter | 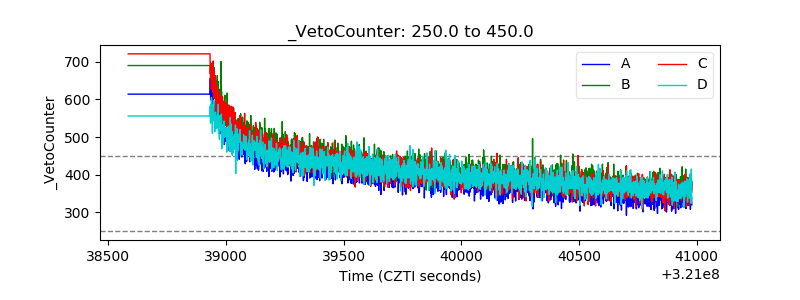 |