| Param | Original file | Final file |
|---|---|---|
| Filename | modeM0/AS1A07_001T05_9000003550cztM0_level2.fits | modeM0/AS1A07_001T05_9000003550cztM0_level2_quad_clean.evt |
| Size (bytes) | 91,906,560 | 78,886,080 |
| Size | 87.6 MB | 75.2 MB |
| Events in quadrant A | 613,382 | 486,145 |
| Events in quadrant B | 572,622 | 478,193 |
| Events in quadrant C | 561,176 | 445,492 |
| Events in quadrant D | 447,772 | 390,345 |
| Mode M9 | |||
|---|---|---|---|
| Quadrant | BADHDUFLAG | Total packets | Discarded packets |
| A | 0 | 27 | 0 |
| B | 0 | 27 | 0 |
| C | 0 | 27 | 0 |
| D | 0 | 27 | 0 |
| Mode M0 | |||
|---|---|---|---|
| Quadrant | BADHDUFLAG | Total packets | Discarded packets |
| A | 0 | 18384 | 0 |
| B | 0 | 18891 | 0 |
| C | 0 | 19678 | 0 |
| D | 0 | 31212 | 0 |
| Mode SS | |||
|---|---|---|---|
| Quadrant | BADHDUFLAG | Total packets | Discarded packets |
| A | 0 | 172 | 0 |
| B | 0 | 172 | 0 |
| C | 0 | 172 | 0 |
| D | 0 | 172 | 0 |
| Quadrant | Total seconds | Saturated seconds | Saturation percentage |
|---|---|---|---|
| A | 8468 | 115 | 1.358054% |
| B | 8468 | 139 | 1.641474% |
| C | 8468 | 294 | 3.471894% |
| D | 8468 | 1768 | 20.878602% |
Noise dominated data is calculated using 1-second bins in cleaned event files. If a bin has >2000 counts, and if more than 50% of those come from <1% of pixels, then it is considered to be noise-dominated and hence unusable.
| Quadrant | # 1 sec bins | Bins with >0 counts | Bins with >2000 counts | High rate bins dominated by noise | Noise dominated (total time) | Noise dominated (detector-on time) | Marked lightcurve |
|---|---|---|---|---|---|---|---|
| A | 11083 | 8468 | 0 | 0 | 0.00% | 0.00% |  |
| B | 11083 | 8468 | 0 | 0 | 0.00% | 0.00% |  |
| C | 11083 | 8468 | 0 | 0 | 0.00% | 0.00% |  |
| D | 11083 | 8406 | 0 | 0 | 0.00% | 0.00% |  |
Top three noisy pixels from each quadrant. If the there are fewer than three noisy pixels in the level2.evt file, extra rows are filled as -1
| Pixel properties | Quadrant properties | ||||||
|---|---|---|---|---|---|---|---|
| Quadrant | DetID | PixID | Counts | Sigma | Mean | Median | Sigma |
| A | 0 | 29 | 572 | 10.51 | 159 | 152 | 40.0 |
| A | 0 | 30 | 473 | 8.04 | 159 | 152 | 40.0 |
| A | 7 | 110 | 465 | 7.83 | 159 | 152 | 40.0 |
| B | 2 | 9 | 472 | 10.56 | 151 | 146 | 30.9 |
| B | 3 | 80 | 400 | 8.23 | 151 | 146 | 30.9 |
| B | 5 | 128 | 378 | 7.51 | 151 | 146 | 30.9 |
| C | 1 | 81 | 430 | 7.4 | 148 | 140 | 39.1 |
| C | 1 | 80 | 417 | 7.07 | 148 | 140 | 39.1 |
| C | 12 | 241 | 407 | 6.81 | 148 | 140 | 39.1 |
| D | 10 | 189 | 345 | 6.45 | 128 | 118 | 35.2 |
| D | 6 | 38 | 321 | 5.77 | 128 | 118 | 35.2 |
| D | 6 | 67 | 317 | 5.66 | 128 | 118 | 35.2 |
Histogram calculated using DETX and DETY for each event in the final _common_clean file
| Quadrant A |  |
 |
Quadrant B |
|---|---|---|---|
| Quadrant D |  |
 |
Quadrant C |
| Plot type | Count rate plots | Images |
|---|---|---|
| Comparison with Poisson distribution Blue bars denote a histogram of data divided into 1 sec bins. Red curve is a Poisson curve with rate = median count rate of data. |
 |
 |
| Quadrant-wise count rates Data is divided into 100 sec bins |
 |
|
| Module-wise count rates for Quadrant A Data is divided into 100 sec bins |
 |
 |
| Module-wise count rates for Quadrant B Data is divided into 100 sec bins |
 |
 |
| Module-wise count rates for Quadrant C Data is divided into 100 sec bins |
 |
 |
| Module-wise count rates for Quadrant D Data is divided into 100 sec bins |
 |
 |
| Parameter | Plot |
|---|---|
| CZT HV Monitor |  |
| D_VDD | 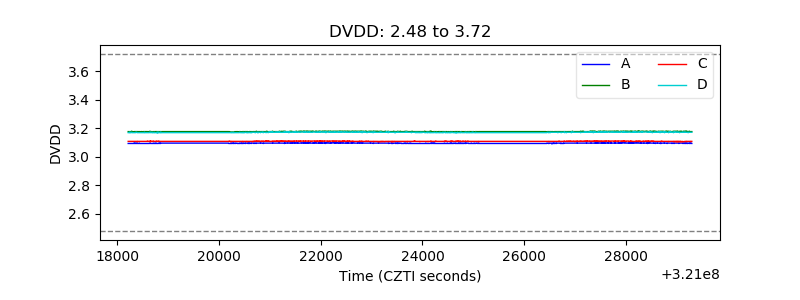 |
| Temperature 1 |  |
| Veto HV Monitor |  |
| Veto LLD |  |
| Alpha Counter |  |
| _CPM_Rate |  |
| CZT Counter |  |
| +2.5 Volts monitor |  |
| +5 Volts monitor |  |
| _ROLL_ROT |  |
| _Roll_DEC |  |
| _Roll_RA |  |
| Veto Counter |  |