| Param | Original file | Final file |
|---|---|---|
| Filename | modeM0/AS1A07_001T05_9000003550_23971cztM0_level2.evt | modeM0/AS1A07_001T05_9000003550_23971cztM0_level2_quad_clean.evt |
| Size (bytes) | 238,668,480 | 55,880,640 |
| Size | 227.6 MB | 53.3 MB |
| Events in quadrant A | 1,303,779 | 405,232 |
| Events in quadrant B | 1,344,565 | 404,800 |
| Events in quadrant C | 1,298,773 | 379,590 |
| Events in quadrant D | 3,099,066 | 312,471 |
| Mode M0 | |||
|---|---|---|---|
| Quadrant | BADHDUFLAG | Total packets | Discarded packets |
| A | 0 | 5540 | 0 |
| B | 0 | 5662 | 0 |
| C | 0 | 5594 | 0 |
| D | 0 | 11008 | 0 |
| Mode SS | |||
|---|---|---|---|
| Quadrant | BADHDUFLAG | Total packets | Discarded packets |
| A | 0 | 54 | 0 |
| B | 0 | 54 | 0 |
| C | 0 | 54 | 0 |
| D | 0 | 54 | 0 |
| Quadrant | Total seconds | Saturated seconds | Saturation percentage |
|---|---|---|---|
| A | 2642 | 2 | 0.075700% |
| B | 2643 | 6 | 0.227015% |
| C | 2643 | 7 | 0.264851% |
| D | 2643 | 816 | 30.874007% |
Noise dominated data is calculated using 1-second bins in cleaned event files. If a bin has >2000 counts, and if more than 50% of those come from <1% of pixels, then it is considered to be noise-dominated and hence unusable.
| Quadrant | # 1 sec bins | Bins with >0 counts | Bins with >2000 counts | High rate bins dominated by noise | Noise dominated (total time) | Noise dominated (detector-on time) | Marked lightcurve |
|---|---|---|---|---|---|---|---|
| A | 2642 | 2642 | 0 | 0 | 0.00% | 0.00% | 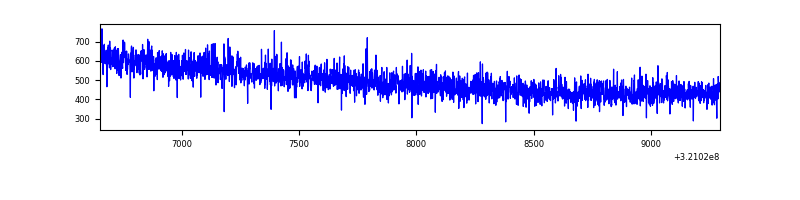 |
| B | 2643 | 2643 | 0 | 0 | 0.00% | 0.00% | 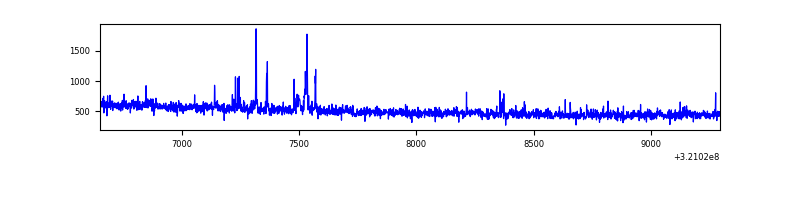 |
| C | 2643 | 2643 | 1 | 1 | 0.04% | 0.04% | 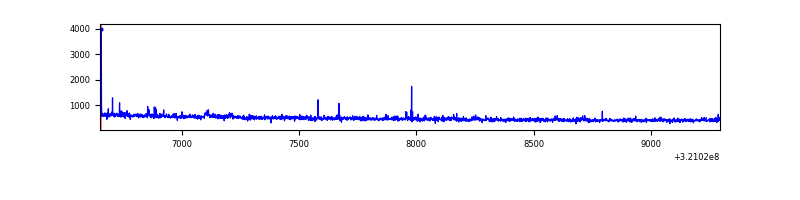 |
| D | 2643 | 2643 | 395 | 395 | 14.95% | 14.95% | 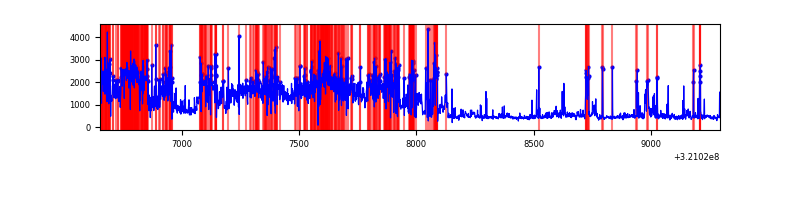 |
Top three noisy pixels from each quadrant. If the there are fewer than three noisy pixels in the level2.evt file, extra rows are filled as -1
| Pixel properties | Quadrant properties | ||||||
|---|---|---|---|---|---|---|---|
| Quadrant | DetID | PixID | Counts | Sigma | Mean | Median | Sigma |
| A | 13 | 254 | 5086 | 68.98 | 338 | 331 | 68.9 |
| A | 0 | 226 | 3093 | 40.07 | 338 | 331 | 68.9 |
| A | 3 | 137 | 2636 | 33.44 | 338 | 331 | 68.9 |
| B | 0 | 197 | 16275 | 254.48 | 331 | 325 | 62.7 |
| B | 4 | 200 | 14164 | 220.8 | 331 | 325 | 62.7 |
| B | 5 | 172 | 13780 | 214.67 | 331 | 325 | 62.7 |
| C | 14 | 238 | 50992 | 704.56 | 308 | 310 | 71.9 |
| C | 0 | 10 | 33181 | 456.96 | 308 | 310 | 71.9 |
| C | 7 | 221 | 9171 | 123.18 | 308 | 310 | 71.9 |
| D | 12 | 218 | 1403515 | 21100.19 | 267 | 259 | 66.5 |
| D | 12 | 250 | 187456 | 2814.8 | 267 | 259 | 66.5 |
| D | 12 | 202 | 137733 | 2067.14 | 267 | 259 | 66.5 |
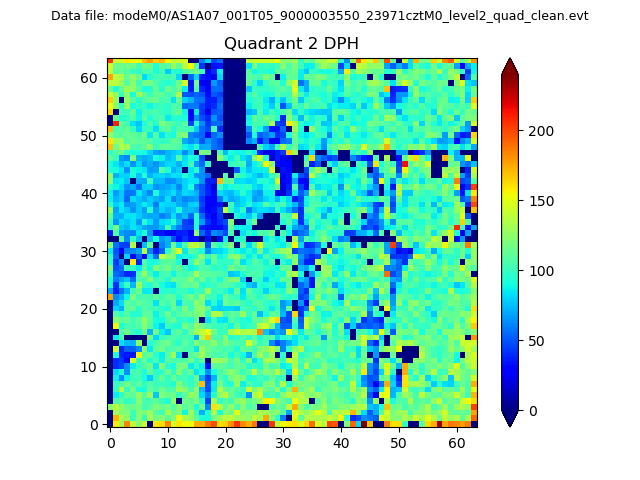
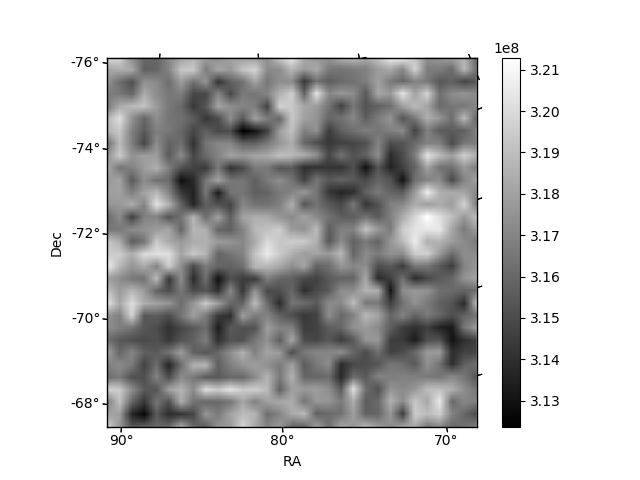
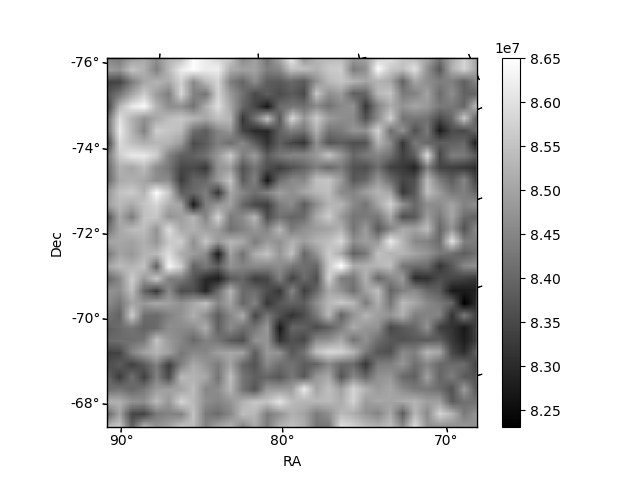
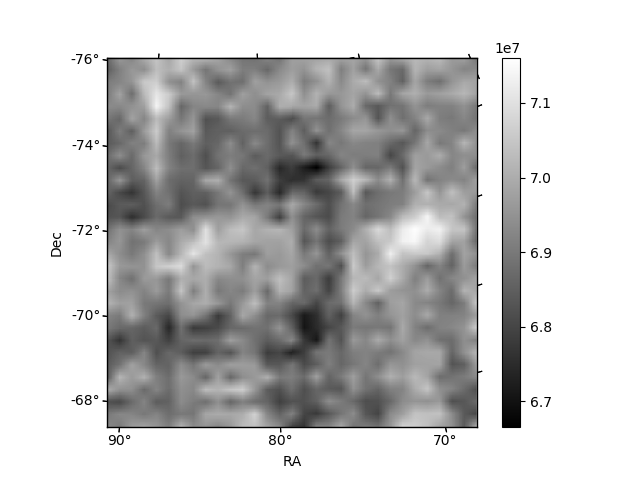
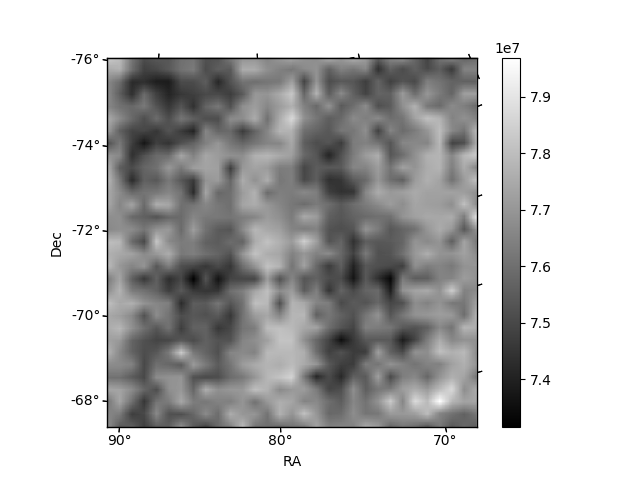
Histogram calculated using DETX and DETY for each event in the final _common_clean file
| Quadrant A | 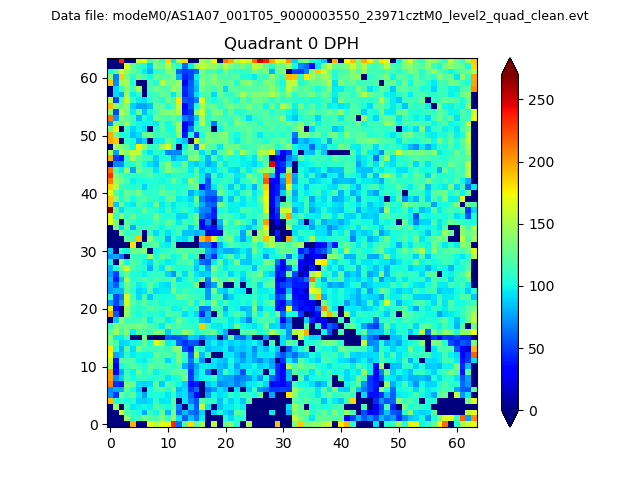 |
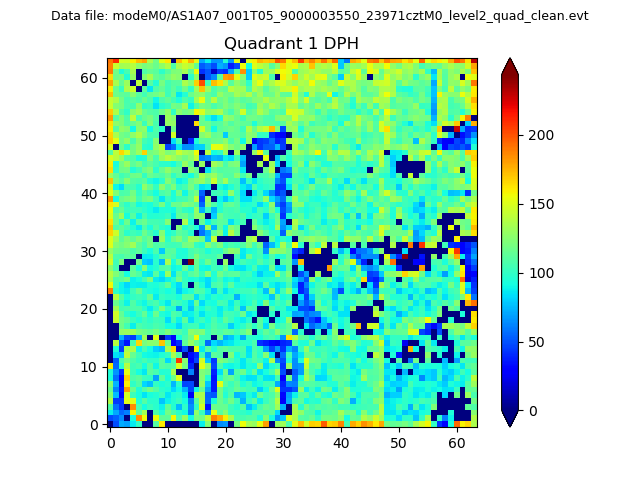 |
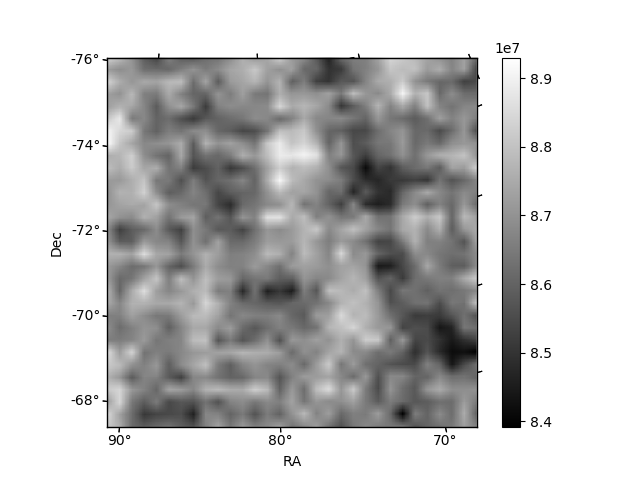
Quadrant B |
|---|---|---|---|
| Quadrant D | 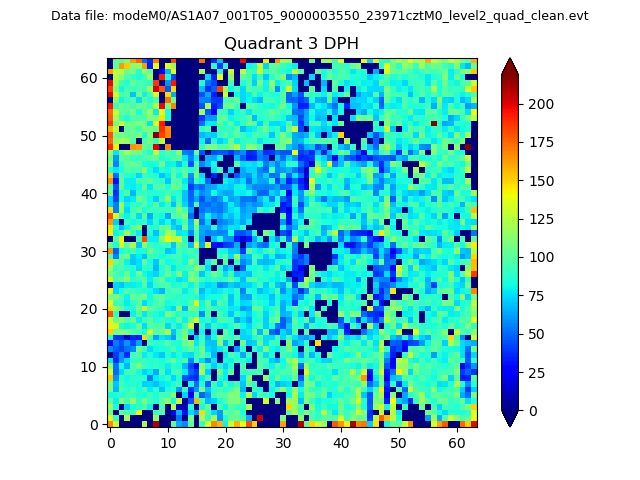 |
 |
Quadrant C |
| Plot type | Count rate plots | Images |
|---|---|---|
| Comparison with Poisson distribution Blue bars denote a histogram of data divided into 1 sec bins. Red curve is a Poisson curve with rate = median count rate of data. |
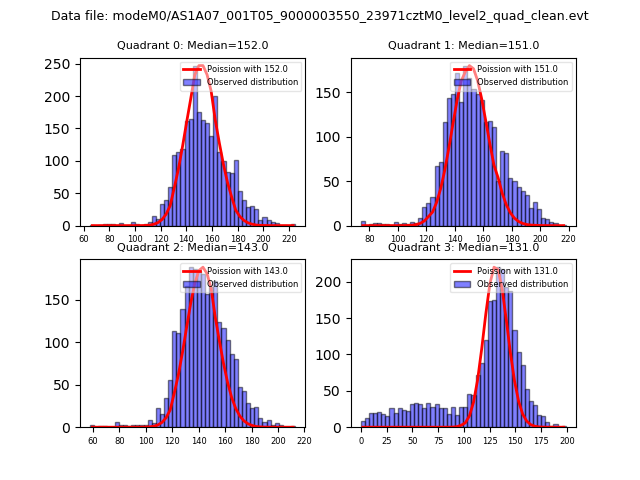 |
 |
| Quadrant-wise count rates Data is divided into 100 sec bins |
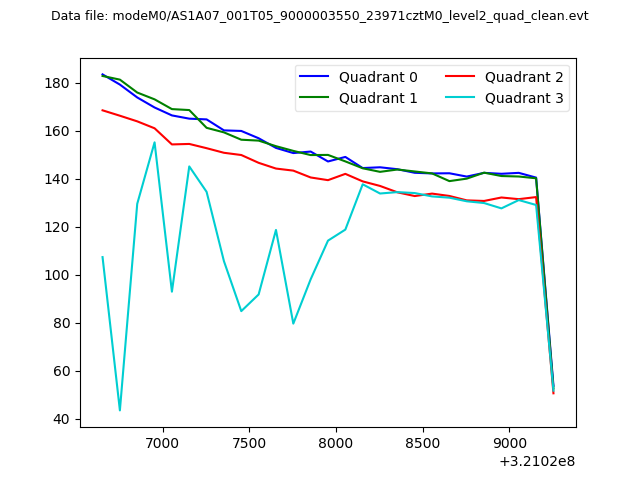 |
|
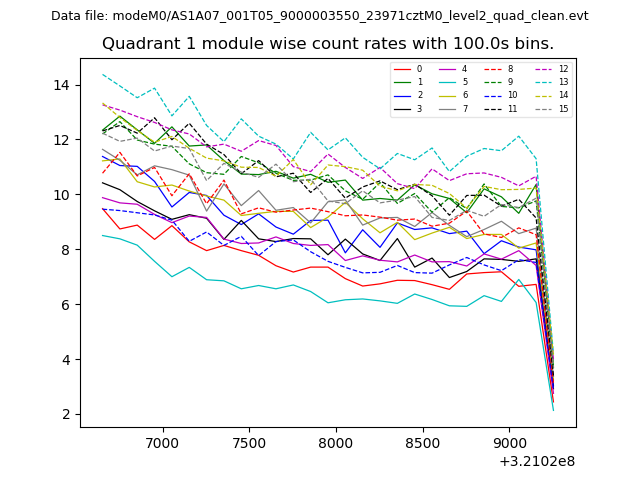
| Module-wise count rates for Quadrant A Data is divided into 100 sec bins |
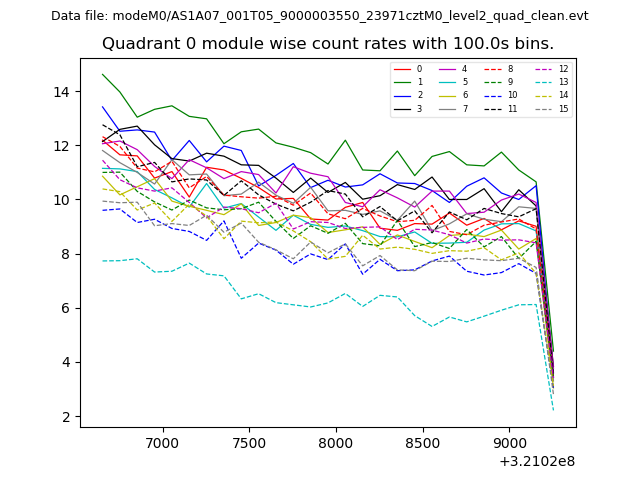 |
 |
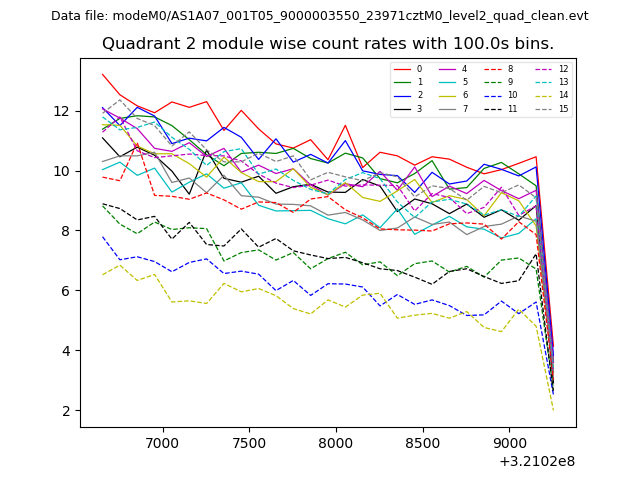
| Module-wise count rates for Quadrant B Data is divided into 100 sec bins |
 |
 |
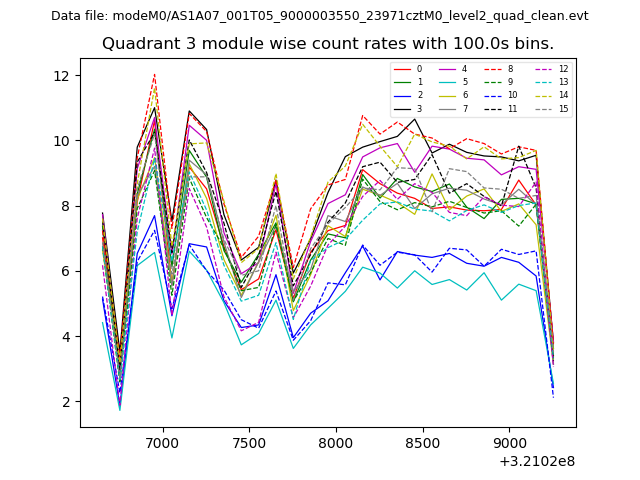
| Module-wise count rates for Quadrant C Data is divided into 100 sec bins |
 |
 |
| Module-wise count rates for Quadrant D Data is divided into 100 sec bins |
 |
 |
| Parameter | Plot |
|---|---|
| CZT HV Monitor | 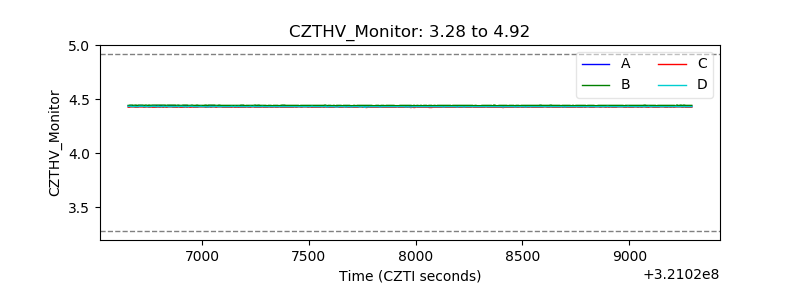 |
| D_VDD | 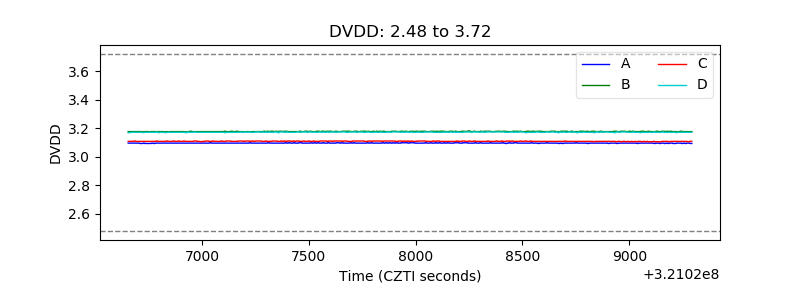 |
| Temperature 1 | 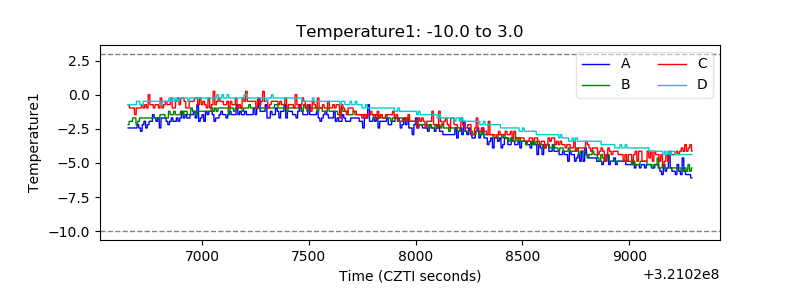 |
| Veto HV Monitor | 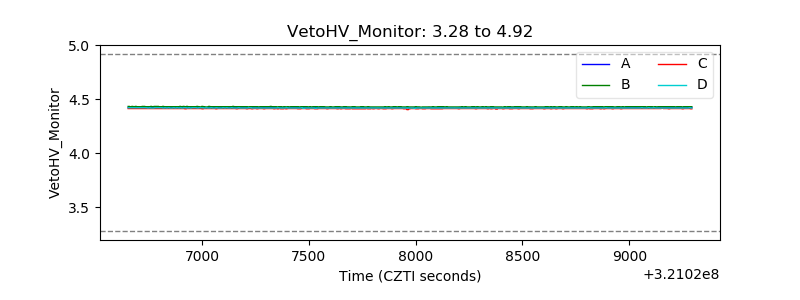 |
| Veto LLD | 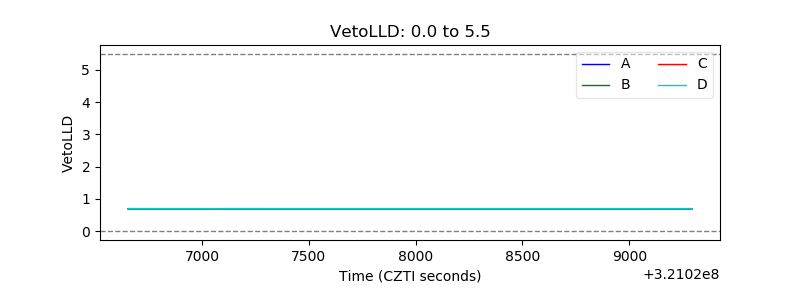 |
| Alpha Counter | 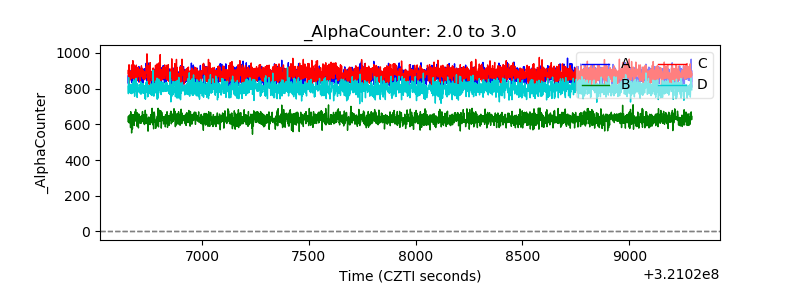 |
| _CPM_Rate | 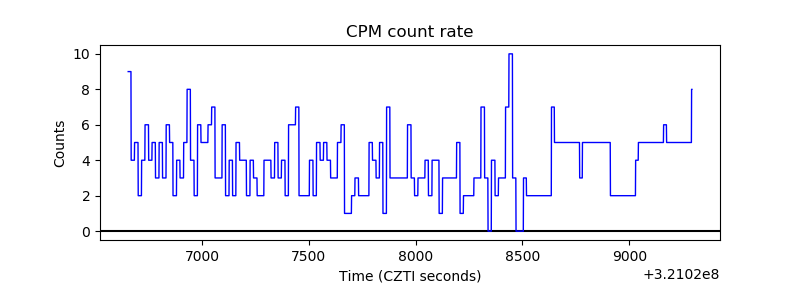 |
| CZT Counter | 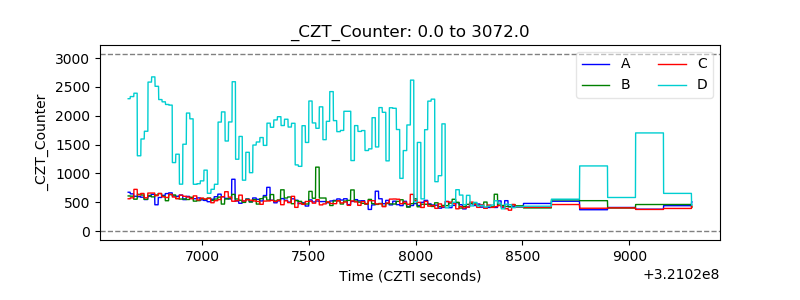 |
| +2.5 Volts monitor |  |
| +5 Volts monitor |  |
| _ROLL_ROT |  |
| _Roll_DEC | 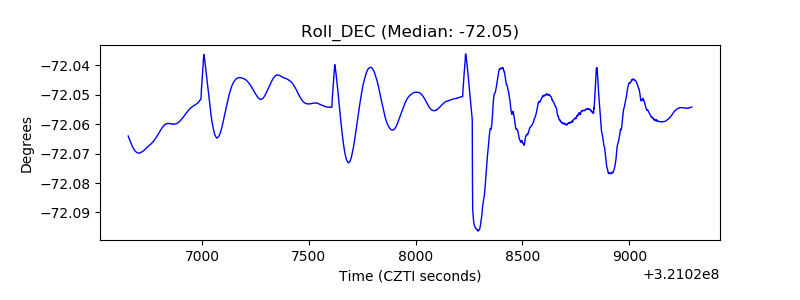 |
| _Roll_RA | 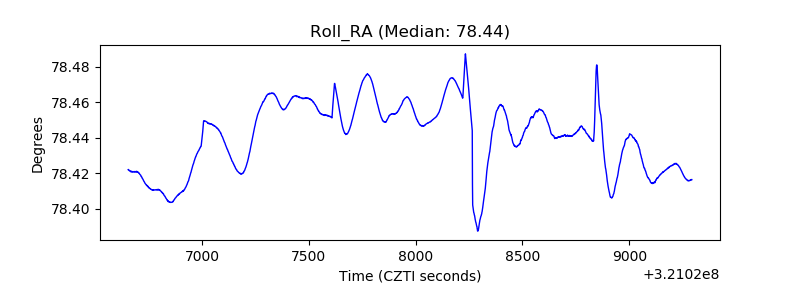 |
| Veto Counter | 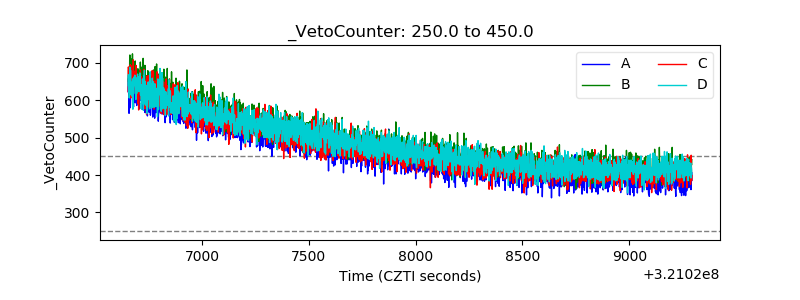 |