| Param | Original file | Final file |
|---|---|---|
| Filename | modeM0/AS1A07_065T01_9000003554cztM0_level2.fits | modeM0/AS1A07_065T01_9000003554cztM0_level2_quad_clean.evt |
| Size (bytes) | 476,677,440 | 419,791,680 |
| Size | 454.6 MB | 400.3 MB |
| Events in quadrant A | 3,067,830 | 2,627,224 |
| Events in quadrant B | 2,899,060 | 2,587,172 |
| Events in quadrant C | 2,931,924 | 2,473,006 |
| Events in quadrant D | 2,065,414 | 1,560,111 |
| Mode M9 | |||
|---|---|---|---|
| Quadrant | BADHDUFLAG | Total packets | Discarded packets |
| A | 0 | 62 | 0 |
| B | 0 | 62 | 0 |
| C | 0 | 62 | 0 |
| D | 0 | 62 | 0 |
| Mode M0 | |||
|---|---|---|---|
| Quadrant | BADHDUFLAG | Total packets | Discarded packets |
| A | 0 | 104379 | 0 |
| B | 0 | 117382 | 0 |
| C | 0 | 106175 | 0 |
| D | 0 | 221172 | 0 |
| Mode SS | |||
|---|---|---|---|
| Quadrant | BADHDUFLAG | Total packets | Discarded packets |
| A | 0 | 1028 | 0 |
| B | 0 | 1028 | 0 |
| C | 0 | 1028 | 0 |
| D | 0 | 1028 | 0 |
| Quadrant | Total seconds | Saturated seconds | Saturation percentage |
|---|---|---|---|
| A | 50482 | 408 | 0.808209% |
| B | 50482 | 1713 | 3.393289% |
| C | 50482 | 932 | 1.846203% |
| D | 50482 | 15800 | 31.298285% |
Noise dominated data is calculated using 1-second bins in cleaned event files. If a bin has >2000 counts, and if more than 50% of those come from <1% of pixels, then it is considered to be noise-dominated and hence unusable.
| Quadrant | # 1 sec bins | Bins with >0 counts | Bins with >2000 counts | High rate bins dominated by noise | Noise dominated (total time) | Noise dominated (detector-on time) | Marked lightcurve |
|---|---|---|---|---|---|---|---|
| A | 56697 | 50480 | 0 | 0 | 0.00% | 0.00% |  |
| B | 56697 | 50480 | 0 | 0 | 0.00% | 0.00% |  |
| C | 56697 | 50482 | 0 | 0 | 0.00% | 0.00% |  |
| D | 56697 | 48672 | 0 | 0 | 0.00% | 0.00% |  |
Top three noisy pixels from each quadrant. If the there are fewer than three noisy pixels in the level2.evt file, extra rows are filled as -1
| Pixel properties | Quadrant properties | ||||||
|---|---|---|---|---|---|---|---|
| Quadrant | DetID | PixID | Counts | Sigma | Mean | Median | Sigma |
| A | 0 | 29 | 2984 | 11.28 | 798 | 746 | 198.3 |
| A | 7 | 110 | 2424 | 8.46 | 798 | 746 | 198.3 |
| A | 9 | 19 | 2317 | 7.92 | 798 | 746 | 198.3 |
| B | 2 | 9 | 2283 | 10.16 | 766 | 727 | 153.2 |
| B | 2 | 8 | 1929 | 7.85 | 766 | 727 | 153.2 |
| B | 3 | 17 | 1922 | 7.8 | 766 | 727 | 153.2 |
| C | 1 | 80 | 2243 | 7.78 | 773 | 722 | 195.5 |
| C | 1 | 81 | 2229 | 7.71 | 773 | 722 | 195.5 |
| C | 3 | 126 | 2063 | 6.86 | 773 | 722 | 195.5 |
| D | 3 | 14 | 1528 | 6.27 | 589 | 536 | 158.3 |
| D | 13 | 238 | 1513 | 6.17 | 589 | 536 | 158.3 |
| D | 6 | 231 | 1471 | 5.91 | 589 | 536 | 158.3 |
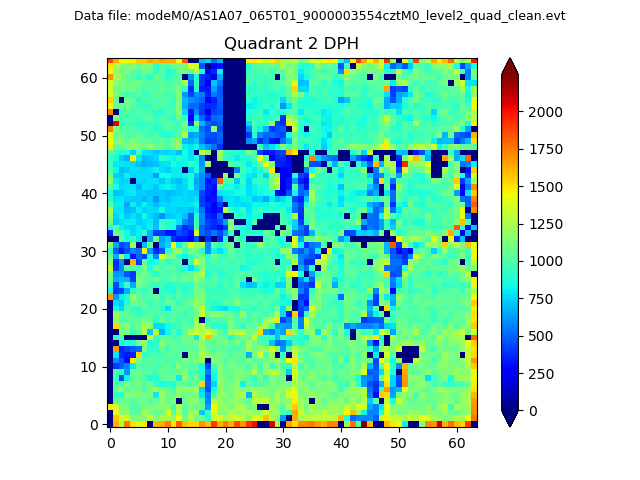
Histogram calculated using DETX and DETY for each event in the final _common_clean file
| Quadrant A | 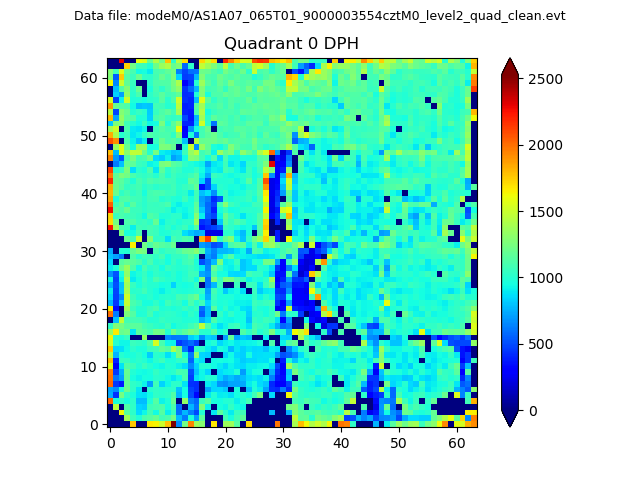 |
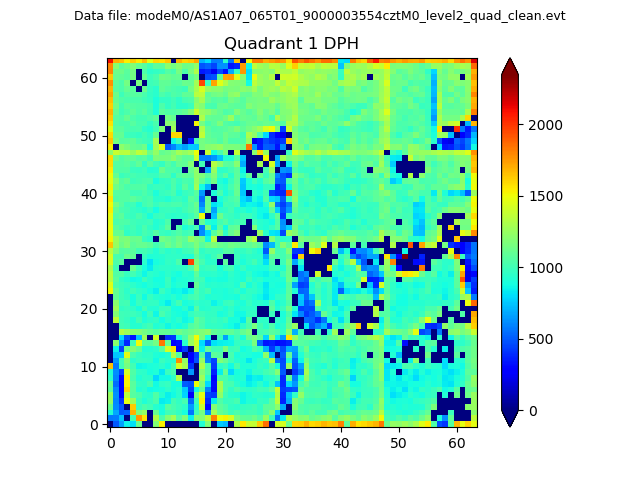 |
Quadrant B |
|---|---|---|---|
| Quadrant D |  |
 |
Quadrant C |
| Plot type | Count rate plots | Images |
|---|---|---|
| Comparison with Poisson distribution Blue bars denote a histogram of data divided into 1 sec bins. Red curve is a Poisson curve with rate = median count rate of data. |
 |
 |
| Quadrant-wise count rates Data is divided into 100 sec bins |
 |
|
| Module-wise count rates for Quadrant A Data is divided into 100 sec bins |
 |
 |
| Module-wise count rates for Quadrant B Data is divided into 100 sec bins |
 |
 |
| Module-wise count rates for Quadrant C Data is divided into 100 sec bins |
 |
 |
| Module-wise count rates for Quadrant D Data is divided into 100 sec bins |
 |
 |
| Parameter | Plot |
|---|---|
| CZT HV Monitor |  |
| D_VDD |  |
| Temperature 1 | 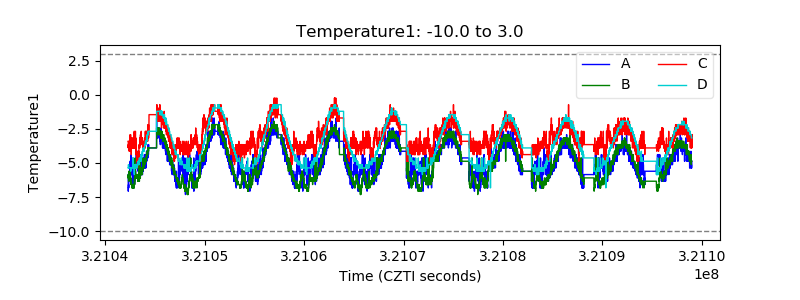 |
| Veto HV Monitor |  |
| Veto LLD |  |
| Alpha Counter |  |
| _CPM_Rate |  |
| CZT Counter |  |
| +2.5 Volts monitor |  |
| +5 Volts monitor |  |
| _ROLL_ROT | 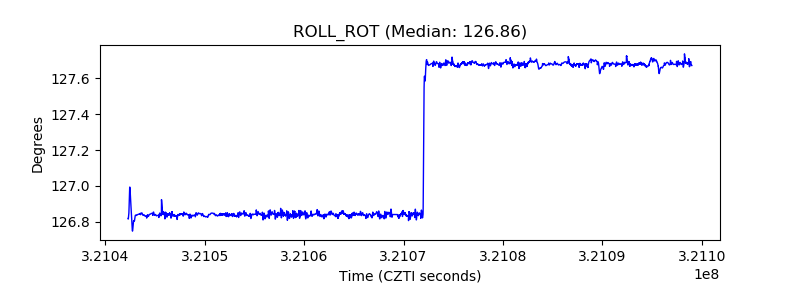 |
| _Roll_DEC | 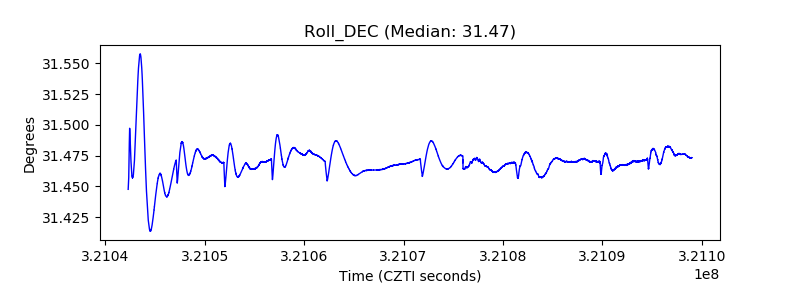 |
| _Roll_RA |  |
| Veto Counter |  |