| Param | Original file | Final file |
|---|---|---|
| Filename | modeM0/AS1A07_065T01_9000003554_23974cztM0_level2.evt | modeM0/AS1A07_065T01_9000003554_23974cztM0_level2_quad_clean.evt |
| Size (bytes) | 673,577,280 | 102,795,840 |
| Size | 642.4 MB | 98.0 MB |
| Events in quadrant A | 3,571,181 | 679,192 |
| Events in quadrant B | 4,682,900 | 667,029 |
| Events in quadrant C | 3,750,484 | 645,332 |
| Events in quadrant D | 7,897,982 | 610,516 |
| Mode M9 | |||
|---|---|---|---|
| Quadrant | BADHDUFLAG | Total packets | Discarded packets |
| A | 0 | 7 | 0 |
| B | 0 | 8 | 0 |
| C | 0 | 8 | 0 |
| D | 0 | 8 | 0 |
| Mode M0 | |||
|---|---|---|---|
| Quadrant | BADHDUFLAG | Total packets | Discarded packets |
| A | 0 | 15433 | 2 |
| B | 0 | 18671 | 2 |
| C | 0 | 15801 | 2 |
| D | 0 | 28557 | 4 |
| Mode SS | |||
|---|---|---|---|
| Quadrant | BADHDUFLAG | Total packets | Discarded packets |
| A | 0 | 150 | 0 |
| B | 0 | 150 | 0 |
| C | 0 | 150 | 0 |
| D | 0 | 150 | 0 |
| Quadrant | Total seconds | Saturated seconds | Saturation percentage |
|---|---|---|---|
| A | 7329 | 111 | 1.514531% |
| B | 7329 | 572 | 7.804612% |
| C | 7329 | 222 | 3.029063% |
| D | 7328 | 1426 | 19.459607% |
Noise dominated data is calculated using 1-second bins in cleaned event files. If a bin has >2000 counts, and if more than 50% of those come from <1% of pixels, then it is considered to be noise-dominated and hence unusable.
| Quadrant | # 1 sec bins | Bins with >0 counts | Bins with >2000 counts | High rate bins dominated by noise | Noise dominated (total time) | Noise dominated (detector-on time) | Marked lightcurve |
|---|---|---|---|---|---|---|---|
| A | 7644 | 7330 | 0 | 0 | 0.00% | 0.00% | 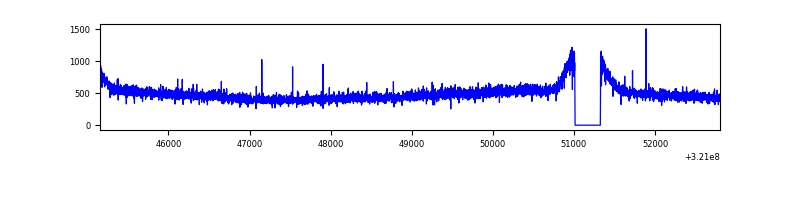 |
| B | 7644 | 7330 | 315 | 315 | 4.12% | 4.30% | 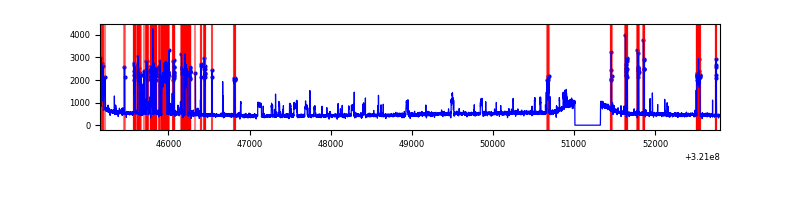 |
| C | 7644 | 7330 | 63 | 63 | 0.82% | 0.86% | 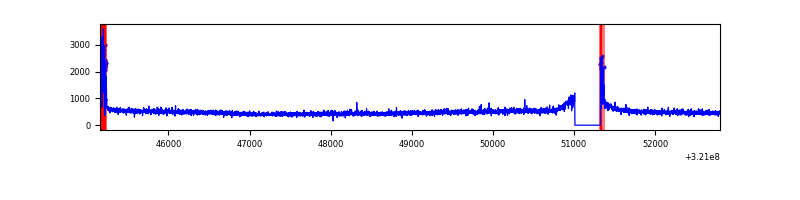 |
| D | 7643 | 7329 | 957 | 957 | 12.52% | 13.06% | 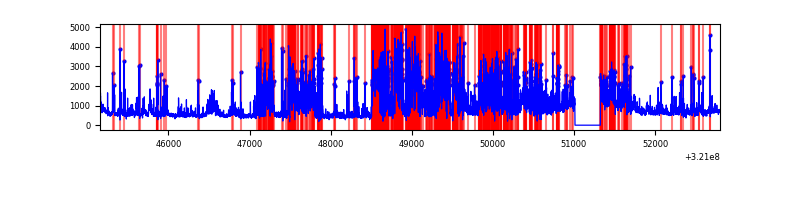 |
Top three noisy pixels from each quadrant. If the there are fewer than three noisy pixels in the level2.evt file, extra rows are filled as -1
| Pixel properties | Quadrant properties | ||||||
|---|---|---|---|---|---|---|---|
| Quadrant | DetID | PixID | Counts | Sigma | Mean | Median | Sigma |
| A | 13 | 254 | 12489 | 61.75 | 925 | 905 | 187.6 |
| A | 3 | 137 | 8382 | 39.86 | 925 | 905 | 187.6 |
| A | 0 | 226 | 8093 | 38.32 | 925 | 905 | 187.6 |
| B | 4 | 200 | 1064868 | 6116.96 | 902 | 878 | 173.9 |
| B | 0 | 197 | 44463 | 250.57 | 902 | 878 | 173.9 |
| B | 0 | 190 | 33038 | 184.89 | 902 | 878 | 173.9 |
| C | 0 | 10 | 198792 | 967.08 | 874 | 880 | 204.6 |
| C | 14 | 238 | 135935 | 659.93 | 874 | 880 | 204.6 |
| C | 13 | 61 | 6066 | 25.34 | 874 | 880 | 204.6 |
| D | 12 | 218 | 3929196 | 19368.66 | 826 | 802 | 202.8 |
| D | 8 | 195 | 217608 | 1068.95 | 826 | 802 | 202.8 |
| D | 7 | 238 | 180842 | 887.67 | 826 | 802 | 202.8 |
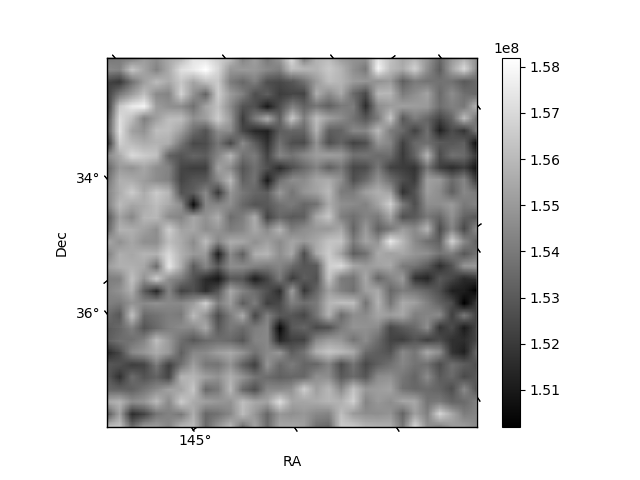
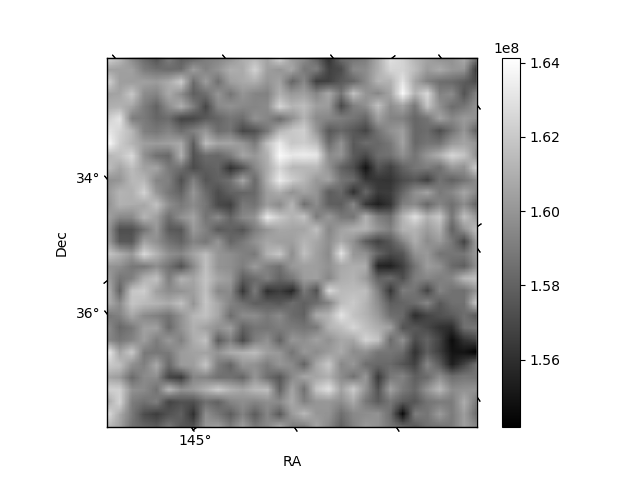
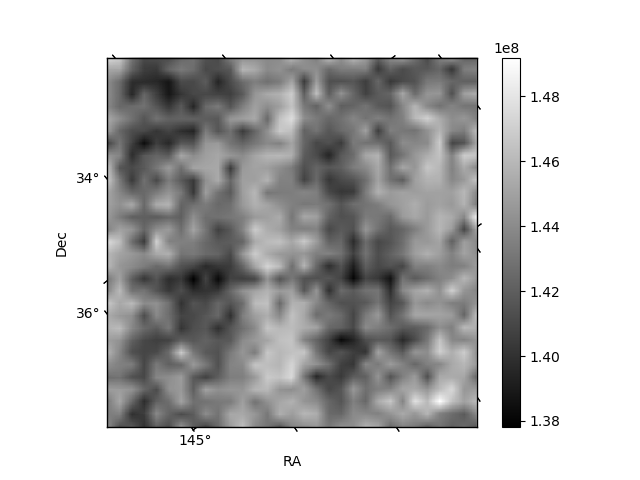
Histogram calculated using DETX and DETY for each event in the final _common_clean file
| Quadrant A | 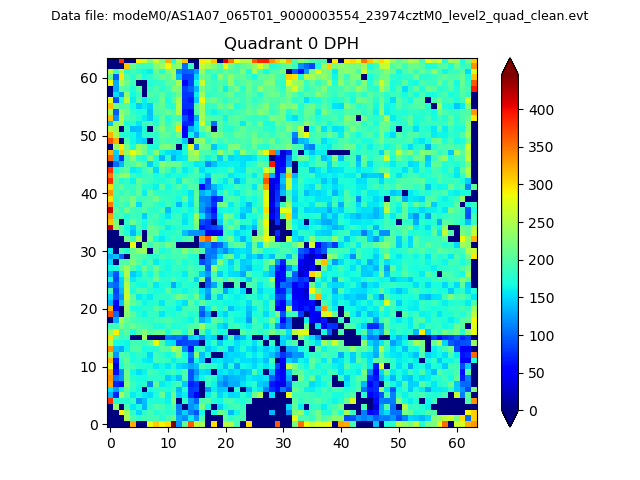 |
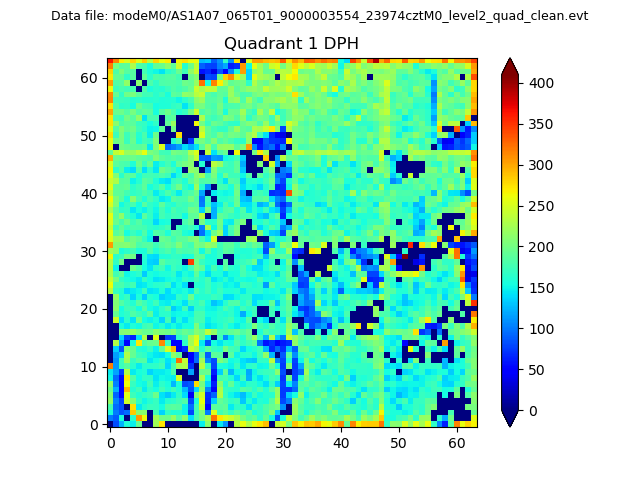 |
Quadrant B |
|---|---|---|---|
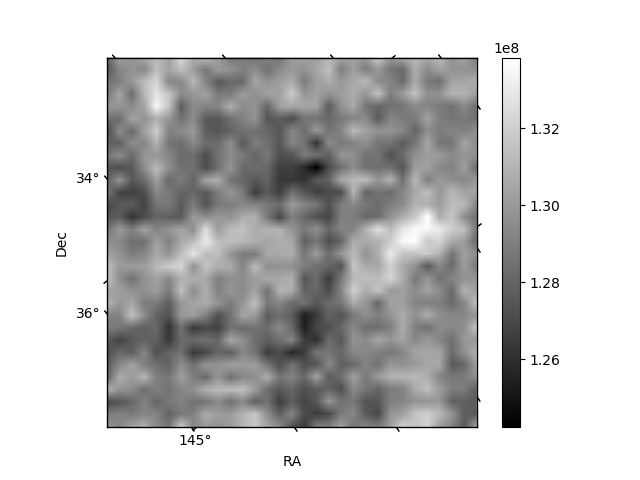
| Quadrant D | 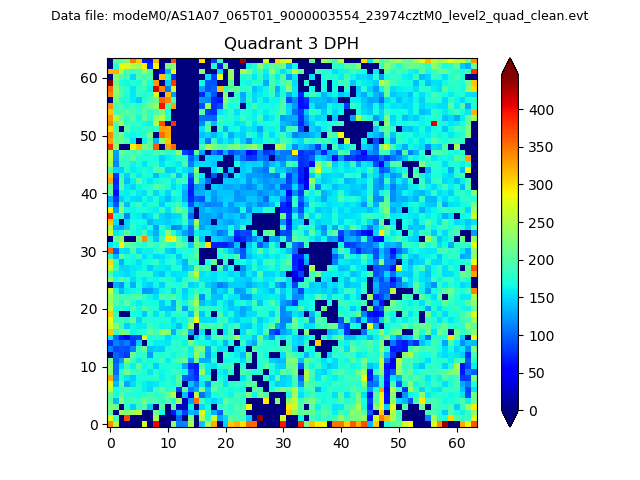 |
 |
Quadrant C |
| Plot type | Count rate plots | Images |
|---|---|---|
| Comparison with Poisson distribution Blue bars denote a histogram of data divided into 1 sec bins. Red curve is a Poisson curve with rate = median count rate of data. |
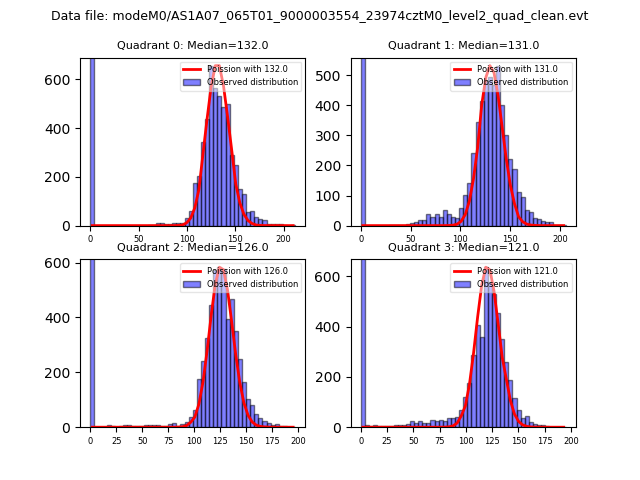 |
 |
| Quadrant-wise count rates Data is divided into 100 sec bins |
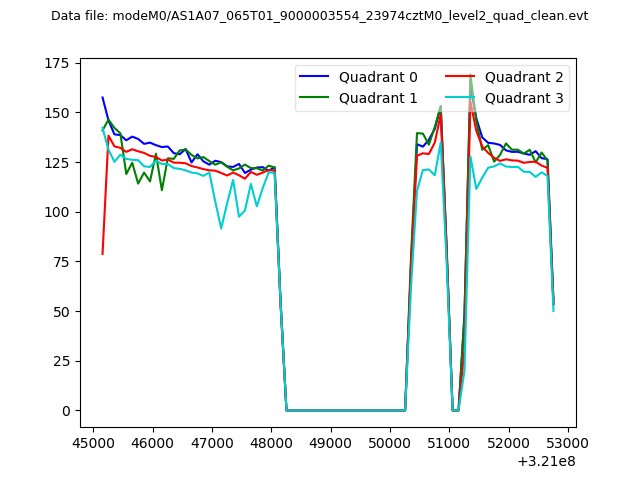 |
|
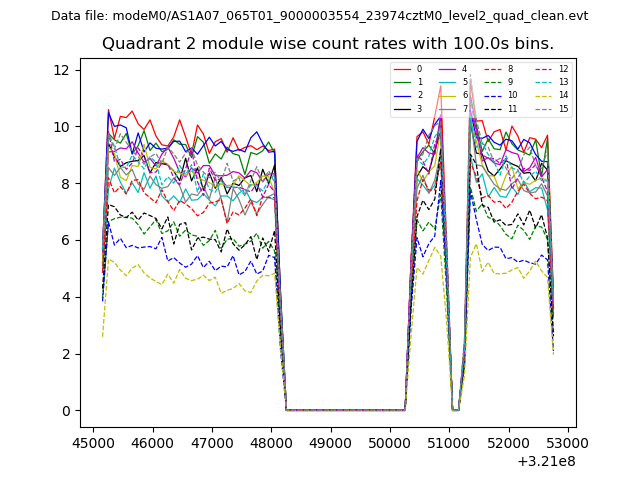
| Module-wise count rates for Quadrant A Data is divided into 100 sec bins |
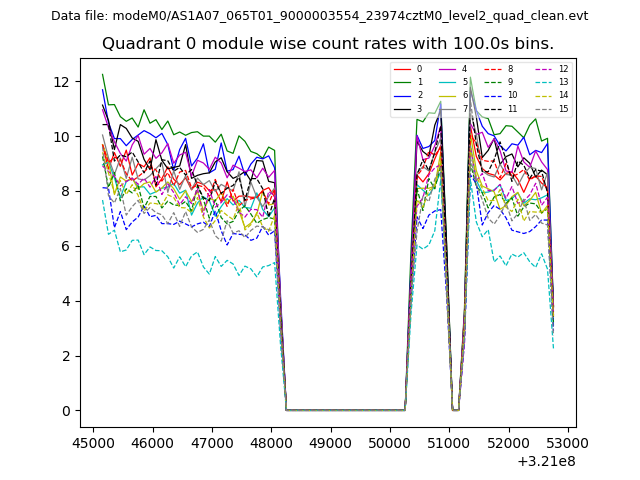 |
 |
| Module-wise count rates for Quadrant B Data is divided into 100 sec bins |
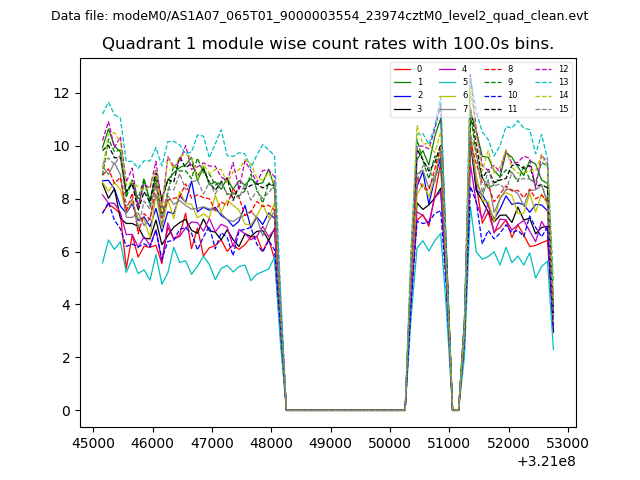 |
 |
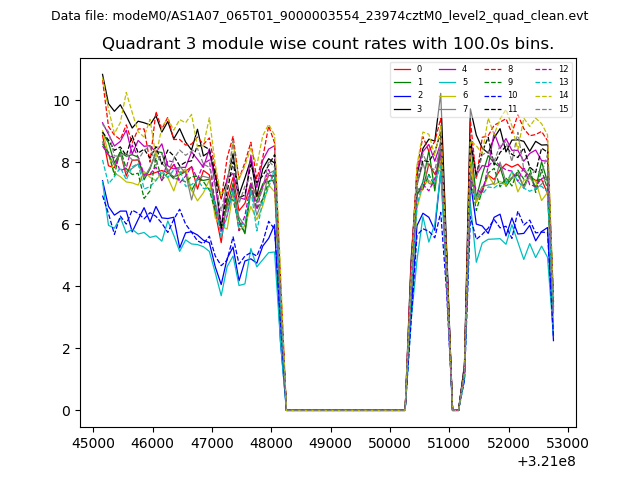
| Module-wise count rates for Quadrant C Data is divided into 100 sec bins |
 |
 |
| Module-wise count rates for Quadrant D Data is divided into 100 sec bins |
 |
 |
| Parameter | Plot |
|---|---|
| CZT HV Monitor | 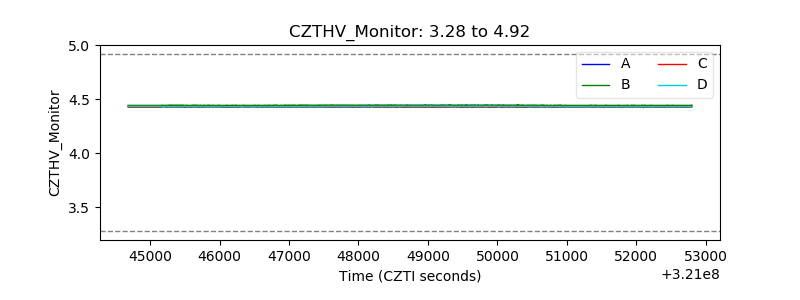 |
| D_VDD | 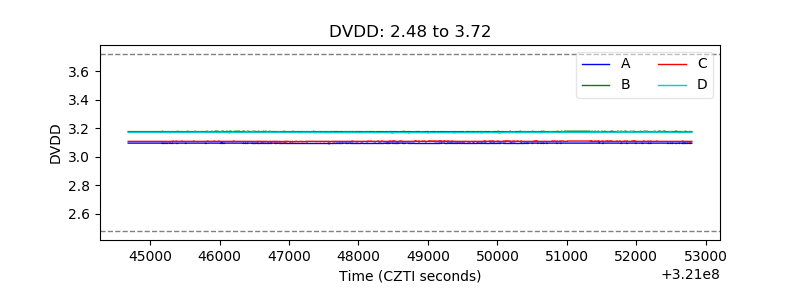 |
| Temperature 1 | 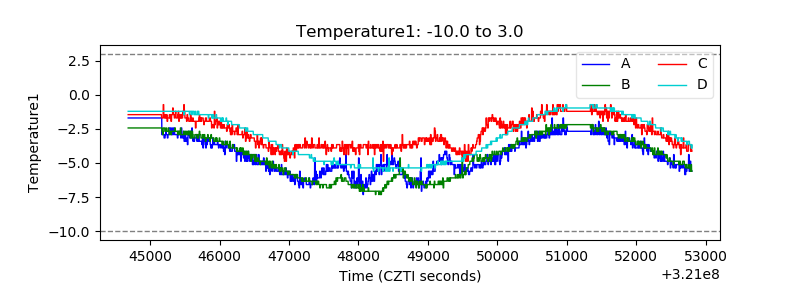 |
| Veto HV Monitor | 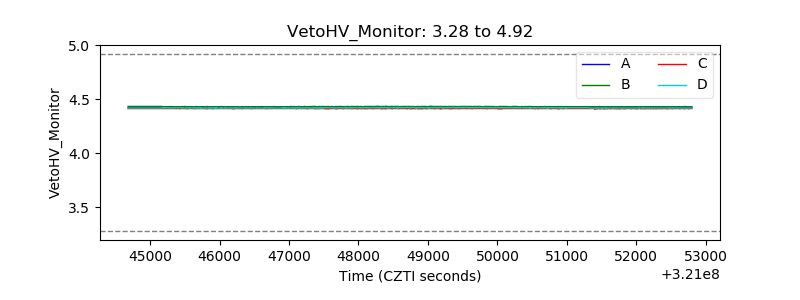 |
| Veto LLD | 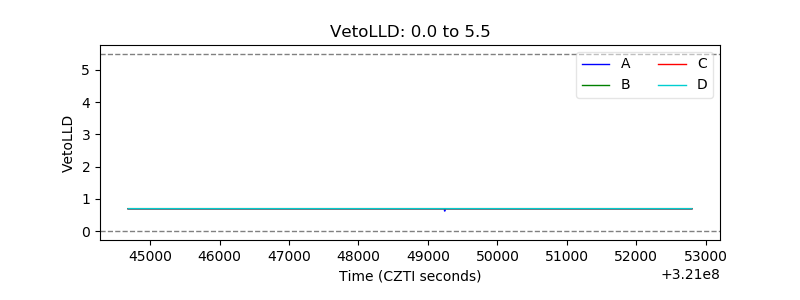 |
| Alpha Counter | 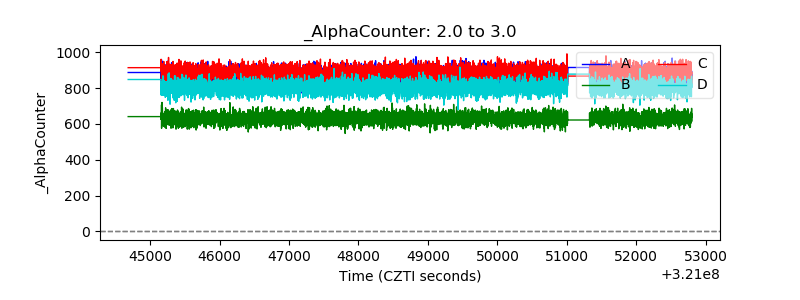 |
| _CPM_Rate | 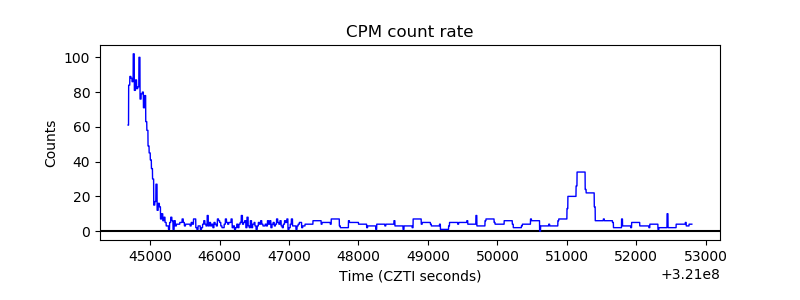 |
| CZT Counter |  |
| +2.5 Volts monitor |  |
| +5 Volts monitor |  |
| _ROLL_ROT |  |
| _Roll_DEC | 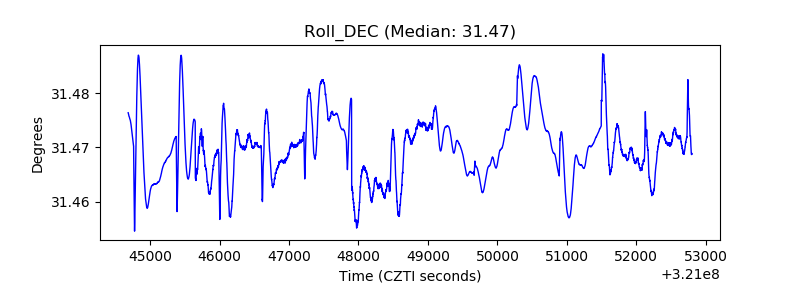 |
| _Roll_RA |  |
| Veto Counter |  |