| Param | Original file | Final file |
|---|---|---|
| Filename | modeM0/AS1A07_065T01_9000003554_23975cztM0_level2.evt | modeM0/AS1A07_065T01_9000003554_23975cztM0_level2_quad_clean.evt |
| Size (bytes) | 622,707,840 | 106,511,040 |
| Size | 593.9 MB | 101.6 MB |
| Events in quadrant A | 3,578,021 | 701,129 |
| Events in quadrant B | 4,089,047 | 702,696 |
| Events in quadrant C | 3,700,763 | 673,013 |
| Events in quadrant D | 6,978,937 | 622,704 |
| Mode M9 | |||
|---|---|---|---|
| Quadrant | BADHDUFLAG | Total packets | Discarded packets |
| A | 0 | 6 | 0 |
| B | 0 | 7 | 0 |
| C | 0 | 7 | 0 |
| D | 0 | 7 | 0 |
| Mode M0 | |||
|---|---|---|---|
| Quadrant | BADHDUFLAG | Total packets | Discarded packets |
| A | 0 | 15738 | 2 |
| B | 0 | 17097 | 2 |
| C | 0 | 15955 | 2 |
| D | 0 | 26095 | 2 |
| Mode SS | |||
|---|---|---|---|
| Quadrant | BADHDUFLAG | Total packets | Discarded packets |
| A | 0 | 154 | 0 |
| B | 0 | 154 | 0 |
| C | 0 | 154 | 0 |
| D | 0 | 154 | 0 |
| Quadrant | Total seconds | Saturated seconds | Saturation percentage |
|---|---|---|---|
| A | 7562 | 59 | 0.780217% |
| B | 7562 | 216 | 2.856387% |
| C | 7562 | 165 | 2.181962% |
| D | 7562 | 677 | 8.952658% |
Noise dominated data is calculated using 1-second bins in cleaned event files. If a bin has >2000 counts, and if more than 50% of those come from <1% of pixels, then it is considered to be noise-dominated and hence unusable.
| Quadrant | # 1 sec bins | Bins with >0 counts | Bins with >2000 counts | High rate bins dominated by noise | Noise dominated (total time) | Noise dominated (detector-on time) | Marked lightcurve |
|---|---|---|---|---|---|---|---|
| A | 7912 | 7564 | 0 | 0 | 0.00% | 0.00% | 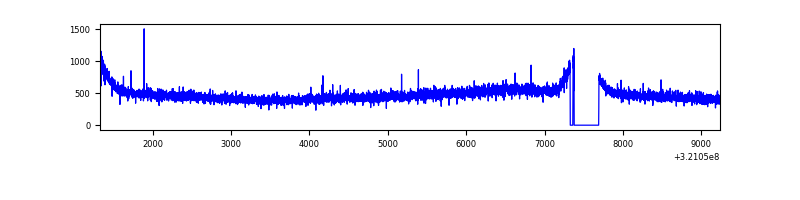 |
| B | 7912 | 7564 | 113 | 113 | 1.43% | 1.49% | 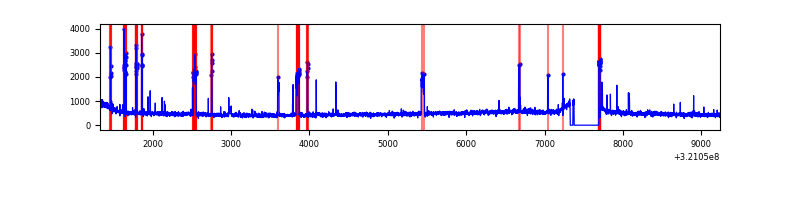 |
| C | 7912 | 7564 | 13 | 13 | 0.16% | 0.17% | 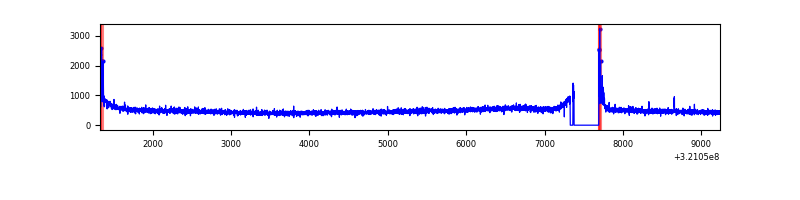 |
| D | 7912 | 7563 | 464 | 464 | 5.86% | 6.14% | 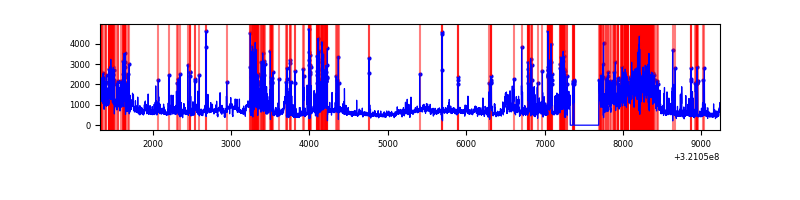 |
Top three noisy pixels from each quadrant. If the there are fewer than three noisy pixels in the level2.evt file, extra rows are filled as -1
| Pixel properties | Quadrant properties | ||||||
|---|---|---|---|---|---|---|---|
| Quadrant | DetID | PixID | Counts | Sigma | Mean | Median | Sigma |
| A | 13 | 254 | 12684 | 62.44 | 927 | 905 | 188.6 |
| A | 3 | 137 | 8520 | 40.37 | 927 | 905 | 188.6 |
| A | 0 | 226 | 7960 | 37.4 | 927 | 905 | 188.6 |
| B | 4 | 200 | 450754 | 2533.08 | 916 | 891 | 177.6 |
| B | 12 | 111 | 21764 | 117.53 | 916 | 891 | 177.6 |
| B | 11 | 111 | 19428 | 104.38 | 916 | 891 | 177.6 |
| C | 14 | 238 | 140057 | 663.96 | 888 | 892 | 209.6 |
| C | 0 | 10 | 90239 | 426.27 | 888 | 892 | 209.6 |
| C | 2 | 16 | 6419 | 26.37 | 888 | 892 | 209.6 |
| D | 12 | 218 | 1559914 | 7328.26 | 872 | 847 | 212.7 |
| D | 7 | 238 | 824046 | 3869.37 | 872 | 847 | 212.7 |
| D | 8 | 195 | 591530 | 2776.45 | 872 | 847 | 212.7 |
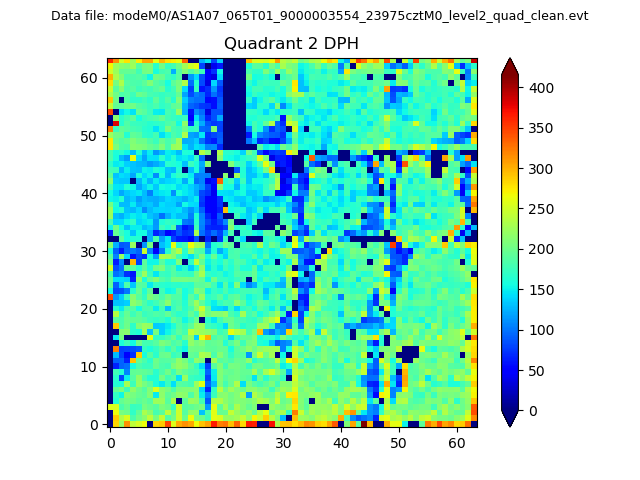
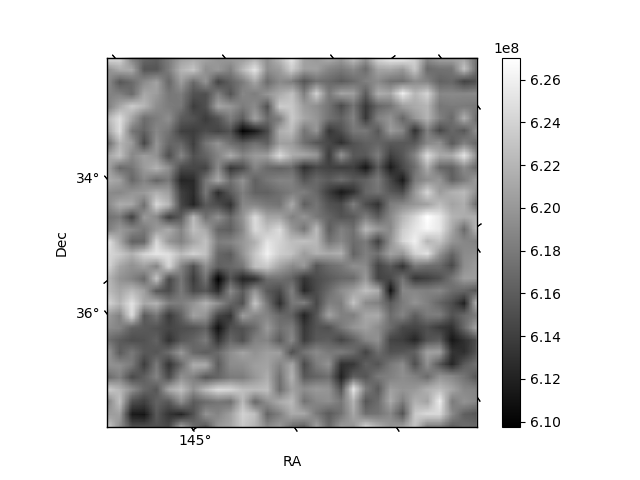
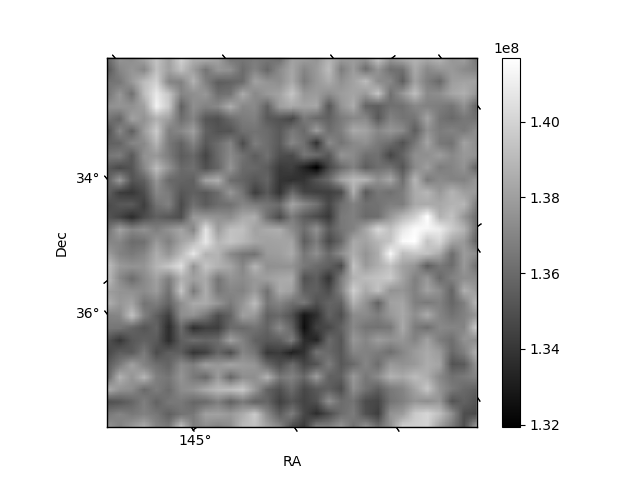
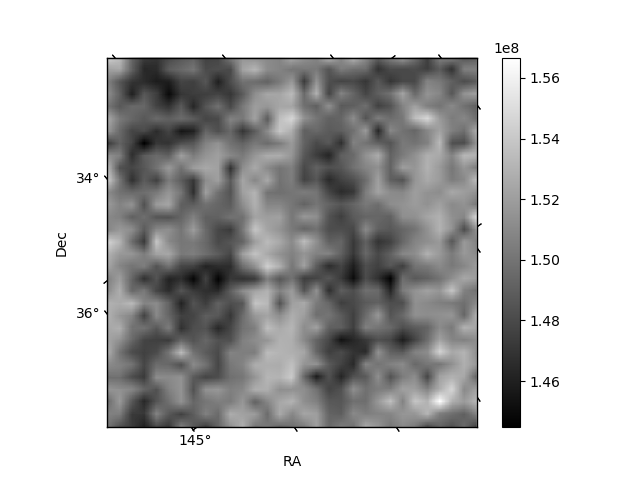
Histogram calculated using DETX and DETY for each event in the final _common_clean file
| Quadrant A | 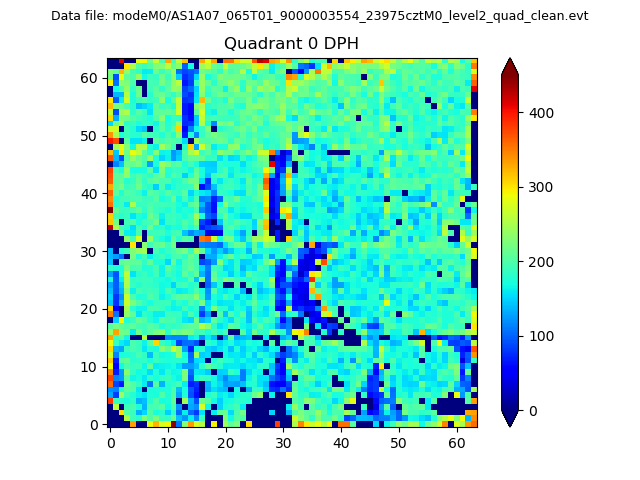 |
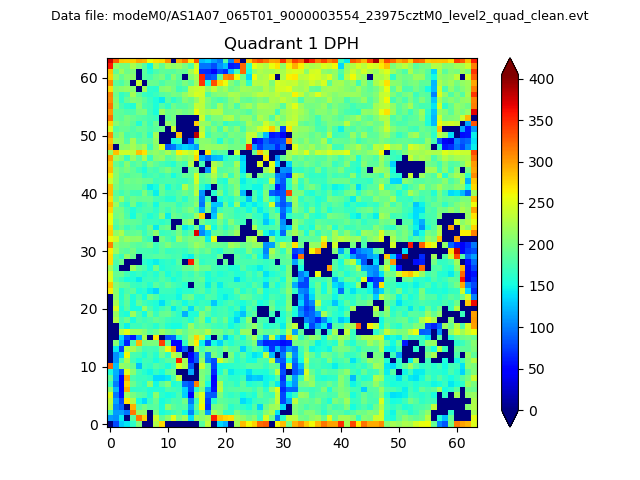 |
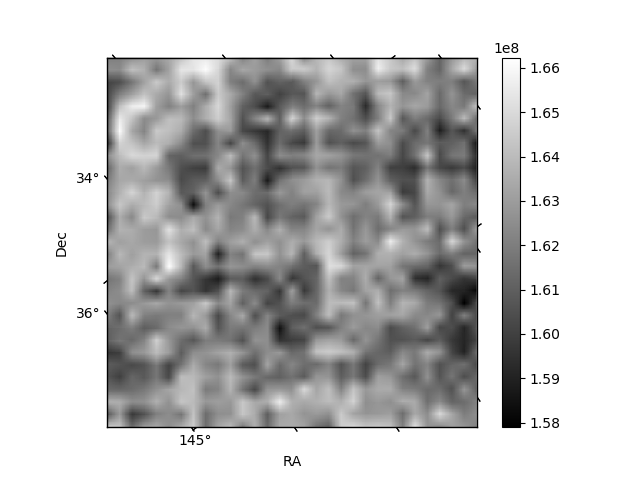
Quadrant B |
|---|---|---|---|
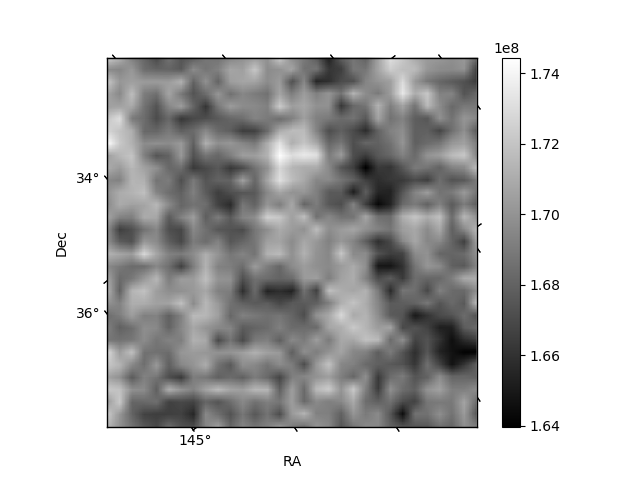
| Quadrant D | 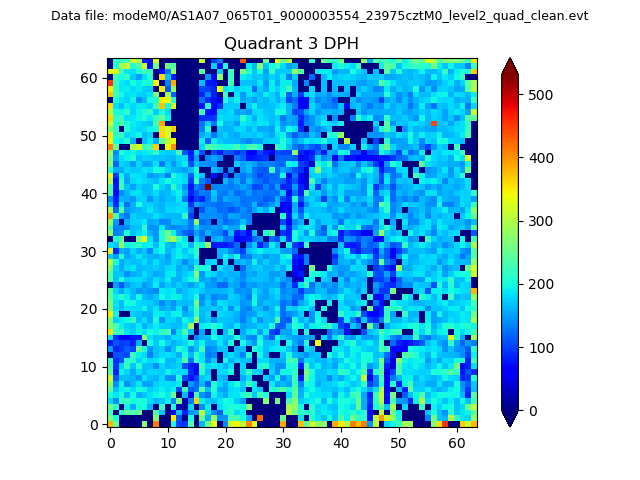 |
 |
Quadrant C |
| Plot type | Count rate plots | Images |
|---|---|---|
| Comparison with Poisson distribution Blue bars denote a histogram of data divided into 1 sec bins. Red curve is a Poisson curve with rate = median count rate of data. |
 |
 |
| Quadrant-wise count rates Data is divided into 100 sec bins |
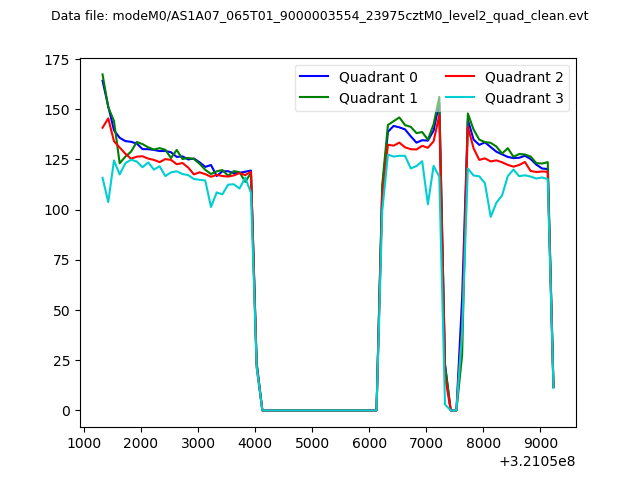 |
|
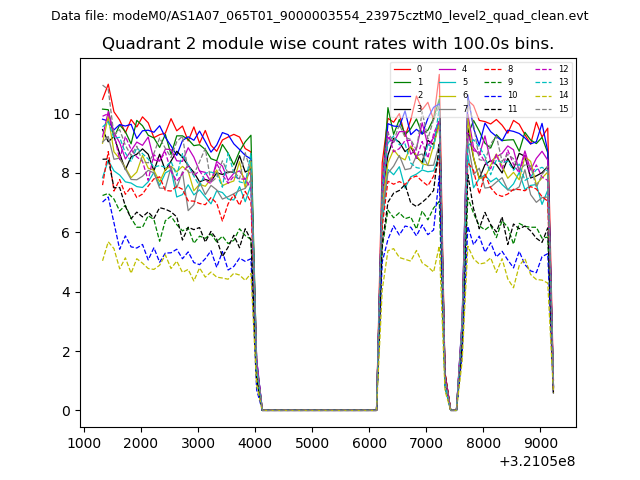
| Module-wise count rates for Quadrant A Data is divided into 100 sec bins |
 |
 |
| Module-wise count rates for Quadrant B Data is divided into 100 sec bins |
 |
 |
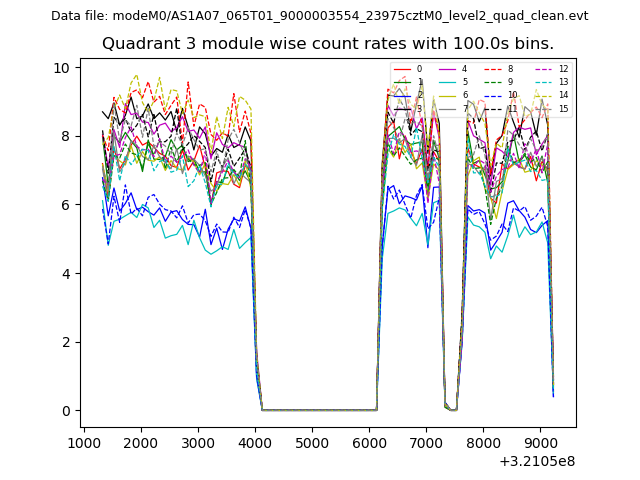
| Module-wise count rates for Quadrant C Data is divided into 100 sec bins |
 |
 |
| Module-wise count rates for Quadrant D Data is divided into 100 sec bins |
 |
 |
| Parameter | Plot |
|---|---|
| CZT HV Monitor |  |
| D_VDD | 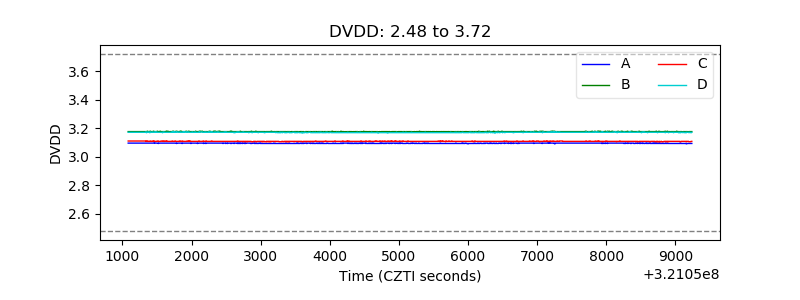 |
| Temperature 1 | 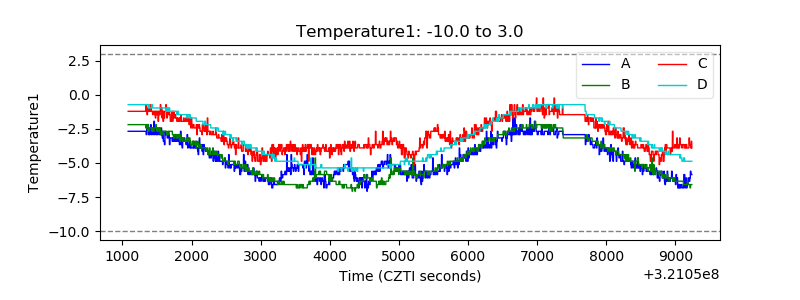 |
| Veto HV Monitor |  |
| Veto LLD | 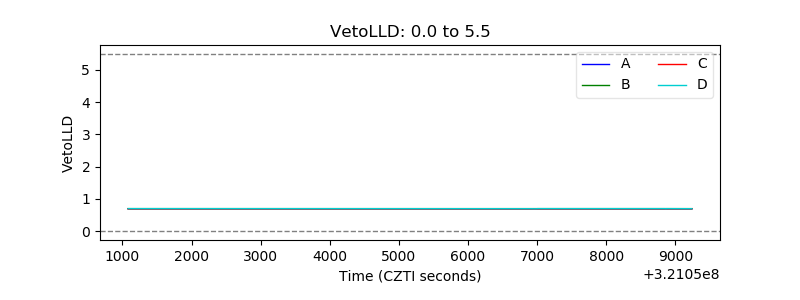 |
| Alpha Counter | 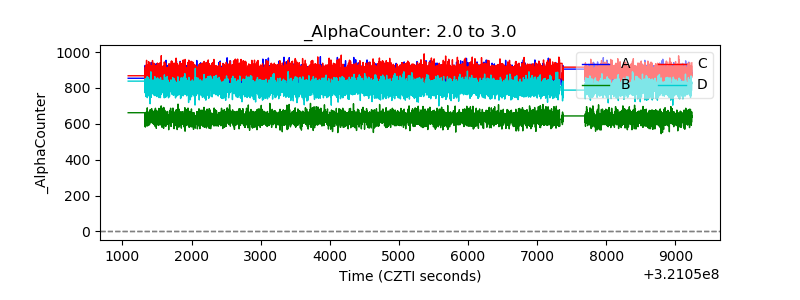 |
| _CPM_Rate | 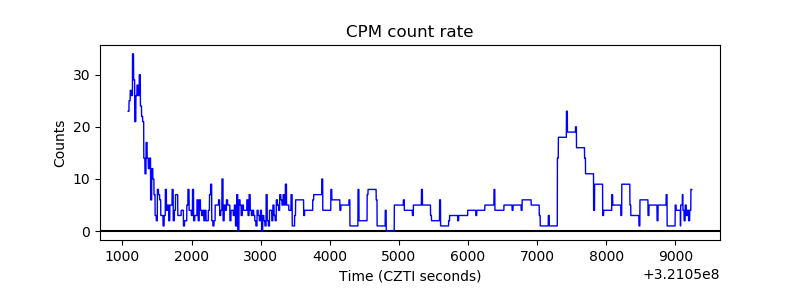 |
| CZT Counter | 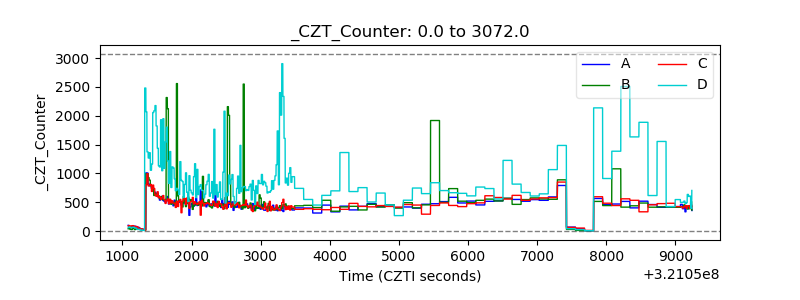 |
| +2.5 Volts monitor |  |
| +5 Volts monitor |  |
| _ROLL_ROT | 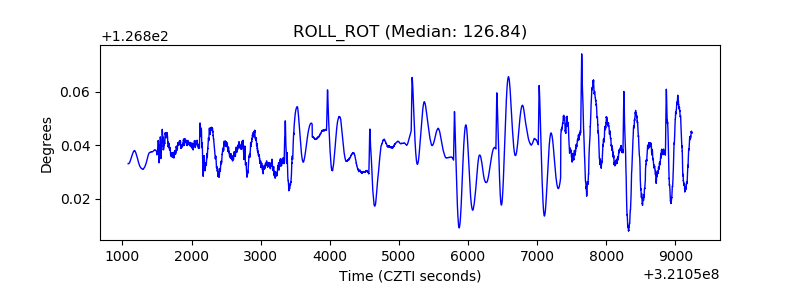 |
| _Roll_DEC | 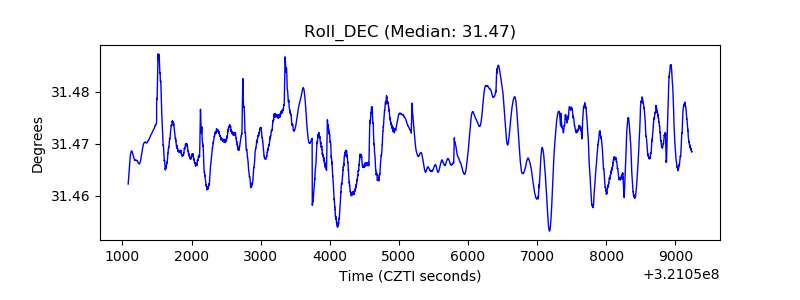 |
| _Roll_RA | 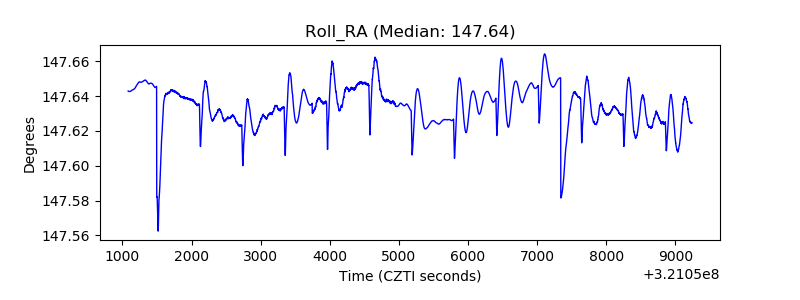 |
| Veto Counter | 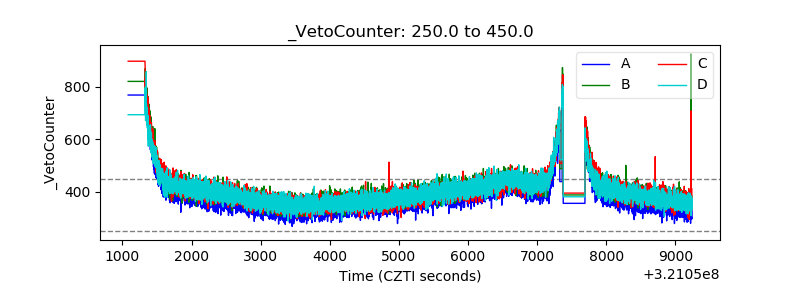 |