| Param | Original file | Final file |
|---|---|---|
| Filename | modeM0/AS1A07_065T01_9000003554_23978cztM0_level2.evt | modeM0/AS1A07_065T01_9000003554_23978cztM0_level2_quad_clean.evt |
| Size (bytes) | 1,798,560,000 | 242,660,160 |
| Size | 1.7 GB | 231.4 MB |
| Events in quadrant A | 9,088,992 | 1,586,009 |
| Events in quadrant B | 11,681,810 | 1,590,768 |
| Events in quadrant C | 9,349,758 | 1,532,851 |
| Events in quadrant D | 23,044,217 | 1,304,762 |
| Mode M9 | |||
|---|---|---|---|
| Quadrant | BADHDUFLAG | Total packets | Discarded packets |
| A | 0 | 22 | 0 |
| B | 0 | 22 | 0 |
| C | 0 | 22 | 0 |
| D | 0 | 22 | 0 |
| Mode M0 | |||
|---|---|---|---|
| Quadrant | BADHDUFLAG | Total packets | Discarded packets |
| A | 0 | 39740 | 4 |
| B | 0 | 47278 | 4 |
| C | 0 | 40397 | 4 |
| D | 0 | 81774 | 4 |
| Mode SS | |||
|---|---|---|---|
| Quadrant | BADHDUFLAG | Total packets | Discarded packets |
| A | 0 | 392 | 0 |
| B | 0 | 392 | 0 |
| C | 0 | 392 | 0 |
| D | 0 | 392 | 0 |
| Quadrant | Total seconds | Saturated seconds | Saturation percentage |
|---|---|---|---|
| A | 19366 | 101 | 0.521533% |
| B | 19367 | 823 | 4.249497% |
| C | 19367 | 325 | 1.678112% |
| D | 19367 | 4765 | 24.603707% |
Noise dominated data is calculated using 1-second bins in cleaned event files. If a bin has >2000 counts, and if more than 50% of those come from <1% of pixels, then it is considered to be noise-dominated and hence unusable.
| Quadrant | # 1 sec bins | Bins with >0 counts | Bins with >2000 counts | High rate bins dominated by noise | Noise dominated (total time) | Noise dominated (detector-on time) | Marked lightcurve |
|---|---|---|---|---|---|---|---|
| A | 21456 | 19371 | 0 | 0 | 0.00% | 0.00% | 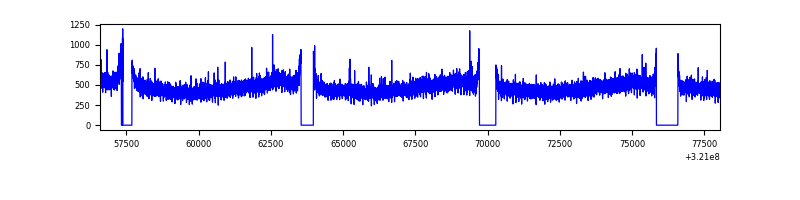 |
| B | 21457 | 19372 | 427 | 427 | 1.99% | 2.20% | 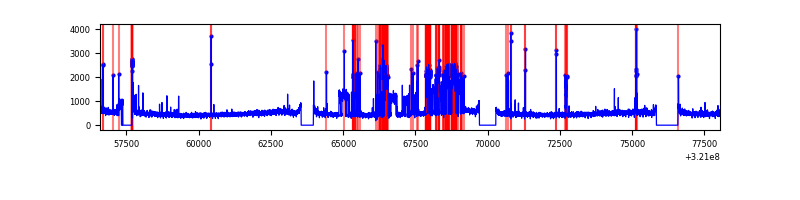 |
| C | 21457 | 19372 | 18 | 18 | 0.08% | 0.09% | 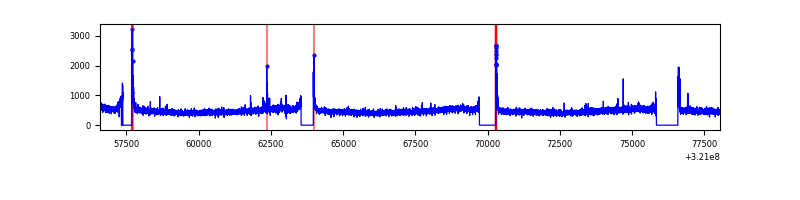 |
| D | 21457 | 19371 | 3712 | 3712 | 17.30% | 19.16% | 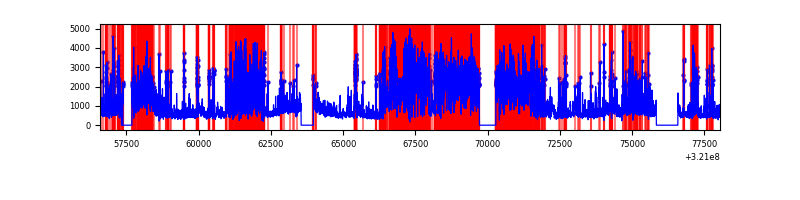 |
Top three noisy pixels from each quadrant. If the there are fewer than three noisy pixels in the level2.evt file, extra rows are filled as -1
| Pixel properties | Quadrant properties | ||||||
|---|---|---|---|---|---|---|---|
| Quadrant | DetID | PixID | Counts | Sigma | Mean | Median | Sigma |
| A | 13 | 254 | 31014 | 60.69 | 2348 | 2295 | 473.2 |
| A | 2 | 79 | 28343 | 55.05 | 2348 | 2295 | 473.2 |
| A | 3 | 137 | 21594 | 40.79 | 2348 | 2295 | 473.2 |
| B | 4 | 200 | 2317437 | 5209.14 | 2315 | 2253 | 444.4 |
| B | 0 | 197 | 167259 | 371.26 | 2315 | 2253 | 444.4 |
| B | 12 | 111 | 55743 | 120.35 | 2315 | 2253 | 444.4 |
| C | 14 | 238 | 356471 | 670.58 | 2253 | 2262 | 528.2 |
| C | 0 | 10 | 211806 | 396.7 | 2253 | 2262 | 528.2 |
| C | 13 | 61 | 15502 | 25.07 | 2253 | 2262 | 528.2 |
| D | 12 | 218 | 10758107 | 21984.07 | 2006 | 1951 | 489.3 |
| D | 1 | 52 | 973106 | 1984.9 | 2006 | 1951 | 489.3 |
| D | 12 | 250 | 833628 | 1699.83 | 2006 | 1951 | 489.3 |
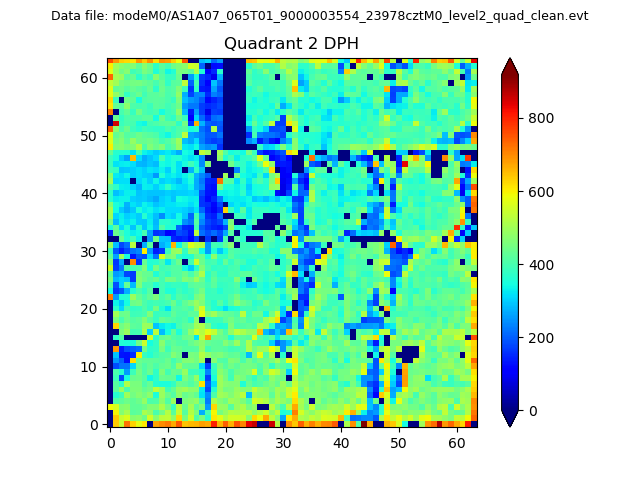
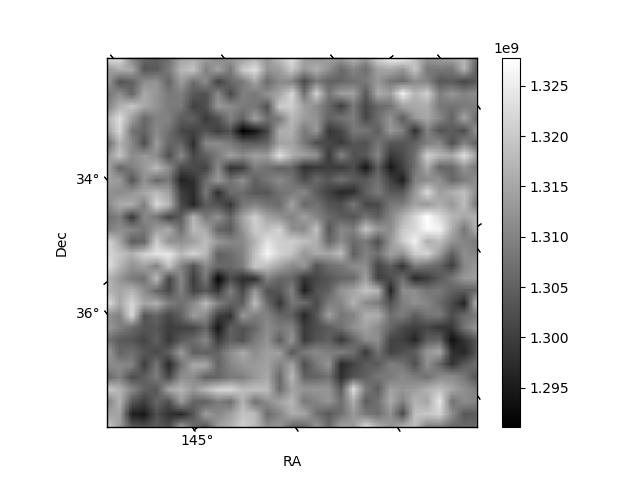
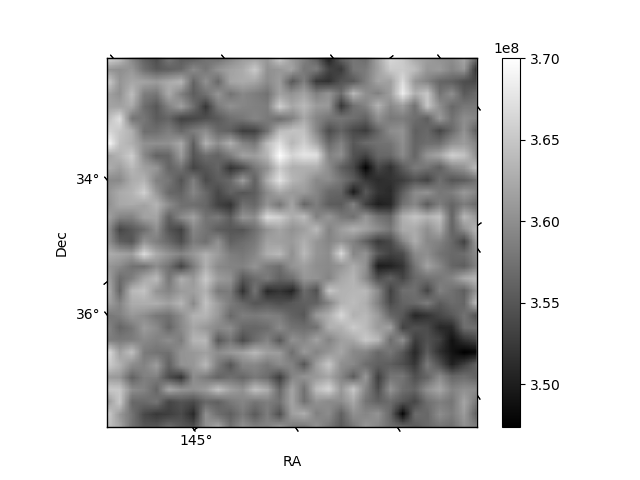
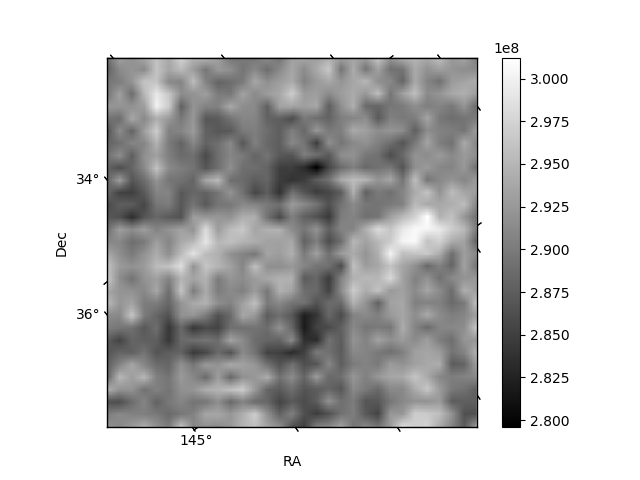
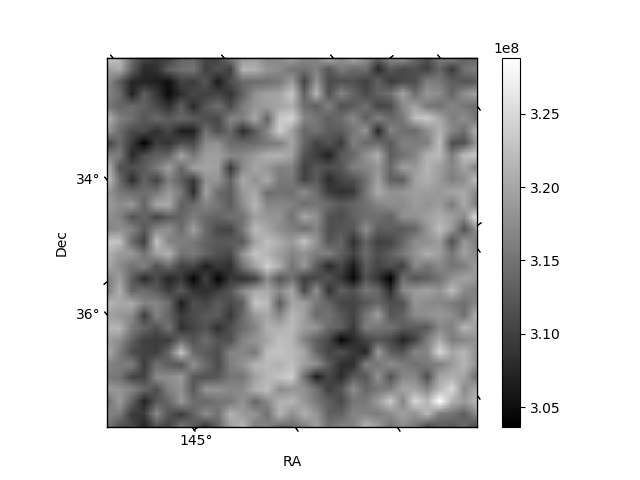
Histogram calculated using DETX and DETY for each event in the final _common_clean file
| Quadrant A | 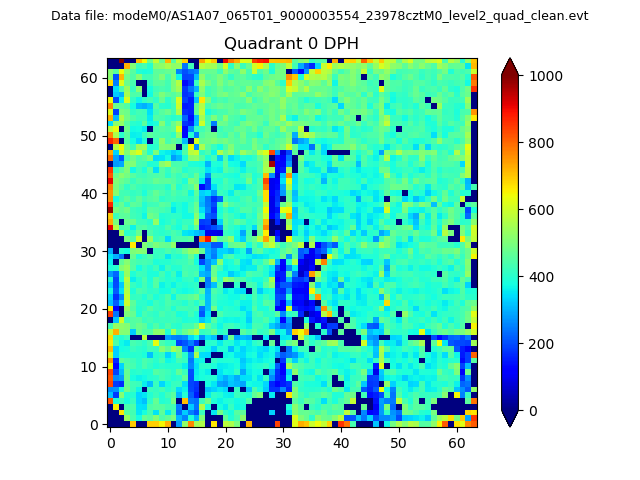 |
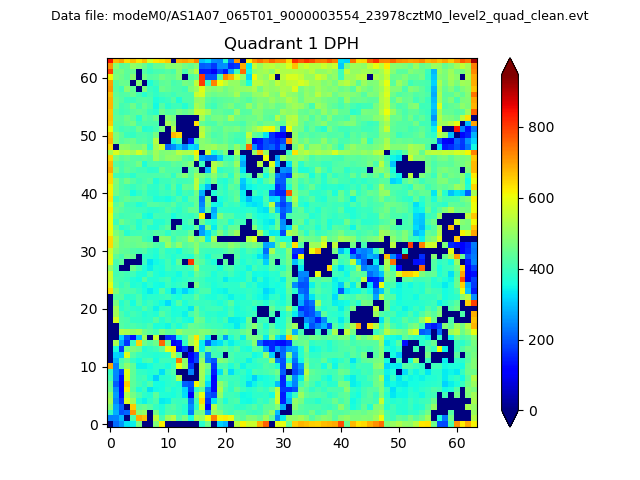 |
Quadrant B |
|---|---|---|---|
| Quadrant D | 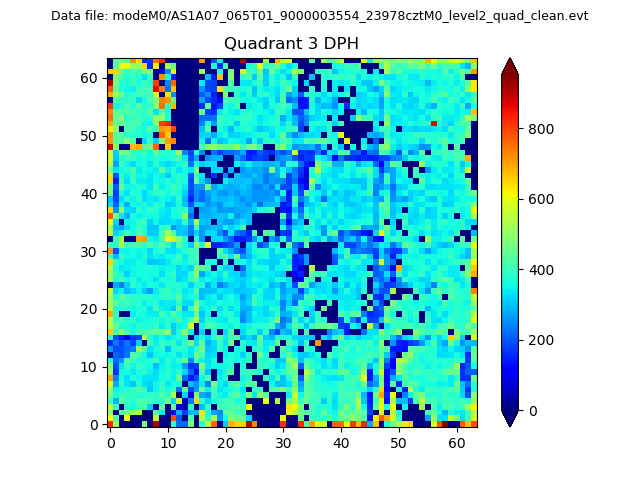 |
 |
Quadrant C |
| Plot type | Count rate plots | Images |
|---|---|---|
| Comparison with Poisson distribution Blue bars denote a histogram of data divided into 1 sec bins. Red curve is a Poisson curve with rate = median count rate of data. |
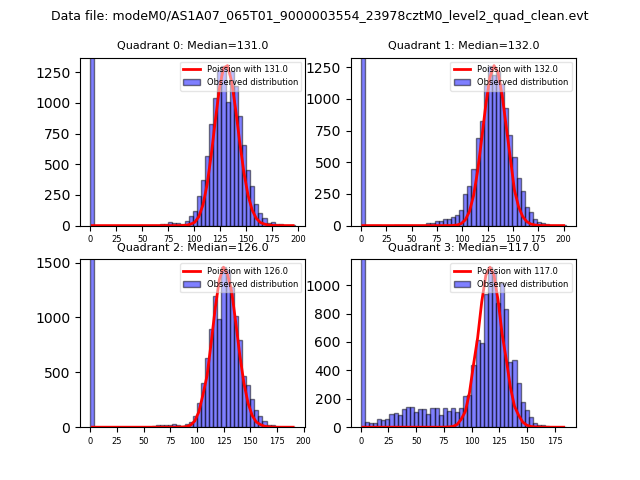 |
 |
| Quadrant-wise count rates Data is divided into 100 sec bins |
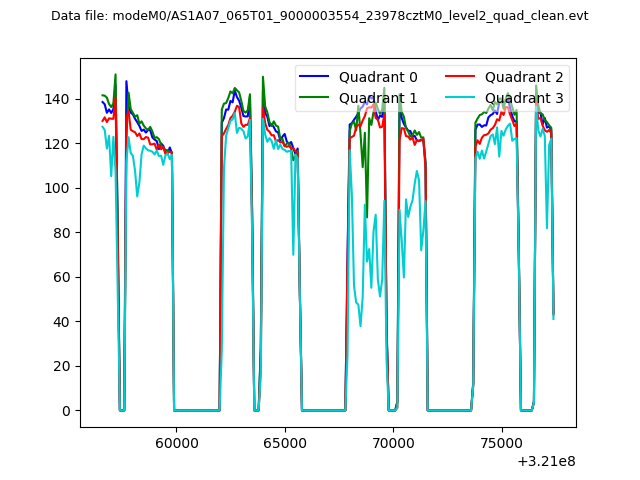 |
|
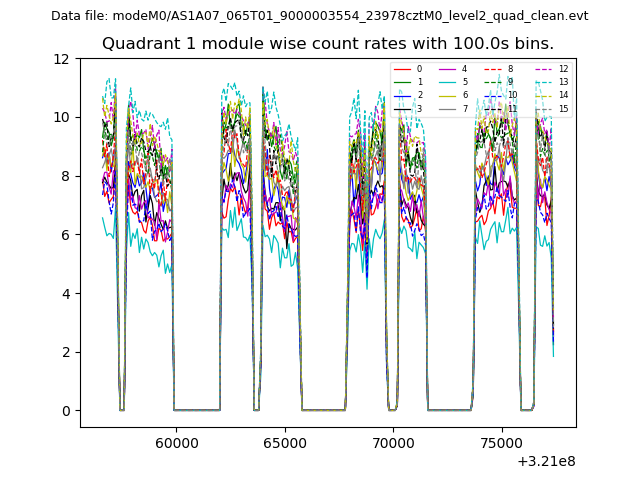
| Module-wise count rates for Quadrant A Data is divided into 100 sec bins |
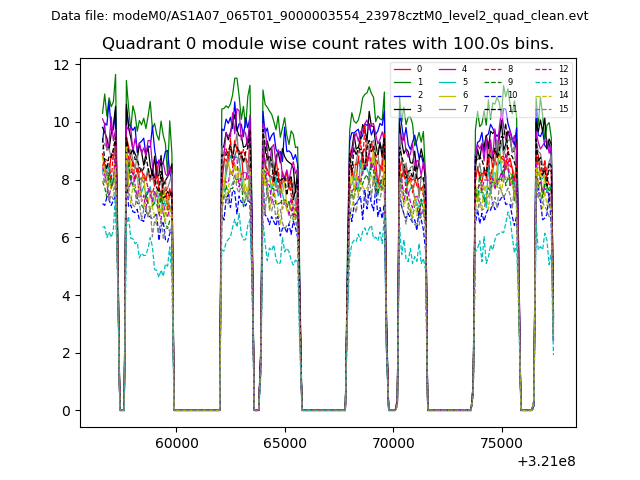 |
 |
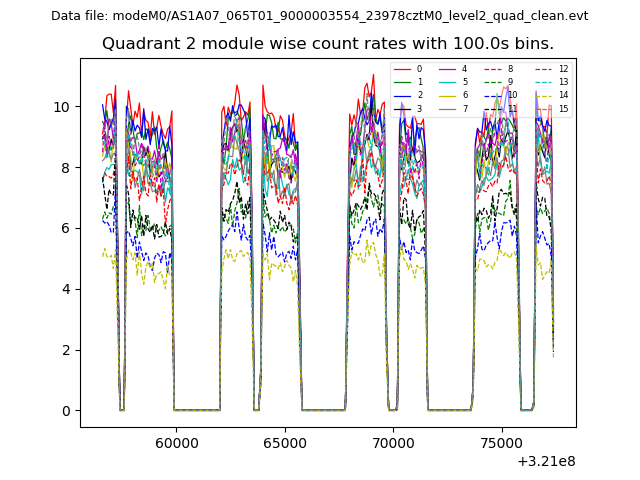
| Module-wise count rates for Quadrant B Data is divided into 100 sec bins |
 |
 |
| Module-wise count rates for Quadrant C Data is divided into 100 sec bins |
 |
 |
| Module-wise count rates for Quadrant D Data is divided into 100 sec bins |
 |
 |
| Parameter | Plot |
|---|---|
| CZT HV Monitor | 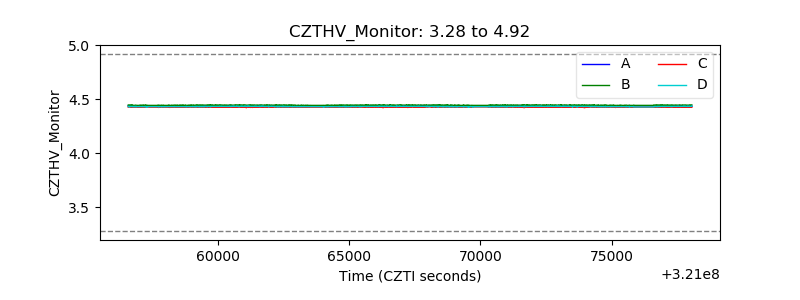 |
| D_VDD | 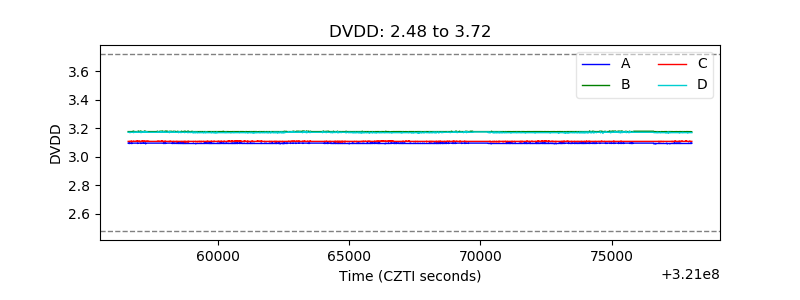 |
| Temperature 1 | 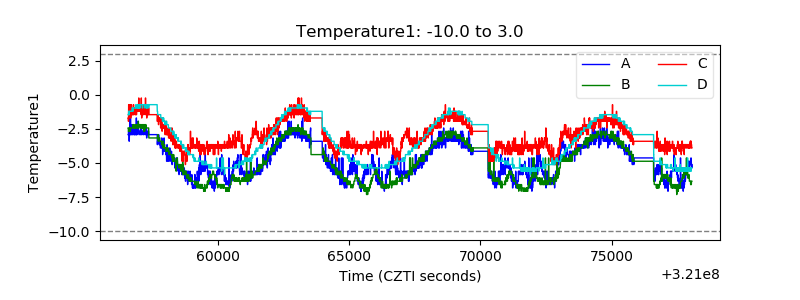 |
| Veto HV Monitor | 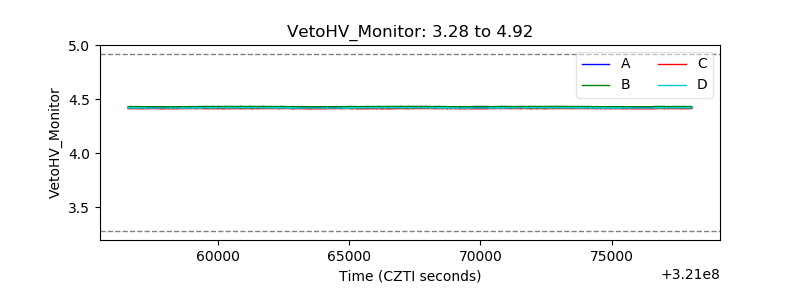 |
| Veto LLD | 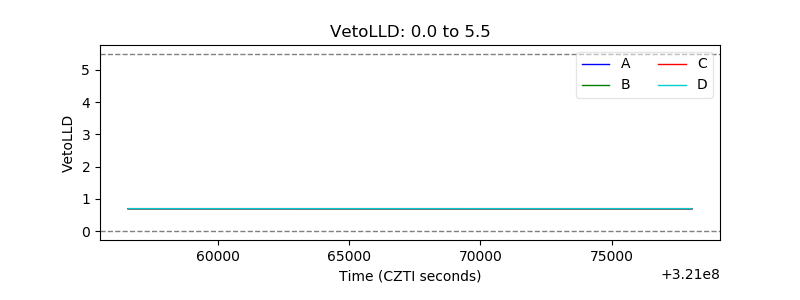 |
| Alpha Counter | 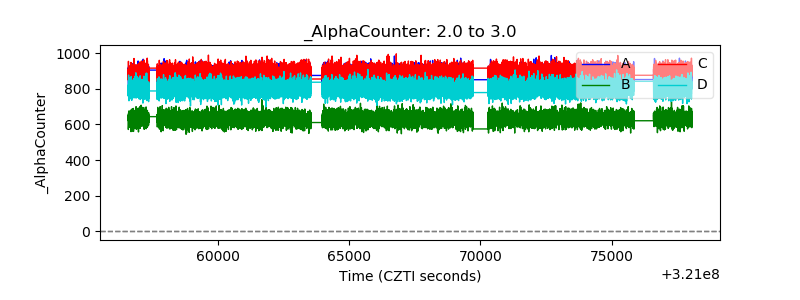 |
| _CPM_Rate | 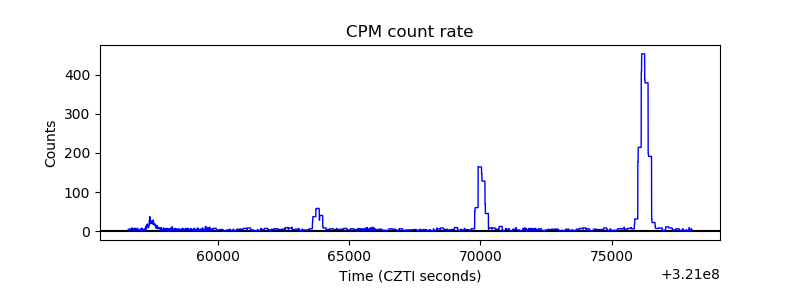 |
| CZT Counter | 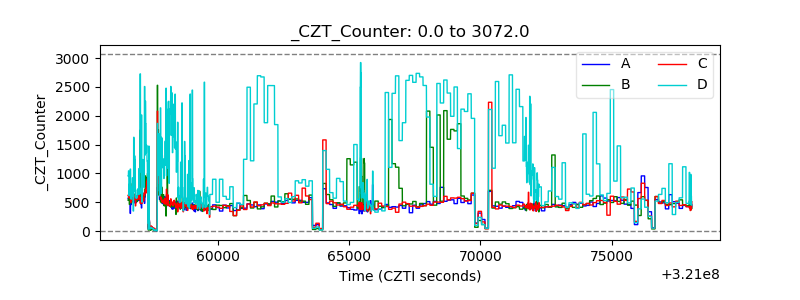 |
| +2.5 Volts monitor |  |
| +5 Volts monitor |  |
| _ROLL_ROT | 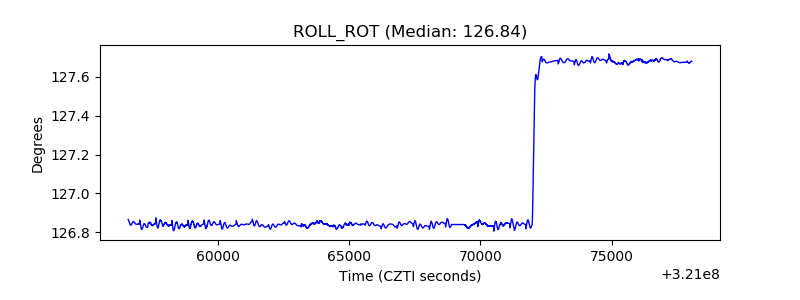 |
| _Roll_DEC | 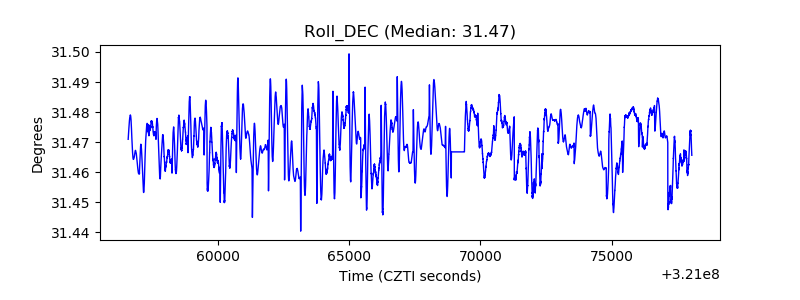 |
| _Roll_RA | 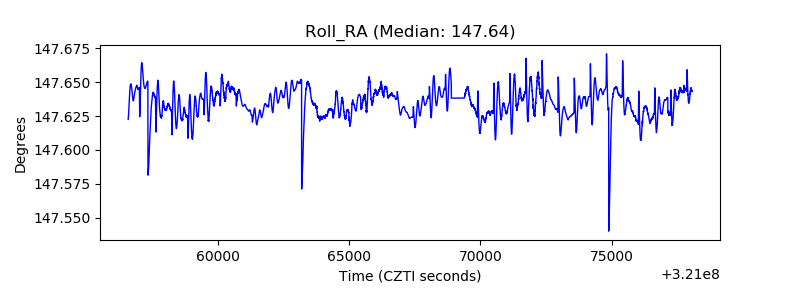 |
| Veto Counter | 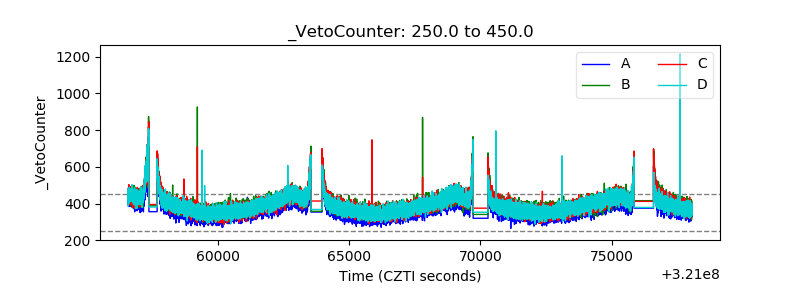 |